


IntelliPaper
Abstract
A data set of 1286 heterosexual dating individuals, grouped into 643 couples (406 couples in a Proximate relationship; 237 couples in a Distance relationship), were employed to explore Proximate/Distance similarities and differences in the dynamic of factors that predict relational satisfaction between couples. The primary dependent variable, couple relational satisfaction, was measured with eight items from the GWS and three items from the KMS. Primary predictor variables included eight composite variables (relationship satisfaction, emotional engagement, emotional regulation, family & friend support, shared activities, accuracy of perception, positive illusions, identity, and compatibility). A number of individual variables were also employed, including loneliness, separation, permanence, enjoyment of sex, nurturance, disclosure, emotional stability, co-dependence, and others. A crisscross technique (rate self and partner across all variables) facilitated many comparative procedures. Correlations, t-tests, regressions, and structural equation modeling contributed toward the final picture. Results indicate that (a) Distance couples boast a healthier overall personal and couple profile; (b) accuracy of perception plays a much larger role for Distance couples than for Proximate; (c) nurturance follows a similar pattern with a greater impact for Distance couples; (d) family & friend support plays a larger role in Proximate relationships; (e) emotional regulation plays a larger role for Proximate couples; (f) enjoyment of sex is a significant predictor for Proximate couples but not for Distance; and (g) loneliness, highly characteristic of Distance relationships, does not have a negative impact on relational success for Distance couples but significantly diminishes relational satisfaction for Proximate couples. Findings are discussed and avenues for future research explored.
Explore Digital Article Text
Introduction
In every era, circumstances have often forced romantic relationships to be maintained at distance, and the liabilities of such relationships have been endlessly discussed and agonized over. Over time, two foundational contrasting theories have emerged about the potential benefits or liabilities of distance relationships. Theory #1 states that distance relationships are at greater risk (than their proximate counterparts) because, due to lack of much contact, partners develop positive illusions about each other that contrast sharply with reality. Theory #2 states that Distance relationships are healthier because partners must work much harder to ensure Relational Success. Psychological research has explored both theories to understand the merits of each (e.g., Mietzner, 2005; Sahlstein, 2004; Waterman, 2017; Acost-Rodas et al., 2020; Stafford, 2010; Suwinyattichaiporn et al., 2017).
The results have been mixed, leading to the primary purpose of the present study.
We pause a moment to operationalize our terms. A "Proximate" relationship is one in which the partners are in the same geographic location, close enough that daily in-person contact is possible. A "Distance" relationship is one in which the partners are geographically at a distance in which daily in-person contact is not possible. For clarity, the terms Proximate and Distance are capitalized throughout the paper.
The topic of Distance relationships has occupied a good deal of academic attention. However, differences between Proximate and Distance relationships have not been so heavily explored. Past studies frequently select a sample of individuals (or couples) in a long-distance romantic relationship and then explore topics such as (a) the impact of technology on communication patterns (Acost-Rodas et al., 2020; Wang et al., 2019), (b) the use of social media in supporting relationships (Billedo et al., 2015; Gutzmann, 2018; Zamanifard & Freeman, 2019), (c) the impact of social media on the increase of distance relationships (Acosta-Rodas et al., 2020), (d) the facilitation of personal growth when partners are at distance (Mietzner, 2005; Sahlstein, 2004; Waterman et al., 2017), (e) the importance of peer support (Roberts, 2003; Westefeld & Liddell, 1982), (f) the impact of attachment styles (secure, insecure, avoidant) on Relational Success (Pistole et al., 2010; Roberts & Pistole, 2009; Williams, 2021), (g) the problem of idealization and positive illusions in distance relationships (Stafford & Merolla, 2007; Suwinyattichaiporn et al., 2017), (h) the impact of future planning on Relational Success (Sahlstein, 2006), (i) gender differences in adjusting to physical separation (Cameron & Ross, 2007; Helgeson, 1994; Henderson et al., 2023), (j) the quality and frequency of communication (Holt & Stone, 1988; Holtzman et al., 2021), (k) the impact of commitment in distance relationships (Gonzalez, 2011), (l) the impact of technology on sexual expression when at distance (Goldsmith & Byers, 2018; Kidwell, 2021), (m) the impact of relationships that were previously long distance on future marriage (Du Bois et al., 2015), (n) the fact that college students have a greater incidence of distance relationships than any other demographic group (Beckmeyer et al., 2021; Waterman et al., 2017), and (o) the importance of savoring past experiences for those at distance (Borelli et al., 2014).
Each topic was considered as authors crafted the present research. Whereas the previous paragraph identifies broad themes of general research in the domain of Distance relationships, only a limited number of studies attempted to identify differences between couples in Proximate and Distance relationships. A summary of such research follows.
Previous studies have found it difficult to identify differences between those involved in Proximate and Distance relationships. Often, differences found are either tautological (couples at Distance have less face-to-face communication), differences are not robust, or different studies end up with contradictory results. For instance, for the variable Relationship Satisfaction, results from literature are mixed. Some find that Distance couples are less satisfied (Horn et al., 1997), some indicate that there is no difference between Proximate and Distance in satisfaction (e.g., Peterson, 2014; Roberts, 2003; Guldner and Swensen, 1995; Goldsmith & Byers, 2018), and some find that Distance relationships are more satisfied (e.g., Stafford & Merolla, 2007; Borelli et al., 2014; Kelmer et al., 2013). Other findings support that Distance relationships (a) have less self-Disclosure (Van Horn et al., 1997); (b) have less companionship (Van Horn et al., 1997); (c) are more Lonely (Waterman et al., 2017; Firmin, Firmin & Lorenzen, 2000); (d) have higher dedication and commitment to the relationship (Beckmeyer et al., 2021; Kelmer et al., 2012); (e) have less intimacy (Greenberg & Neustaedter, 2012); (f) have more intimacy (Guldner & Swensen, 1995); (g) are more likely to use social media to communicate (e.g., Greenberg & Neustaedter, 2013; Holtzman et al., 2021; Zamanifard & Freeman, 2019); (h) do not differ from their Proximate counterparts on Sexual satisfaction (Goldsmith & Byers, 2018; Goldsmith and Byers, 2020); (i) experience a lower network of peer support (Parke et al., 2013); (j) have less mutual trust (Dainton & Aylor, 2002); (k) participate in more activities together (Greenberg & Neustaedter, 2013); (j) do not differ from Proximate relationships in frequency of conflicts and resolution of those conflicts (Beckmeyer et al., 2021; Cionea et al., 2018); and a few other individual findings.
The present research has two primary objectives. First is to explore differences in the dynamic of factors that predict Relational Success in Proximate and Distance relationships. The second is to gain a more holistic view of the interplay of such factors on Relational Success. As noted in research cited earlier, most studies address only a small segment of personal and interactive qualities that might contribute to (a) differences between Proximate and Distance couples or (b) factors associated with the success of those relationships. Gestalt psychologists argue that it is critical, from time to time, to step back and look at the complete picture. With the wide array of predictor variables employed in the present study, structural equation modeling assists in creating this "complete picture".
Challenges of Research in this Area
One challenge of finding Proximate-Distance differences is the arbitrary nature of the terms. The words "Proximate" and "Distance" only identify a physical reality. A couple who has dated for three years and been separated for two months find themselves in the same category as a couple who met online, are dating, and have never even met each other. The difference of acquaintanceship potential is substantial. In the present study, in addition to the categorical Proximate-Distance variable, we created a quantitative Acquaintance-Potential variable out of descriptive information from each participant.
A second challenge of working with dating couples is difficulties with the primary dependent variable, Relationship Satisfaction (abbreviated "RS" throughout the paper). Taylor and Brown (1988), in their much-publicized research, noted that positive illusions are alive and well in relationships. They documented that about 80% of people in almost any accomplishment or personal domain think they are above average. One author has measured marital satisfaction several times in studies with married couples, and Taylor and Brown are verified, in fact, exceeded. On a 7-point, multiple-item scale, 91.5% of married couples in these studies rate their relationships above "mid" (about as happy as other married couples) [George, Luo et al., 2015; George, Anderson et al., 2023; George, Lewis et al., 2023; George, Saugh et al. 2023]. The problem is compounded when dating couples rate their own relationship satisfaction. While the mean RS for married couples is 5.82 on a 7-point scale (from the same studies cited above), dating couples often average 6.5 on the same scale. In the present study, more than 99% of participants rated their Relationship Satisfaction greater than 4 (about as happy as other dating couples). This results in limited variability and psychometric distortion. In the Results section we discuss methods to resolve the problem.
The final issue is expected in any correlational study that attempts a comprehensive look with many variables; that is, the issue of multicollinearity or linear dependency. As the number of variables increases, the issue of multicollinearity becomes increasingly challenging (see George & Mallory, 2024 for a review). The first line of defense addressed our primary dependent variable, Relationship Satisfaction. Not only was our measure of Relationship Satisfaction highly internally consistent ( ), but also no questions that measure this construct are included as either predictor variables or as indicators of composite predictors. Then, there is the problem of intercorrelations between the many predictor variables. Regressions, partial correlations, factor analysis (both confirmatory and exploratory), and internal consistency measures (Coefficient alpha) are used to minimize intercorrelation between composite predictors. While it is impossible to eliminate multicollinearity, all statistical resources have been employed to minimize these challenges.
Hypotheses
The authors felt that to document 20 or 25 different hypotheses would be distractive. In literature just cited, we anticipate (hypothesize) similar results where researchers agree. But the task of the study extends well beyond confirmation of hypotheses or replication of prior studies. We seek to move toward a more complete understanding of how the dynamic of factors that contribute to Relational Success operate differently in Proximate relationships and Distance relationships.
Method
Initially, 2,030 individuals opened the link that accessed the questionnaire; 316 forms were deleted due to no data entered, incomplete data, or other irregularities. Of the remaining 1,714 participants, 1,286 (643 couples) fit the required criteria of "dating, heterosexual couples". Those who did not fit this criterion were not included in analyses. Participants originated from 44 U.S. states and 13 foreign countries. The ethnic breakdown of the sample was 84% White, 7% Black, 6% Hispanic, 2% Asian, and 1% Other. The mean age of the sample was 21.1 years with a range of 18 to >44 years. The mean length of the relationship was 1.8 years with a range of 1 month to >3 years. Education levels averaged about 2.3 years of university (range: <HS - doctorate).
This study was approved by the university Institutional Review Board prior to data collection.
Materials
Materials included separate but identical questionnaires for the subjects and partners. The survey was crafted with gender-neutral wording allowing men and women to complete the same form. Questionnaires were administered to all participants through an internet link to a Qualtrics survey.
The questionnaires were structured in the following way: The initial screen identified the sponsoring organization, provided a brief description of the study, assurance of anonymity, informed consent, debriefing, and further instructions about how to complete the questionnaire. Instructions were followed by 11 demographic items. After this, 39 randomly distributed questions assessed issues of emotional engagement, emotional regulation, destructive interactions, shared activities, and the support of family and friends. The next set of questions assessed strength of essence qualities in 13 different areas, 4 questions dealt with modes of communication, 4 questions measured temperament, 12 items measured personality traits, and 17 questions assessed Relationship Satisfaction.
Of the 88 questions (following the demographic items), 10 of the questions were individual (asking the participant only their own perspective), and 78 (or 39 pairs) were paired so that participants answered the question about themselves and a parallel question assessing their partner on the same quality. This procedure employs crisscross methodology widely used in couples research (see Szinovacz & Egley, 1995 for a review). To illustrate, one question used in the study was "How good a listener are you when your partner speaks?" The man rated how good a listener he thinks he is and how good a listener he feels his partner is. The woman also answered the same question about herself and her partner. Crisscross techniques allow greater objectivity by averaging each subject's self-rating with the partner's rating of the subject. It also enables creation of variables that contrast the perspectives of the partners such as Accuracy of perception, Positive Illusions, and Compatibility.
Procedure
The final data set provided anonymity for all participants. There was no identifying information in any of the questions posed, and the data file was password protected so that only the researchers had access to it. Acquisition of participants by students provided unique potential for biases or invalid forms. The authors used many resources (time to complete the form, missing data, irregular responses, identical forms, and others) to ensure all data analyzed came from valid participants.
Variables
There are many individual and composite variables involved in this study. To streamline the paper, we provide a "Variables" section that includes some components of both the Method and Results. Common to any Method section, we identify how variables are crafted and measured. In addition, several of the composites are mathematically complex and often involve factor analysis to support their creation. By incorporating mathematical underpinnings into this section, all composite variables are reported in one location and in order. Table 1 summarizes the variables created, indicators involved, measures of internal consistency (when applicable), and lists of standard psychometrics.
Defined terms: A "criss-crossed" variable refers to the mean of the self-rating of the subject and the partner-rating of the subject. A "couple-specific" variable (or composite) identifies questions that refer to the couple as a unit, such as "how often do the two of you have a stimulating exchange of ideas?" A "gender-neutral" variable refers to composite variables that includes both the male and the female perspectives. Factor analysis suggested that Emotional Engagement and Emotional Regulation are qualities that don't exist in isolation but require a dynamic between both partners. Hence, both these variables are designated as gender-neutral. For clarity, all variable names are capitalized. Example:
emotional engagement is measured by the variable "Emotional Engagement".
Relationship Satisfaction (men and women): The primary dependent variable was a composite of two different relationship-satisfaction questionnaires: The 8-item George-Wisdom Relationship Satisfaction Scale (GWS) (George & Wisdom, 2016) and the 3-item Kansas Marital Satisfaction Scale (KMS) (Schumm et al., 1983). The George-Wisdom scale asks questions about eight specific areas that measured Relationship Satisfaction, including: security, feeling loved, experience of joy, appreciation, trust, respect, enjoyment of activities, and fun & laughter. The KMS asks three global questions about satisfaction with the relationship, satisfaction with their partner, and how well the partner fulfills their needs. All 11 items were assessed on 7-point scales; anchors varied based on the nature of the questions. The final measure of RS was the mean of the 11 items. These 11 questions, with a mix of specific and global, yielded excellent internal consistency (alphas of.93 for both men and women).
Variables Created From Qualitative Material: Three quantitative variables were created from qualitative questions. Participants were asked to identify how they met, when the relationship began, and the pattern of separate or together time during their relationship. These new quantitative variables were created and measured based on the assessment and consensus of three of the authors.
How they met: This identified and assigned the way the couple met to 11 different categories (e.g., online, at a party, known each other since childhood, in high school, etc.).
Length of proximate time together: The when-they-began-dating information along with their pattern-of-separate-and-together-time identified how long they were actually in the same geographic location; deleting times when they were physically separated or not romantically involved. The final measure was simply the number of months in which their relationship was proximate.
Acquaintance Potential (AQP): AQP was crafted from the how-they-met variable (e.g., "met online" would receive fewer points than "grew up together"), and the pattern-of-separate-and-together-time variable (greater amount of proximate time received higher credit). This variable was coded on a 7-point Likert scale with "1" indicating low AQP and "7" designating high AQP.
Other Predictor Variables: Emotional Engagement (gender neutral). (Note: "m/w" indicates the perspective of both men and women). The first composite was the mean of 12 crisscrossed variables: expressing Affection (m/w), expressing Verbal Love (m/w), expressing Feelings (m/w), using Love Languages effectively (m/w), understanding Emotional Needs (m/w), and supporting the Growth of their partner (m/w). Internal consistency: .
Emotional Regulation (gender neutral): The second composite was the mean of 12 crisscrossed variables and included: Patience (m/w), Criticism —reverse coded (m/w), Problem Resolution orientation (m/w), Looking for the Good in their partner (m/w), Listening skills (m/w), and the couple-specific variables: Frequency of Conflicts and skill at Resolving Conflicts. Internal consistency: .
Support: The men's and women's rating for Support of Friends and Support of Family. Internal consistency: .
Shared Activities: The mean of the five variables measured shared Activities; all activities were couple specific and involved (a) shared Projects, (b) Stimulating Exchange of Ideas, (e) shared Traditions, (d) Planning for the Future, and (e) number of Dates. Internal consistency: .
Individual variables: A number of variables did not group well with other factors in the Factor Analysis structure. There were some surprises; for instance, enjoyment of the Sexual relationship did not factor in with Emotional Engagement. The following variables are included in analyses-all are crisscrossed, all are rated on 7-point scales with "1" representing less of the quality and "7" indicating more of the quality.
Loneliness (men & women)
Need for Space (men & women)
Likelihood of Permanence of the relationship (men & women)
Sexual enjoyment (men & women)
High "I" temperament—Spontaneous, extroverted (men & women)
High "S" temperament—supportive, Nurturing (men & women)
Amount of self-Disclosure (men & women)
Emotional Stability (men & women)
Codependence (men & women)
Face-to-Face communication (couple specific)
Written communication (couple specific)
Phone (audio) communication (couple specific)
Zoom (audio and visual) communication (couple specific)
The computed variables overview: The computed variables include Accuracy of perception for men and for women, Compatibility as measured by congruence of essence qualities (couple specific), Strength of Identity for men and for women, and Positive Illusions for men (viewing his girlfriend more positively than the girlfriend views herself), and women (viewing her boyfriend more positively than the boyfriend views himself).
Essence qualities are central to the computation of two variables; hence some explanation is required. The concept of essence qualities was first introduced to academic literature in 2020 (George, Wisdom et al.). These are qualities that identify the contents of the Identity of an individual. In the present study, 13 essence qualities are listed, and participants rated (on a 7-point scale) to what extent each quality defines them. For example, one of the 13 is "enthusiastic pursuit of fitness" with anchors of Avoid activity at all cost (1), to moderately (4), to fitness enthusiast (7). These ratings can be used to calculate the strength of Identity (the mean of the 13) or to construct a Personal Similarity Correlation (PSC) to identify how congruent the couple is on these essences. Essence qualities in this study include social, patient, cherish family and family events, growth orientation, spiritual, musical or artistic, neat, planful, fitness enthusiast, perceptive, risk-taker, humorous, and adventurous.
Compatibility: PSC of the essence qualities (couple specific). Personal Similarity Correlation (PSC) has gained visibility in the relationship-satisfaction literature in recent years (George, Luo et al., 2015; George, Wisdom et al., 2020; George, Anderson et al., 2023; Luo & Klohnen, 2005; Luo, Chen et al., 2008). A PSC involves the calculation of the correlation between constructs shared by both couples. In this study, it is the correlation between the 13 essence qualities that couples share. A negative correlation suggests that their essences contrast with each other—such as a professional musician married to someone who hates music. A zero correlation suggests that their essences are unrelated to each other. A positive correlation suggests that their essence qualities are shared—one measure of Compatibility. This variable ranges theoretically from -1 (polar-opposites on all 13 qualities) to +1 (identical on all 13). Actual PSC scores ranged from -.80 to.99.
Strength of Identity (men and women): For men and women respectively, this is the mean of the crisscrossed ratings of the 13 Essence Qualities. The rationale is that the higher the rating across these 13 contrasting qualities, the stronger their self Identity. This variable ranges theoretically from 1 (lowest score on all 13) to 7 (highest score on all 13). Actual strength-of-Identity scores ranged from 2.96 to 6.88 (men) and 3.04 to 6.71 (women). Internal consistency is irrelevant as the 13 variables are crafted as contrasting qualities.
Accuracy of perception (men and women):
Accuracy measures were calculated for men and women. For all variables employed, Accuracy is the mean of the absolute values for (a) 38 variables that measure the man's rating of his girlfriend minus the girlfriend's self-rating; and (b) 38 variables that measure the woman's rating of her boyfriend minus the boyfriend's self-rating. See Table 1 for the formula. The objective is to measure how accurate the couples are at perceiving each other. All scores are positive and range from 0 (identical perspectives) to 6 (polar-opposite perspectives). Actual Accuracy of perception scores ranged from.11 to 2.49 (men) and.08 to 2.82 (women).
Enhancement (men and women): The impact of Enhancement (often referred to as "positive illusions") on Relationship Satisfaction has been heavily researched in the last few decades—with mixed results (e.g., Taylor & Brown, 1988; Neff & Karney, 2002; George, Wisdom et al., 2020). In this study, Enhancement was the mean of the sum of discrepancies (across all valanced variables) between the subject's self rating and the partner's rating of the subject. See Table 1 for the formula. A positive value indicated partner enhancement (rating the partner higher than the partner rated him or herself). A negative score referred to partner diminishment (rating the subject lower than the subject rates him or herself). A zero-value suggests neither enhancement nor diminishment. This variable theoretically ranges from -6 (opposite negative ratings) to +6 (opposite positive ratings). Actual Enhancement scores range from -2.21 to 1.58 (men) and -1.94 to 2.09 (women).
Results
Psychometrics of key predictor and criterion variables: There were 37 predictor variables. Psychometrics were excellent for 21 of those variables (skewness and kurtosis between 1), were acceptable for 13 of the variables (skewness and kurtosis between 2), and were problematic for two variables: Family & Friend Support (-1.68/2.16) and Written Communication (-2.22/3.64). See George and Mallory (2024) for a discussion of psychometric validity. No linear manipulations improved psychometrics of these two variables and the authors chose to include them in analyses with awareness of their limitations.
As noted in the introduction, the primary criterion variable, Relationship Satisfaction (RS), evidenced both severe skewness and kurtosis due to the large number of high ratings. The values with the initial data set resulted in a skewness of -2.39 and a kurtosis of 6.97. A first step was to replace missing values (fewer than 2%) with predicted values from regression equations. Next, frequency data indicated that there were 17 (out of 1286) that scored lower than 4.0. With a standard deviation of.8, a score of "1" would be seven standard deviations below the mean. A score of "4" is more than four standard deviations below the mean. As such, these low values are extreme outliers. To resolve this issue, the authors capped low scores at ≤ 4, that is, all values less than 4 were recoded to a single value of "≤ 4". No log manipulations improved the psychometrics. This process improved psychometrics to a skewness of -1.78 and a kurtosis of 2.66. Although not ideal, this was the dependent variable employed for men, women, and couple-satisfaction (the mean of the men's and the women's scores). See Table 1 for the psychometrics and method of construction of all primary variables.
The Influence of Demographics
For this section the entire data set is employed without making distinction between Proximate and Distance.
Gender differences: For gender differences that follow, all significance values are less than.001, N = 643. In this data set, women had greater Accuracy of perception [Ms = 1.00 vs. 1.06, t(642) = 6.89], were more Lonely [Ms = 3.15 vs. 2.80, t(642) = -7.19], wanted more Time Together [Ms = 4.59 vs. 4.44, t(642) = -4.15], were more Nurturing [Ms = 6.08 vs. 5.86, t(642) = -5.92], provided more self-Disclosure [Ms = 5.81 vs. 5.44, t(642) = -8.77), and tended to be more Codependent [Ms = 3.11 vs. 2.83, t(642) = -8.24]. Men enjoyed Sex more [Ms = 6.52 vs. 6.32, t(642) = 6.95], and were much more Emotionally Stable [Ms = 5.53 vs. 4.10, t(642) = 20.99].
Education: Level of education had a significant impact on a number of the predictors, all in the positive direction. The order of r- and p-values is men, then women. Results found that those with more education had greater Accuracy of perception , indicated greater likelihood of Permanence in the relationship , provided more self-Disclosure .002], and were less Codependent . Women had higher Emotional Stability . There were no ethnic differences of interest.
Proximate-Distance Differences
The following are one-tail significant differences between Proximate and Distance couples based on Independent-samples t-tests. The "d" refers to Cohen's d and indicates how different (in standard deviations) mean values are for the two groups. To simplify statistical output, the degrees of freedom for all t-tests is 641. The first set of differences are so expected that they are essentially tautological: Note: M = men, W = women, C = couple. The direction of influence is noted in parentheses following each construct.
M Lonely: , , (Distance lonelier)
W Lonely: , , (Distance lonelier)
M Space from each other: , , (Distance too much space)
W Space from each other: , , (Distance too much space)
C Face-to-face communication: , , (Proximate more f-t-f)
C Writing: , , (Distance more writing)
C Phone: , , (Distance more telephone)
Otherwise, where there were differences, Distance relationships revealed a more positive profile than Proximate relationships across all significant comparisons. Although some of the differences are not strong (always ) the superior profile of Distance relationships is 100%. Once again, degrees of freedom for all t tests is 641.
RS men: , , (Distance more satisfied)
RS women: , , (Distance more satisfied)
RS couple: , , (Distance more satisfied)
C Length of relationship: , , (Distance longer)
C Emotional Engagement: , , (Distance greater engagement)
C Emotional Regulation: , , (Distance better regulation)
M/W Strength of Identity: , , (Distance stronger identity)
C PSC Compatibility: , , (Distance more compatible)
M/W Permanence: , , (Distance permanence more likely)
M/W Nurturing: , , (Distance more nurturing)
M/W Disclosure: , , (Distance more disclosure)
M/W Codependent: , , (Proximate more codependent)
The Influence of the Acquaintance Potential Variable (AQP)
The Acquaintance Potential Variable was created from two qualitative variables: how the relationship began and the amount of time the relationship was proximate. The authors were hopeful that a continuous AQP would be more discerning in uncovering differences between couples than the categorical Proximate and Distance variable. The impact of AQP was not as strong as anticipated.
There were interesting correlations (when two values are reported, the men's value is first followed by the woman's). Combining both Proximate and Distance relationships, higher AQP was associated with greater likelihood of Permanence ((rs =.278/.260), (ps <.001)), lower levels of Co-dependence ((rs = -.153/-.177), (ps <.001)), more Activities ((r =.239), (p <.001)), greater Family & Friend Support ((r =.146), (p <.001)), greater Accuracy of perception ((rs = -.08/-.07), (ps =.025/.049)), greater self-Disclosure for women ((r =.070, p =.038), and greater Emotional Stability for men (r =.077, p =.026).
Predictors of Relationship Satisfaction, Bi-Variate Correlations
Since Relationship Satisfaction is the primary dependent variable, we report significant correlations between RS for men, RS for women, and RS for couples. Only correlations higher than.30 for all three RS measures (order: men, women, couple) are reported here. All significance values are p <.001, N = 643. Correlations are listed from high to low. Variables that rated high in bivariate correlations turned out to be major players in the final structural model.
The greatest predictor of RS is Emotional Engagement (rs =.61,.62,.70); this was followed by Emotional Regulation skills (rs =.55,.59,.65); then, Family & Friend support (rs =.50,.56,.61); shared Activities (rs =.43,.41,.48); women Accuracy of perception (rs = -.43, -.43, -.49); men Accuracy of perception (rs = -.42, -.34, -.43). A quick note: the negative values indicates that deviation from Accuracy hurts the RS. The woman's rating of the Permanence of the relationship (rs =.42,.42,.48); the woman having high Nurturance (rs =.40,.32,.41); the man's rating of the Permanence of the relationship (rs =.38,.34,.42); the woman's self-Disclosure (rs =.36,.33,.39); the man's enjoyment of the Sexual relationship (rs =.35,.32,.38); the woman's enjoyment of the Sexual relationship (rs =.32,.30,.35); and the man having high Nurturance (rs =.31,.33,.37).
An interesting contrast for a variable that did not achieve greater than.3 in all categories is Positive Illusions: For men with Positive Illusions (rating his girlfriend higher than the girlfriend rated herself) the correlation with his RS was strong and positive (r =.39, p <.001), but his girlfriend had a significant negative response (r = -.07, p =.045). For women with positive illusions (rating her boyfriend higher than the boyfriend rated himself) the correlation with her own RS was also strong and positive (r =.32, p <.001) but her boyfriend also had a significant negative response (r = -.13, p <.001). The clear takeaway is that the one with positive illusions tends to enjoy their misperception, however, their partner does not.
Multiple Regression Analyses
Two regressions are reported here: (a) the impact of predictors on Proximate RS, and (b) the impact of predictors on Distance RS. The dependent variable for both regressions is Couple RS (the mean of the men's RS and the woman's RS). All regressions use Stepwise method of variable selection with a p-to-enter of.05 unless otherwise noted.
Proximate relationships using Couple RS as the DV: For Proximate relationships, eight variables entered the regression equation: , , p <.001. Thus 70.7% of the variance in Proximate relationship's RS is accounted for by the predictors. Individual predictors follow, order based on magnitude of Beta values:
The greatest predictor of Couple RS for Proximate couples was their Emotional Regulation ( ), followed by their Emotional Engagement ( ), then, Family & Friend support ( ), less feeling of Loneliness for men ( ), shared Activities ( ), the men's Positive Illusions ( ), the women's enjoyment of the Sexual Relationship ( ), and the number of shared Dates ( ).
Distance relationships using Couple RS as the DV: For Distance relationships, there was lower statistical power than for Proximate relationships (Note DF differences: 1, 366 vs. 1, 228), and the set of predictors was quite different. Eleven variables entered the regression equation: , , p <.001. Thus 65.9% of the variance in Distance couple's RS is accounted for by the predictors. Individual predictors follow, order based on magnitude of Beta values:
The greatest predictor of Couple RS for Distance couples was their Emotional Engagement ( ), followed by the woman's rating of the Permanence ( ), then, their Emotional Regulation ( ), the men's level of self-Disclosure ( ), and Family & Friend
Support ( ). Couples' RS was diminished by a longer relationship ( ), and the woman's Codependence ( ). Finally, the couples' RS was enhanced if the woman perceived her partner Accurately ( ), the man was Nurturing ( ), had stronger Emotional Stability ( , p =.08), and there was more Face-to-Face communication ( , p =.08).
Of interest is that only three variables as predictors of Couple RS are shared by Proximate and Distance couples ( values that follow are Proximate then Distance): Emotional Engagement ( ), Emotional Regulation ( ), and Family & Friend Support ( ). Only for Emotional Engagement are the scores similar. Five of the Proximate predictors and eight of the Distance predictors are unshared. Structural equation modeling confirmed (and expanded on) discrepancies revealed in the regression analyses.
Structural Equation Modeling
Creating a structural model with the data set presented challenges. There were 32 predictor variables for Proximate relationships and 32 predictor variables for Distance relationships. The resulting models were so complex that, even though fit indices suggested an excellent model fit, they were almost impossible to interpret.
The answer involved choosing to use only "couple variables" in the analyses. Several of the variables were already coupled: Relationship Satisfaction was the mean of the men's and the women's RS. Other variables were either couple specific (AQP, Length of the relationship, shared Activities, PSC Compatibility), or were determined to be interactive (hence "gender-neutral") and already included the perspectives of both men and women (Emotional Engagement, Emotional Regulation). Other variables were coupled by averaging the crisscrossed values for men and women for each predictor. For instance, the variable "Emotional Stability" in the model would be the average emotional stability of both partners. Variables that were thus coupled included: Friend & Family Support, Strength of Identity, Accuracy of perception, Positive Illusions, Loneliness, Space from each other, rating the Permanence of the Relationship, enjoyment of their Sexual relationship, Nurturance, amount of self-Disclosure, Emotional Stability, and Codependence.
By thus simplifying the model, the number of variables was reduced from 32 to 18 (14 for the Distance model) and systematic differences between Proximate and Distance couples emerged that evaded us earlier. Essentially, the structural models considered "how shared personal qualities in the relationship impact each other and the primary dependent variable, couple RS."
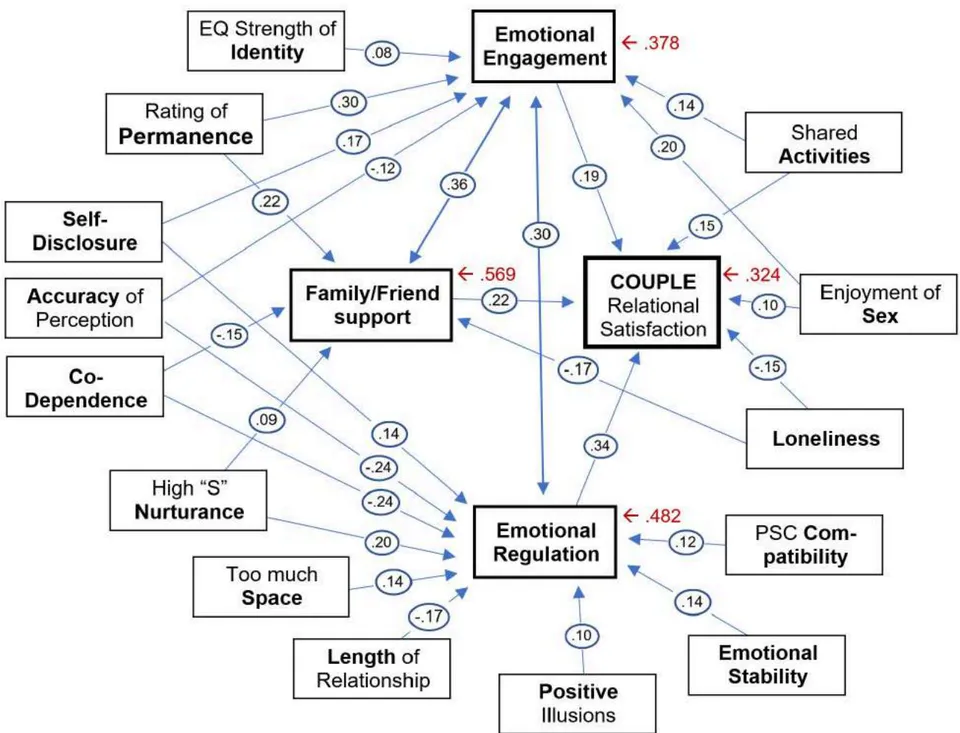
The structural model for Proximate relationships: The sample size (N = 406 couples) is entirely adequate for structural equation modeling based on the Bentler and Chow criterion of at least a 5:1 ratio of participants to free parameters (Bentler & Chow, 1987). With 36 free parameters the Proximate model has an 11:1 ratio. For the final Proximate model fit indices include: (34, N = 406) = 43.48, p =.13; the Root Mean Square Error of Approximation (RMSEA) was.027; the 90% CI ranged from 0 to.05; The Comparative Fit Index (CFI) was.993. All predictors were allowed to covary. These values indicate an excellent model fit (Hu & Bentler, 1999).
The Proximate model employs four dependent variables and 14 predictors—described in paragraphs that follow. The primary dependent variable is Couple RS; the other three dependent variables are Emotional Engagement, Emotional Regulation, and Family & Friend Support.
Couple RS: The predictors of Couple RS include Emotional Regulation ( ), Family & Friend Support ( ), Emotional Engagement ( ), shared Activities ( ), less Loneliness ( ), and enjoyment of the Sexual relationship ( ). The residual for Couple RS (.324) indicates that 67.6% of the variance is explained by these six variables.
Emotional Regulation: The predictors of Emotional Regulation include better Emotional Engagement ( ), greater Accuracy of perception ( ), less Codependence ( -.24), more Nurturance ( ), a shorter relationship ( ), more Separation ( ), more self-Disclosure ( ), higher Emotional Stability ( ), greater PSC Compatibility ( ), and more positive Illusions ( ). The residual for Emotional Regulation (.482) indicates that 51.8% of the variance is explained by these ten variables.
Emotional Engagement: The predictors of Emotional Engagement include better Friend & Family Support ( ), more Emotional Regulation ( ), greater rating of Permanence ( ), greater enjoyment of the Sexual relationship ( ), more self-Disclosure ( ), more shared Activities ( ), better Accuracy of perception ( ), and greater strength of Identity ( ). The residual for Emotional Engagement (.378) indicates that 62.2% of the variance is explained by these eight variables.
Family & Friend Support: The predictors of Family & Friend support include better Emotional Engagement ( ), greater rating of Permanence ( ), less Loneliness ( ), lower rating of Codependence ( ), and more Nurturance ( ). The residual for Family & Friend support (.569) indicates that 43.1% of the variance is explained by these five variables.
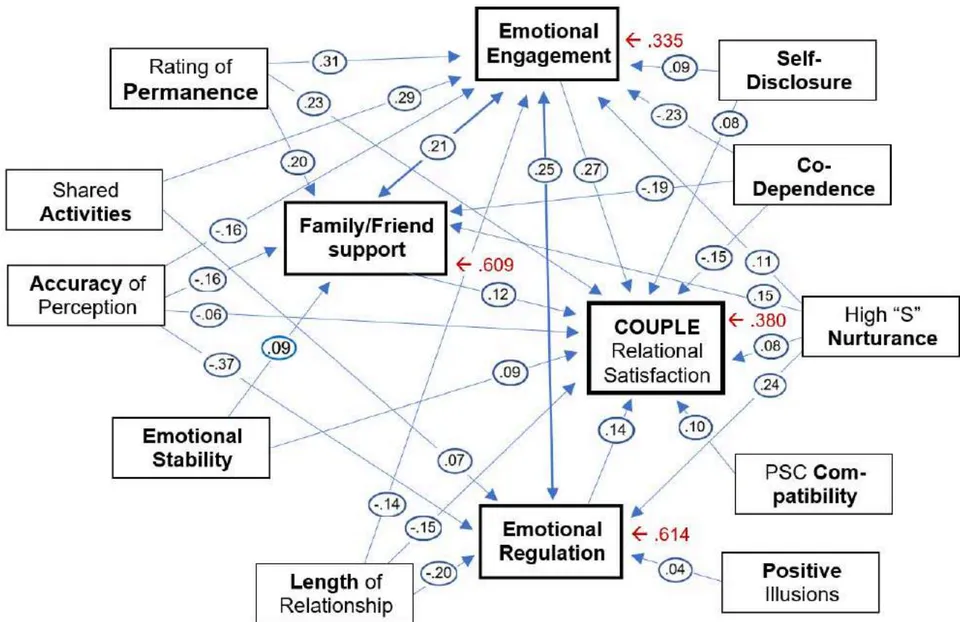
The structural model for Distance relationships: The sample size (N = 237 couples) is adequate for structural equation modeling based on the Bentler and Chow criterion of at least a 5:1 ratio of participants to free parameters (Bentler & Chow, 1987). With 38 free parameters the Distance model has a 6:1 ratio. For the final Distance model fit indices include: (16, N = 237) = 26.102, p =.053; the Root Mean Square Error of Approximation (RMSEA) was.055; the 90% CI ranged from 0 to.09; The Comparative Fit Index (CFI) was.984. All predictors were allowed to covary. These values indicate a good model fit (Hu & Bentler, 1999).
The Distance model employs four dependent variables and 10 predictors—described in the following paragraphs. As with the Proximate model, the primary dependent variable is Couple RS; the other three are Emotional Engagement, Emotional Regulation, and Family & Friend Support.
Couple RS: The predictors of Couple RS include Emotional Engagement ( ), greater rating of Permanence ( ), less Codependence ( ), a shorter relationship ( ), Emotional Regulation ( ), Family & Friend Support ( ), greater PSC Compatibility ( ), greater Emotional Stability ( ), more Nurturing ( ), more self-Disclosure ( ), and greater Accuracy of perception ( ). The residual for Couple RS (.380) indicates that 62% of the variance is explained by these nine variables.
Emotional Regulation: The predictors of Emotional Regulation include greater Accuracy of perception ( ), better Emotional Engagement ( ), more Nurturance ( ), a shorter relationship ( ), more shared Activities ( ), and more positive Illusions ( ). The residual for Emotional Regulation (.614) indicates that 38.6% of the variance is explained by these seven variables.
Emotional Engagement: The predictors of Emotional Engagement include greater rating of Permanence ( ), more shared Activities ( ), Emotional Regulation ( ), better Friend and Family support ( ), better Accuracy of perception ( ), a shorter relationship ( ), more Nurturance ( ), and more self-Disclosure ( ). The residual for Emotional Engagement (.335) indicates that 64.5% of the variance is explained by these eight variables.
Family & Friend Support: The predictors of Family & Friend support include better Emotional Engagement ( ), greater Permanence ( ), lower rating of Codependence ( ), greater Accuracy of perception ( ), more Nurturing ( ), and greater Emotional Stability ( ). The residual for Family & Friend support (.609) indicates that 39.1% of the variance is explained by these five variables.
Discussion
The discussion begins by a thorough assessment of relevant findings from the two structural models. This will be followed by additional findings from other analyses. We will conclude with key takeaways, limitations of the study, and avenues for future research.
Proximate-Distance Differences based on the Structural Model
The two structural models provide some systematic differences between Proximate and
Distance relationships. To assist in clarity, in the discussion below, we will often include the beta weights as we discuss the relative impact of variables on each other. Since beta weights are partial correlations that exclude variance due to other variables in the model, those values can often be summed (there are some exceptions) to identify the relative impact of a particular variable in the model (see Zeiglari, 2017). We also often exclude the " " as we identify beta weights. For instance: "Enjoyment of the Sexual Relationship predicted Couple RS (.10) and Emotional Engagement (.20)."
Variables in the Proximate Model that were not in the Distance Model. Four variables played a role in the Proximate model that were not present in the Distance model. Strength of Identity is not discussed as the impact was minor. However, in the Proximate model three variables played a substantial role: (a) enjoyment of Sex [predicts higher Couple RS (.10) and greater Emotional Engagement (.20)]; (b) the impact of Loneliness [predicts lower Couple RS (-.15) and less Family & Friend support (-.17)]; and (c) the influence of distress due to too much Separation [predicts greater Emotional Regulation (.14)].
Sexuality: We deal with a smaller data set here as 20% of the couples reported that they were not sexually active. Goldsmith and Byers (2018) revealed that Distance couples need to be more innovative in sexual activity and experience sex less frequently. Sexual activity is present but, based on current findings, does not play as central a role in Emotional Engagement or Relationship Satisfaction as occurs with Proximate couples. One possible explanation is that while sexual activity (for Proximate couples) is associated with greater RS and Emotional Engagement, it is equally true that if the sexual relationship is going badly, it is just as strongly associated with lower RS and poorer Emotional Regulation (Lewandowski & Schrage, 2010; Smith, Lyons et al., 2011). For Distance couples, where sexual activity is less frequent due to distance, the ups and downs of the sexual relationship have less influence on Relationship Satisfaction of the couple. For Proximate couples, where the opportunity of sexual activity is higher, those same ups and downs have a greater impact on Couple RS.
Loneliness and Separation: Distance couples experience much higher loneliness than Proximate couples, but this represents the simple reality of not being together as much as they would like. Loneliness in a Proximate relationship (where daily contact is possible) suggests a relationship that is not satisfying or reveals personal flaws in the individual. The Separation variable measures the couples' sense of too much or too little time together [coded too much time together (1); too much time apart (7)]. Distance couples experience more space than they want—it is part of the dynamic of being distant. The positive correlation of Space with Emotional Regulation for Proximate couples suggests that their Emotional regulation is better if there is more time apart. With too much time together it is easier to get on each other's nerves and respond inappropriately.
Variables where the Dynamic is Similar: There are a number of variables and links between variables in which Proximate and Distance relationship are quite similar. Consult Figure 1 and Figure 2 for specific Beta values. (a) Codependence is an equal-opportunity destroyer with serious negative impact on Couple RS, Emotional Engagement, and Family & Friend support. (b) self-Disclosure is associated with greater Emotional Engagement, Emotional Regulation, and Couples RS. (c) Positive illusions have a limited but positive impact on Emotional Regulation in both models. (d) Emotional Stability is associated with Emotional Regulation and Friend & Family support. (e) Compatibility has a modest (but significant) effect on Emotional Regulation and Couple RS. (f) Shared Activities has a positive impact on Emotional Engagement, Emotional Regulation and Couple RS. And (g) both models have a strong bi-direction link between Emotional Engagement and Emotional Regulation (.30 for Proximate,.25 for Distance).
Length of the relationship: The length of the relationship has an almost equal negative impact for couples in either a Proximate or a Distance relationship. The common-sense explanation is that they may have moved beyond the "in love" phase and are beginning to experience less emotional intensity and have discovered that their partner is not "perfect". As the relationship develops and continues Emotional Regulation becomes increasingly important to deal with the inevitable stresses and irritations.
Emotional Engagement: Many studies show Emotional Engagement to be the greatest single predictor of Relationship Satisfaction-particularly among married couples (e.g., George, Anderson et al., 2023; Johnson, 2004). Emotional Engagement boasts more similarities than differences when comparing Proximate and Distance couples. For both, Emotional Regulation is a major predictor of Couple Relationship Satisfaction. The amount of variance explained by the predictors of Emotional Engagement is also similar, for Proximate; for Distance. The greatest single predictor of Couple RS (rating the Permanence or the relationship) is almost identical, ,.30. But there are differences (Distance value is listed first, then Proximate). Distance relationships show a greater negative impact of Codependence ( , vs. -.06ns) and positive impact of Shared Activities ( , vs..14); Proximate relationships show a greater impact of the support of Family & Friends ( , vs..36).
Differences of Dynamics for Variables that Occur in Both Models: In addition to variables that occur in Proximate relationships but are absent in a Distance relationship, there are substantial differences in patterns of correlations between variables that occur in both models.
Accuracy of perception: Accuracy of perception is a major player in both models. For Proximate couples, Accuracy of perception affects two of the dependent variables: greater Emotional Engagement (-.12) and better Emotional Regulation (-.24). For Distance couples, Accuracy of perception plays a much larger role and impacts all four of the dependent variables: Greater Accuracy is associated with greater Emotional Engagement (-.16), more Family & Friend support (-.16), has a large impact on Emotional Regulation (-.37), and a direct impact on Couple RS (-.06). The total impact of Accuracy in Proximate RS (.36) is substantially less than that of Distance relationships (.75). Literature suggests that the greater discipline involved for Distance couples results in a more satisfying couple relationship. In this case, discipline may translate into greater efforts to view their partner more accurately.
Nurturance: A personal temperament that involves a nurturing relationship with a romantic partner plays a significant part in both models.
For Proximate relationships, higher Nurturance is associated with greater Emotional Regulation (.20) and Family & Friend support (.09). For Distance couples, just like Accuracy of perception, Nurturance impacts all four dependent variables: A nurturing temperament is associated with greater Emotional Engagement (.11), more Emotional Regulation (.24), greater Family & Friend support (.15), and has a direct impact on Couple RS (.08). Once again, the impact of Nurturance is much greater in Distance Relationships (.58) than in Proximate Relationships (.29).
Emotional Regulation: More of the variance in Emotional Regulation is predicted in Proximate relationships ( ) than in Distance relationships ( ). Many factors impact Emotional Regulation in Proximate couples including greater Emotional Engagement (.30), higher Compatibility (.12), more Emotional Stability (.14), more Positive Illusions (.10), a shorter relationship (-.17), too much Space (.14), more Nurturing (.20), less Codependence (-.24), greater Accuracy of perception (-.24), and more self-Disclosure (.14). By contrast, Distance relationships find only five variables impacting Emotional Regulation: a shorter relationship (-.20), greater Accuracy of perception (-.37), more Shared Activities (.07), greater Emotional Engagement (.25), and more Nurturing (.24).
As alluded to earlier, Proximate relationships have more frequent face-to-face interaction that increases the likelihood of conflict or tension. Hence, both the impact of Emotional Regulation (on Couple RS) and the factors that contribute to Emotional Regulation are more prominent. Literature does not help us much here. Beckmeyer and colleagues (2021) and Cionea and colleagues (2019) indicate that not much difference is reported on conflict or serial arguments between Proximate and Distance couples.
Family & Friend support: The support of Family & Friends is more important for Proximate couples. First the link between Family & Friend support with Couple RS is.22 for Proximate Couples and only.12 for Distance couples. The strength of relationship between two predictors are substantially different (Proximate value first), including the impact of Emotional Engagement ( , vs..21) and Accuracy of perception ( vs. -.05ns).
There is literature support for this perspective: Johnson and Hall (2021) reveal that Distance couples have a lower network of peer support and Holmes (2010) speaks of the likelihood of more abstract forms of support. It may be that Proximate couples are more likely to bring their romantic partner to visit their family and have greater ongoing interactions with friends.
T-test Differences, AQP, and Regressions
T-tests: The t-tests that compared Proximate with Distance couples gave the first glimpse of significant differences between the two types of relationships. Other than the axiomatic differences (less face-to-face time, more use of technology to communicate, lonelier, etc.) the t-tests lent support to Delatorre & Wagner's (2019) contention that because Distance couples required greater effort to maintain the relationships, a more positive profile emerges. T-test differences were rarely large (always <.05) but managed 100% indicating that Distance couples were healthier than Proximate couples, including (for both men and women in each setting): greater Relationship Satisfaction, longer relationships, greater Emotional Engagement, better Emotional Regulation, greater strength of Identity, higher Compatibility, greater rating or Permanence of the relationship, more Nurturing, more self-Disclosure and less Codependent.
AQP Acquaintance Potential: The hope that attended inclusion of this variable (derived from three qualitative variables in the questionnaire) was largely disappointed. The pattern of correlations was similar to correlations with length of the relationship across a number of variables. The actual correlates with AQP included greater likelihood of Permanence, lower levels of Codependence, more shared Activities, and greater Family & Friend support. Only the lower Codependence may have been considered interesting. Finally, AQP did not achieve significance in any of the regression equations or in either of the structural models. The non-impact of a new variable may be due to the typical two reasons: (a) poor construction of the variable or (b) simply that there really is no (or little) effect. The authors tilt toward the latter interpretation.
Regressions: The primary regressions, using Couple Satisfaction as the criterion variable (with all variables showing high bivariate correlations with Couple Satisfaction as predictors), were used primarily as a preliminary step in creating the structural models. For regression, we included separate variables for men and women for both Distance and Proximate relationships. Using the Stepwise procedure, significant differences began to emerge between the Proximate regressions and the Distance regressions. As stated earlier, the authors were unable to distinguish systematic trends based on those regressions. A number of other regressions were conducted, using some of the key predictors (Emotional Engagement, Emotional Regulation, Family & Friend Support) as dependent variables along with a series of partial correlations. But all of this was simply the prelude to creating the structural models.
Weaknesses, Strengths, and Summation
Weaknesses: A weakness of the study was that there were so many variables that the authors struggled with its sheer complexity. The coupling of men's and women's values (creating an average for each of the predictors in the structural models) resulted in loss of variation but was required to create a model that was interpretable. Another problem is that when there are so many variables the issue of linear dependency and inter-item collinearity becomes an increasing challenge. The amelioration of that criticism is that the authors were well aware of the challenge when crafting the research and worked to make sure there was a minimum of collinearity between the dependent variable, Relationship Satisfaction, and any of the predictors. Finally, the psychometric distortion of Relationship Satisfaction (for reasons described earlier in the paper) may at times compromise the validity of findings.
Strengths of the study: The authors give themselves high marks on a large diverse sample that allowed valid comparisons between Proximate and Distance relationships. The crisscross procedure allowed for greater objectivity of responses and allowed creation of comparison variables, particularly Accuracy of perception, that helped distinguish between Proximate and Distance couples. Two other variables derived from crisscrossed values (compatibility and enhancement/diminishment) were significant predictors in the final model but not nearly at the level of Accuracy of perception. Finally, the two structural models not only achieved excellent model fits but were instructive of critical differences when comparing Proximate with Distance couples—something not revealed in earlier analyses.
Major takeaways when contrasting Proximate versus Distance Relationships: The broad strokes include: (a) Distance couples boast a healthier overall profile supporting theories that the greater effort required to maintain a Distance relationship results in healthier relationships; (b) Accuracy of perception plays a much larger role for Distance couples than for Proximate; (c) Nurturance follows a similar pattern with a greater impact for Distance couples; (d) Family & Friend Support plays a larger role in Proximate relationships; (e) Emotional Regulation plays a larger role for Proximate couples who (due to proximity) are required to deal more frequently with any couples' stresses and irritations; (f) Sex does not enter into the model as a predictor of Relationship Satisfaction for Distance couples; and (g) Loneliness, highly characteristic of Distance relationships, does not have a negative impact on Relational Success for Distance couples but significantly diminishes Relational Satisfaction for Proximate couples.
Conflict of Interest
The authors declare no conflict of interest.
Ethical Approval
Not applicable
Data Availability
The datasets used in this study are openly available at [repository link] and the source code is available on GitHub at [GitHub link].
Funding
This work did not receive any external funding.
References
Cite this article
Related Research

Special Issue
Launch a focused special issue to highlight research, emerging trends, and expert insights in your academic field.