



IntelliPaper
Abstract
Conventional electrochemical processes with voltages of a few Volts only occur in an electrolyte solution, but with high DC voltage electrode reactions can still occur in non-aqueous electrolyte, even distilled water. Electricity not only converts to heat, which increases the temperature of the water environment, but also performs anodic electrochemical reactions such as dissolving metals or generating oxygen (Me®Men++ne; 2H2O®O2+4H+) and generating hydrogen gas on the cathode (2H2O®H2+2OH). The gaseous environment formed from the electrochemical reactions on the electrodes with high electric, magnetic and suitable temperature conditions will appear plasma on the electrodes – the ionized state of materials. The reactions in the plasma state will generate many strong reactive agents such as electrons, atoms of H, O, O3 as well as free radicals H•, O•, OH•...Simultaneous dispersion into solution of agents formed by eletrochemical processes with DC high-voltage and plasma reactions creates a variety of application possibilities.
Explore Digital Article Text
I. INTRODUCTION
Electrochemical methods have created many possibilities in both research and applications. Conventional electrochemical reactions must use electrolyte solutions and low voltage DC power sources.
Figure 1 shows that the electron-donating oxidation reaction is carried out directly on the metal anode or indirectly to create an oxidizing agent from the reaction on the electrode:
(2)
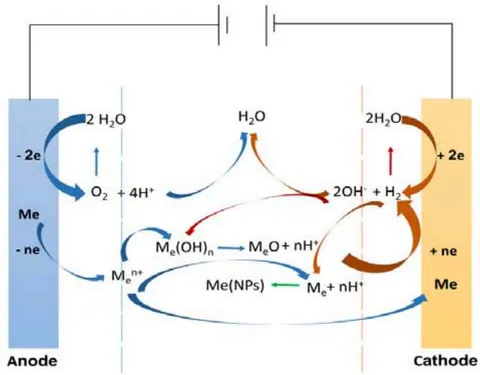
At the same time, on the cathode, the electron-donating electrode performs a direct reduction reaction or creates an indirect reducing agent:
In the electrolyte solution, redox reactions take place:
or neutralization reactions between substances that have been generated from the electrodes:
Silver nanosolutions (AgNPs) were produced from reaction (3) in an electrolyte solution of mol/L AgNO 0.2M/L sodium dedocylsulfonate or precipitated into Al O pore size. Reaction (5) is also applied to prepare AgNPS, CuNPs in DE-25 water solution with voltage up to 30 V or by electrolyte solution with glycerol and polyvinylprolidone (PVP), combined with ultrasound.
When the electrolyte solution with low voltage is not used, the electrochemical reactions as shown in Figure 1 cannot occur. However, when using DC high voltage even in twice distilled water environment, electrochemical processes (1) on the anode electrode and reaction (4) on the cathode still occur. The formation of metal ions with a small concentration will gradually increase the conductivity of the aqueous environment and the gas generated on the electrodes will be the condition for the appearance of plasma state - ionized state of matter. This distinction between low voltage and high voltage electrochemistry will guide distinct research methods and difference applications.
II. ELECTROCHEMICAL PROCESS WITH DC HIGH VOLTAGE
2.1 Differences in Non-Electrolyte and Equipment
Use a non-electrolyte medium such as double distilled water with low conductivity to eliminate the influence of the electrolyte composition in the products of the electrochemical process is different from the conventional electrochemical process. The device model for performing high-voltage electrochemical reaction (Figure 2) has the difference that: High-voltage source (a) to 20 kV with voltage stabilizer or current stabilizer mode is stepless controlled, displaying the following values: value of voltage, current, amount of electricity and reaction time on control box .
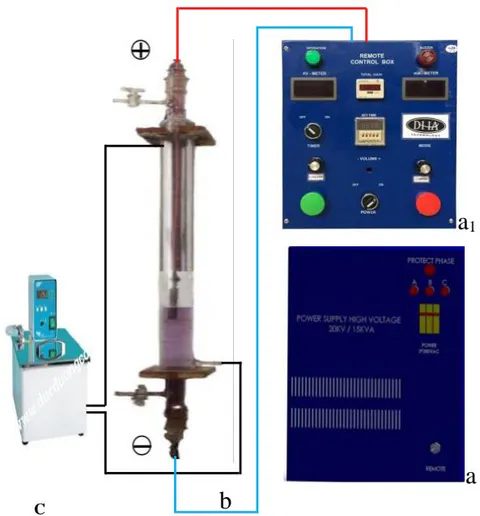
The reaction vessel (b) shall be insulated with water made of plastic but preferably made of heat-resistant glass such as a condenser. The cathode is installed at the bottom of the reactor so that the gas formed is dispersed from the bottom up. The anode is mounted on top; The liquid outlet valve is on the cathode side and the air outake valve is on the anode side. Cooling water with a specified temperature is supplied from the thermostat (c) by circulating pump into the insulation layer from below. Using this device it is possible to control electrochemical reaction processes by: 1) Changing voltage or current; 2) Change the distance between anode and cathode; 3) Change the nature of the environment 4) Change the cooling temperature; 5) Change the area and metallic nature of the electrodes.
2.2. Electric Energy Distribution with Electrochemical Reaction DC High Voltage
The power from the source (a) supplied to the reaction system of the device (b) has been determined (Q) to be balanced with the total heating energy of the entire electrolyte solution as well as the cooling water and perform an electrochemical reaction on the electrodes . The amount of heat lost by evaporation and heating the atmosphere below C is negligible, so it can be ignored, so:
Power supplied from the source is determined:
The electrical energy that heats the solution and the cooling water is determined by Joule-Lenz's law:
So the electricity to carry out the electrochemical reaction will be:
With the device diagram in Figure 2, it is possible to determine the parameters: potential (U, V), current (I, A), quantity of cooling distilled water ( , kg) and distilled water of reaction solution ( , kg) with heat specific capacity (C = 1,163 Wh/kg°C) with temperatures before ( , °C) and after ( , °C) after reaction time (t, h).
Table 1 presents the electricity ratio of DC high voltage supplied at different electrode distances, time and initial temperature.
| , mm | t, min | T, °C | |||||||
| 500 | 750 | 950 | 15 | 50 | 80 | 15 | 20 | 55 | |
| Q | 615 | 785 | 980 | 424 | 718 | 867 | 408 | 349 | 336 |
| % | 13.5 | 23 | 32 | 16 | 24 | 23 | 16 | 16 | 16 |
| 2.3 | 2.9 | 3.3 | 3.8 | 3.3 | 2.7 | 4.0 | 4.5 | 4.7 | |
| % | 595 | 665 | 707 | 335 | 670 | 800 | 335 | 316 | 316 |
| 96.7 | 84.7 | 72.1 | 79.0 | 93.4 | 923 | 82 | 91 | 94 | |
| % | 6.5 | 97 | 241 | 73 | 24 | 43 | 57 | 16 | 4 |
| 1.0 | 12.3 | 24.6 | 17.2 | 3.3 | 5.0 | 14 | 4.5 | 1.3 | |
From the results in Table 1, it can be seen that the percentage of electricity converted into heat is used from 75% to 99%, the remaining to carry out the electrochemical reaction is the highest only 25%. This ratio decreases as the reaction time as well as the initial temperature of the cooling water and reaction solution increases, but increases sharply when the distance between the anode - cathode increases.
2.3 Electrochemical Reactions with DC High Voltage
Figure 3 shows the anode of the electrode when electrochemically reacting with high DC voltage in dissolved twice-distilled water. The amount of metal dissolved after 50 minutes is determined by weighing method ( ):
and calculated by Faraday's law where is the electrochemical equivalent of the metal:
at different anode - cathode ( ) electrode distances are presented in Table 2.
The results of Figure 3 and Table 2 show that with DC high-voltage the anodic dissolution reaction according to equation (1) still occurs in non-conductive double-distilled water.
Table 2. Mass of Ag anode dissolved after DC high voltage reaction after 50 minutes calculated according to Faraday, weight loss of anode and ratio.
(11)
Figure 3: Ag anode is dissolved after DC high voltage reaction
| , mm | 500 | 700 | 950 | |
| , mg | 213 | 211.5 | 195.8 | |
| , mg | 98 | 65 | 58 | |
| % | 46.0 | 30.7 | 29.6 |
However, the amount of dissolved metal weighed is always smaller than the amount calculated according to Faraday, showing that the gas escape process according to equation (2) also occurs at the same time with the rate up to 30% and will increase even more when the electrode distance between the electrodes is increased. anode and cathode decrease. Effect of initial temperature of cooling water as well as reaction medium (T) and DC high voltage electrochemical reaction time (t) on the amount of anodic dissolved metal at : 650 mm determined by The loss of anode weight ( ) and calculated according to Faraday's law ( ) is presented in Table 3.
| T, °C. | 5 | 15 | 25 | 35 | 55 |
| ,mg | 49 | 45 | 68 | 56 | 62 |
| , mg | 107 | 108 | 174 | 215 | 261 |
| % | 45.8 | 41.7 | 39.1 | 26.0 | 23.8 |
| t, ph. | 5 | 15 | 25 | 35 | 50 |
| ,mg | 12 | 15 | 19 | 23 | 68 |
| , mg | 21 | 56 | 103 | 146 | 216 |
| % | 57 | 26.8 | 18.4 | 15.8 | 31.5 |
The results from Table 3 also show that the amount of anodic soluble metal at DC high voltage calculated by Faraday's law is always larger than the amount determined by the anode electrode weight loss with a decreasing trend with increasing initial temperature of the cooling water as well as reaction time. It also proves that the gaseous reaction according to equation (2) accounts for a significant proportion in the anodic processes of DC high voltage electrochemistry.
- occurs according to the reaction of equation (4).
The measured gas volumes as well as those calculated according to Faraday's law are presented in Table 4. This shows that in addition to electrochemical reactions that follow Faraday's law, there are also reactions that do not follow Faraday's law.
Simultaneously with the metal dissolution on the anode, on the cathode, strong gas escape (Figure
 | , mm | 500 | 700 | 850 |
| , mA | 93.4 | 112.6 | 119.3 | |
| , mL | 14.7 | 17.6 | 22.5 | |
| , mL | 63,0 | 110 | 80 | |
| 4.3 | 6.3 | 3.6 | ||
| , phút | 18 | 30 | 35 | |
| , mA | 119.3 | 115.7 | 106.7 | |
| , mL | 22.5 | 36.4 | 39.1 | |
| , mL | 80 | 150 | 250 | |
| 3.6 | 4.1 | 6.4 |
The rate of electrochemical and non-electrochemical reaction with DC is high with changing reaction conditions such as electrode distance, time will also be different, especially the reaction time increases the non-Faraday rate with a marked increase. Because the amount of gas released on the cathode is high and strong, the metal precipitation reaction according to equation (3) does not occur with DC high voltage, so the cathode weight does not change after the reaction. The products from the DC high-voltage electrochemical reaction corresponding to equations (1), (2) and (4) create , and ions dispersed into the aqueous medium, thus increasing the electrical conductivity of the environment (Table 5).
| , mm | 400 | 500 | 600 | 700 | 800 | 900 | 1000 |
| , μScm | 91.3 | 71.2 | 74.7 | 72.8 | 72.1 | 80.8 | 102.8 |
The results from Table 5 show that the conductivity of the medium after the DC high-voltage reaction has increased compared to the average value of 3.14 S/cm of the original distilled water, but it is not large and does not change significantly when change the reaction conditions such as electrode distance, potential and time. It shows that in the solution, there have been oxidation - reduction reactions according to equation (5) or neutralization according to (6), reducing the amount of ions produced from reactions (1), (2), (4) and dispersed in solution.
III. SYNTHESIS OF METAL NANO SOLUTION
3.1. Silver Nano-Solutions and Characteristics
Silver nanoparticles (AgNPs) have good anti-viral effect , so they should be focused on preparing them by various methods such as physical, physicochemical, biology, green chemistry, or chemical reduction. Most methods use and reducing agents such as γ-rays, bacteria, plant extracts or reducing agents. The reaction of with reducing agent to form AgNP occurs according to equation (13) or (14) :
AgNPs solution products prepared from with reducing agents always contain salts of ions and other products, which are difficult to remove, limiting their applicability. Apply DC high voltage electrochemical reaction to generate from anode as equation (3) and reducer from cathode as equation (4) to carry out reaction (5) in solution to form AgNP:
atoms are acted upon by Van der Walls forces to form AgNPs that change the color of the solution:
Thus, summarizing the equations from (15) to (18), we have a general equation for the process of forming AgNPs by DC high-voltage in from solid Ag electrode :
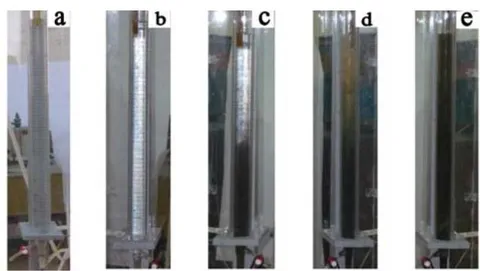
Figure 5 shows the evolution of AgNPs formation voltage at 8 kV in double distilled water at C during electrochemical reaction with DC high with a distance between Ag electrodes of 850 mm.
From Figure 5 it can be seen that: with distilled water initially transparent (a), but after 5 min of reaction with DC high pressure it turned white color of air bubbles dispersed in water (b), after 15 min near the cathode turns brown (c), after 25 min the whole reaction solution has changed color: dark near the cathode electrode and light near the anode electrode (d) and by 50 min after the end of the reaction, the whole reaction has turned dark brown (e).
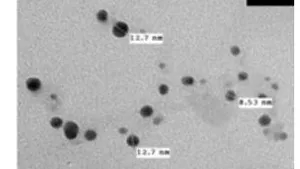
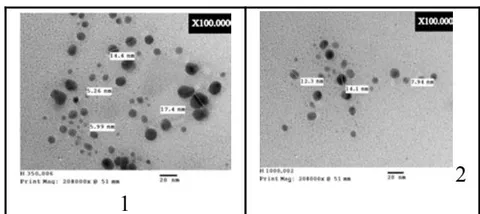
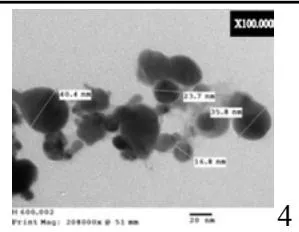
Typical characteristics of AgNPs solutions such as shape and particle size determined by TEM, particle size distribution determined by Laser scattering particle size distribution analyzer Partica LA-950 (Horiba) and deeper by Nicomp 380/DLS (Nicom) are presented in Figure 6 as like as those reported in the literature prepared by different methods.
From TEM images with different high voltage DC reaction conditions: electrode spacing 350 mm (H.6.1) and 1000 mm (H.6.2) as well as after 15 min (H.6.3) and 50 min (H.6.4) the particles of AgNPs are all spherical in shape with sizes from 5.26 nm to 40.4 nm. Under the same reaction conditions with different electrode distances (H.6.1 and H.6.2) the AgNP particle size did not change significantly, but when increasing the reaction time (H.6.3) and (H.6.4), the size of the AgNPs particle size increased from 2 to 3 times.
The particle size distribution determined by the two methods also shows that the AgNPs of the DC high-voltage (H.6.7) are not uniform but in Gaussian form similar to the chemically prepared AgNPs (H.6.8). Figure 6 also shows that the AgNPs solution is a polydisperse system, with at least 2 to 3 particle levels at the reaction electrode distances: 350 mm (H.6.5) as well as at 1000 mm (H.6.6). The method of determining Nicomp 380/DLS with sample of 1000 mm and 50 min (H.6.9) also determined the polydispersity of AgNPs system.
{"image_source":{"path":"images/35d54b208583e2cccc7b7db37795cc260884061d40a5b7c9a0aaee04a89c15e1.jpg"},"content":"","chart_caption":[],"chart_footnote":[]} {"image_source":{"path":"images/cb013713824f549d25b1d39f9118abf553f987ab56467047b1cf6a56f61f2dae.jpg"},"content":"","chart_caption":[{"type":"text","content":"3"}],"chart_footnote":[]}
{"image_source":{"path":"images/cf37cb8849309b4f801e41b70b3f435509f41cc3cd4cbf7d275227187acd40fb.jpg"},"content":"","chart_caption":[{"type":"text","content":"5"}],"chart_footnote":[]} {"image_source":{"path":"images/cd3f25c05500ef7d8e732d50c03eba891d5c6da826561cb12d3e50549250da4f.jpg"},"content":"","chart_caption":[],"chart_footnote":[]}
{"image_source":{"path":"images/c2cdcd96192c2be943e1cb2e6b8dc30f7e4a4d72d809a4c9b3ae1542e5ec59c9.jpg"},"content":"","chart_caption":[],"chart_footnote":[]} {"image_source":{"path":"images/9bc70c63d1cd2b6f1a1b24c7c87fe7dc5fa1e95bd5eaf8483cec510774cc24d1.jpg"},"content":"","chart_caption":[{"type":"text","content":"Figure 6: TEM image and particle size distribution of AgNPs"}],"chart_footnote":[]}
{"image_source":{"path":"images/deb8111c159bf9672ccfc70d16f5105a107624e7d7f09ae57611842ffbc489a8.jpg"},"content":"","chart_caption":[{"type":"text","content":"UV-Vis characteristics of AgNPs (Figure 7) prepared by DC high-voltage at different conditions such as time as well as anode size obtained a spectrum with a peak at about 420 nm like other methods. "},{"type":"equation_inline","content":"^{[26-28]}"},{"type":"text","content":"a: "},{"type":"equation_inline","content":"\varnothing = 3"},{"type":"text","content":" mm"}],"chart_footnote":[]} {"image_source":{"path":"images/cefd9f26ec9546b3258464624bbf46b64bdca565c237ae24c4f35f8bd2c8caf0.jpg"},"content":"","chart_caption":[{"type":"text","content":"b: "},{"type":"equation_inline","content":"\varnothing = 5"},{"type":"text","content":" mm"}],"chart_footnote":[]}
{"image_source":{"path":"images/6765e554b32303b82081330e3c00d6781f41c6dc25156f34fe4433d51f16ebaf.jpg"},"content":"","chart_caption":[{"type":"text","content":"c: "},{"type":"equation_inline","content":"\varnothing = 7"},{"type":"text","content":" mm"},{"type":"text","content":"Figure 7: UV-Vis spectra of AgPNs prepared by DC high voltage with different anode diameters and times"}],"chart_footnote":[]}
The results from Figure 7 also show that the UV-Vis peak height trend increases as the reaction time increases.
The bactericidal properties of AgNPs prepared by high-voltage DC are shown in Figure 8.
The results of Figure 8 show that AgNPs obtained from DC high voltage are also effective against Gram+ and Gram- bacteria, especially with E.Coli, only 0.24 ppm has achieved efficiency 99.9%. Bacterial pathogens for shrimp (H. 8.d ÷ 8.f) were also killed with concentrations ranging from 144.5 ppm to 96.23 ppm.
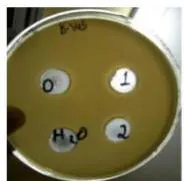
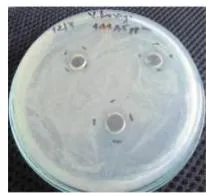
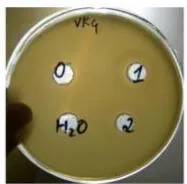
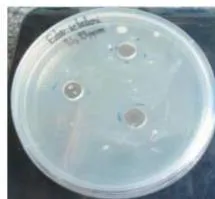
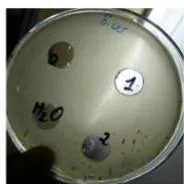
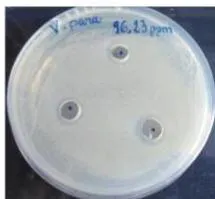
The results of Figure 8 show that AgNPs obtained from high-pressure DC are also effective against Gram-positive and Gram-negative bacteria, especially with E.Coli, only 0.24 ppm has an efficiency of 99, 9%. Bacterial pathogens for shrimp (Figure 8d-8f) were also killed with concentrations ranging from 144.5 ppm to 96.23 ppm.
3.2. Differences in the Characteristics of AgNPs Prepared from DC High Voltage
3.2.1 Conductivity
Table 6 presents a very clear difference between AgNPs solution prepared by high voltage DC electrochemical method as equation (19) and chemical method from according to reaction (14) by reducing agent or with sucrose reducing agent . [35] From Table 6, it can be seen that the conductivity of AgNPs solution prepared by DC high Voltage is not much higher than distilled water and does not change significantly when the concentration increases from 127 ppm to 403 ppm. In contrast, the electrical conductivity of the AgNPs solution chemically prepared from with different reducing agents has a very large value and increases greatly when the concentration of AgNPs increases.
The reason that the conductivity value of AgNPs prepared by DC high-Voltage is small and does not change significantly with different concentrations, which can be explained by the absence of Na+ ions well as the ions of the reduction products in the solution of AgNPs prepared by DC high-Voltage.
| Solution | , μScm | |||
| Dist.water | RO | 10.2 | 10.4 | 10.3 |
| 2 times | 3.1 | 3.4 | 3.2 | |
| DC high Voltage | 127 mg/L | 56.6 | 55.9 | 57.1 |
| 197 mg/L | 71.2 | 70.9 | 71.3 | |
| 403 mg/L | 72.8 | 72.4 | 73.6 | |
| NaBH | 200 mg/L | 1469 | 1465 | 1477 |
| 500 mg/L | 1872 | 1887 | 1880 | |
| 1000 mg/L | 2800 | 2810 | 2820 | |
| C H O | 50 mg/L | 3960 | 3860 | 4110 |
| 100 mg/L | 9510 | 9460 | 9460 | |
It also proves that the AgNPs solution prepared by DC high-Voltage does not have any ions other than the AgNPs colloid, so the purity is very high.
3.2.2 Zeta Potential
Figure 7 presents the zeta potential of AgNPs solution prepared by DC high-Voltage with spacing of 350 mm (a), 650 mm (Figure 7b), 1000 mm (Figure 7c) at 50 min as well as at 650 electrode spacing. mm with time of 5 min (Figure 7d), 15 min (Figure 7e), 50 min (Figure 7b) are different from the zeta potential of chemically prepared AgNPs solution (Figure 7g).
{"image_source":{"path":"images/717ff0343209f2a0820c16df529fbee42a5f8b6c21bb312847f49e2e58ecad07.jpg"},"content":"","chart_caption":[],"chart_footnote":[]} {"image_source":{"path":"images/0137f007341a43d469f6a6b14ee76cba9c3e298fc7c40f6d9f3c687ddf1c14eb.jpg"},"content":"","chart_caption":[],"chart_footnote":[]}
{"image_source":{"path":"images/f11360b67df6bd4a413c0df06ef73e08f4202f9dbafd7092c6231558b7b89d24.jpg"},"content":"","chart_caption":[],"chart_footnote":[]} {"image_source":{"path":"images/3b8510bd99f1d52fdf0fb936f01dd06a2dbaaeafe75c1da351a5b27975356238.jpg"},"content":"","chart_caption":[],"chart_footnote":[]}
{"image_source":{"path":"images/afe7031a304e0bdaf9bd5f02c67c3d2447eaccbb2f1058f2855907ad1efc9b7e.jpg"},"content":"","chart_caption":[],"chart_footnote":[]} {"image_source":{"path":"images/1a4d2da5c8bae80ae62f37f0cff09f716523e3779e1f639431ea96f75ed41421.jpg"},"content":"","chart_caption":[{"type":"text","content":"Figure 7: The zeta potential of the DC high-Voltage-prepared AgNPs solution after 50 min with different distances (a, b, c) and different times (d, e, b) compared with chemical AgNPs"}],"chart_footnote":[]}
The results from Figure 7 show that the difference between the zeta potentials of AgNPs prepared by the DC high-Voltage method has negative values from -26.83 mV to -38.91 mV while the products prepared by chemistry has a positive value of +29.2 mV. The large zeta potential is enough to ensure that the AgNPs colloidal system prepared by DC high-Voltage is stable over time without using chitosan stabilizers as chemical methods. This is also a difference showing the advantage of AgNPs modulated by DC high Voltage.
3.2.3 Concentration Yield of AgNPs
The concentration of AgNPS solution prepared by chemical method is usually determined by the concentration of salt performing the reaction or analyzed by AAS method, which still converts to evenly, assuming that is completely converted to AgNPs. This assumption is not completely reasonable because in the solution of AgNPs, there are still ions in completely unknown proportions. The difference to determine the concentration of AgNPs prepared by DC high-Voltage is that it can be used to determine the loss of the dissolved anode according to Equation (11) or calculated from Faraday's law when determining get the electrochemical reaction current and time according to equation (12). Table 7 presents the concentration of AgNPs prepared by high voltage DC determined by 3 methods: loss of anodic weight ( ), calculation by Faraday's law ( ) and analysis of AAS ( ) when changing the distance. electrode or reaction time while other conditions were kept unchanged.
| , mm | 350 | 550 | 850 | 1000 |
| , mg/L | 129.6 | 213.5 | 217.3 | 198.2 |
| , mg/L | 112 | 82 | 66 | 59 |
| % | 86.42 | 38.1 | 30.4 | 29.8 |
| , mg/L | 34.7 | 30.6 | 13.9 | 11.9 |
| % | 30.97 | 31.2 | 21.1 | 20.2 |
| t, min | 5 | 15 | 25 | 50 |
| , mg/L | 34.3 | 42.9 | 55.4 | 194.3 |
| , mg/L | 61.1 | 162.8 | 294.6 | 616.8 |
| % | 56.2 | 26.7 | 20 | 31.5 |
The results of Table 7 show that the concentration of AgNPs calculated according to Faraday's law has the largest value because the amount of electricity supplied to the anodic process is not only to carry out the reaction (15) to dissolve the anode but also to react (2) to drain oxygen. That makes the AgNPs generation efficiency change when the electrode distance as well as the reaction time change. Table 7 also shows that when increasing the electrode distance as well as the reaction time, the yield of AgNPs tends to decrease, similar to the trend of anodic dissolution in Table 3.

3.2.4 Plasma Contribution During the Formation of AgNPs

Figure 9 shows the process of DC high-Voltage reaction under suitable conditions with the appearance of a plasma state.

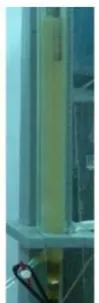
The results from Figure 9 show that the color turns yellow during the generation of AgNPs when there is a contribution of plasma formation which is different from Figure 5 which turns to dark brown color of the generation of AgNPs by DC high-Voltage without plasma.
According to Mizuno a large amount of gas is released on the electrode and does not follow Faraday's law as the results of Table 6 show that the plasma-based water decomposition has occurred on the electrodes:
On the cathode:
Thus, the DC high-Voltage and plasma reactions provided the solution from equations (15) ÷ (18) and (20), (21): , , , , , and AgNPs In the solution then the following reactions can also take place:
(24)
(26)
{"image_source":{"path":"images/522e9a18c84c95dbd2e621265424fee88632c30e68184d889a1262d97b0a7936.jpg"},"content":"","chart_caption":[{"type":"text","content":"(25)"},{"type":"text","content":"Figure 10: X-ray (a), EDX (b) and XPS (c) spectra of AgNPs prepared by DC high-Voltage with plasma."}],"chart_footnote":[]}
Figure 10a shows that the Ronghen spectrum of AgNPs, the characteristic spectra of Ag also have a small amount of spectrum of with respectively: 32,709 for [111], 37,984 for [200], 54,794 for [220], 65,341 for [311] and 68,596 for [222]. EDX analysis results (Figure 10b) showed that the percentage of Ag element accounted for and O element was . This proves that is also formed to cover the AgNPs and is the reason why the fluorescence spectrum of AgNps solution prepared by high pressure DC with plasma (Figure 8) has a different color from that of AgNPs prepared by DC. with plasma (Figure 5). A special feature is that in the XPS spectrum (Figure 10c) of Ag and in AgNPs samples, there is no pick at the binding energy of 368.21 eV, which is typical for the chemical state of ion. This also proves that, in the AgNPs solution obtained without ions, all silver atoms dissolved from the anode are converted into , AgO and Ag. The presence of small amounts of oxide compounds also significantly affects the bactericidal effect of AgNPs.
3.3 Preparation of Bimetallic Nanoparticle Solution
Combining good properties while reducing the amount of precious metals such as Au, Ag, etc. by bimetallic nanoforming is the trend of modern nanotechnology. High-voltage DC method is also used to Preparation of bimetallic nanoparticle (Cu/Ag)NPs solutions. Performing high-voltage DC process with Ag electrode followed by Cu electrode or in solution containing CuNPs will obtain (Cu/Ag)NPs. Figure 11 presents the nanoparticle size (a) and zeta potential (b) distributions of AgNPs, CuNPS and (Cu/Ag)NPs.
{"image_source":{"path":"images/a8debe05ce8a97a89e425d572f470ebc1d89a7288a947d29af90378456f98464.jpg"},"content":"","chart_caption":[{"type":"text","content":"Figure 11: Nanoparticle size distribution (a) and zeta potential (b) characteristics of AgNPs, CuNPS and (Cu/Ag)NPs prepared by DC high-voltage at "},{"type":"equation_inline","content":"U_{DC}"},{"type":"text","content":": 15 kV, "},{"type":"equation_inline","content":"H_{AC}"},{"type":"text","content":": 200 mm and electric quantity Q: 25 mAh"}],"chart_footnote":[]} From the results of Figure 11 it can be seen that the size and size distribution of bimetallic nanoparticles (Cu/Ag)NPs are the same as those of CuNPs and AgNPs, but the average particle size is slightly larger. Similarly, the zeta potential distribution of the bimetallic nanocolloid solution is the same as that of the monometals and all have negative values mV, indicating that the colloidal system is stable without stabilizer.
| Điện cực | a) | b) | |
| , kV | 5 | 5 | |
| , mm | 200 | 200 | |
| , mg/L | 610.458 | 205.275 | |
| 15.906 | |||
| , mg/L | 54.671 | 118.333 | |
| 8.667 | |||
| , mg/L | 45.459 | 65.949 | |
| 0.321 | 3.214 | ||
From the results of Table 8 it can be seen that the rules of high-voltage DC electrochemical processes to prepare bimetallic nanosolutions (Cu/Ag)NPs are the same as those for the preparation of single-metal AgNPs or CuNPs, that is, the concentration obtained Faraday calculation is always greater than from anodic weight loss and minimum concentration calculated from AAS analysis. Table 8 also shows that the concentration of (Cu/Ag)NPs obtained can reach quite large values. The bactericidal ability of the solution (Cu/Ag)NPs with low concentration is also very good and the conductivity, UV-Vis spectra of the bimetallic nanoparticle (Cu/Ag)NPs solution are similar to that of the solution AgNPs. Thus, the application of (Cu/Ag)NPs solution will be effective because it reduces the amount of Ag and the ability to kill bacteria and adds Cu with better fungi and mold killing ability for crops in agriculture.
IV. ELECTROCHEMICAL PLASMA FORMATION
4.1 The Appearance of Plasma on the Electrodes
In section 2.3. showed that the DC high Voltage electrochemical reaction processes also have reactions that do not obey Faraday's law, producing a large amount of gas. The gaseous environment created on the electrodes under conditions of high energy from electric and magnetic fields along with increasing temperature of the solution will appear glowing at the electrodes, which is a sign of a plasma state such as: mentioned in section 3.2.4. Unlike arc-formed plasmas, from microwaves, from capacitance, or gas powered, plasmas are formed from gases by DC electrochemical reactions. The high voltage across the electrodes can be called an electrochemical plasma. The telltale sign of the presence of electrochemical plasma is not only the glow at the electrodes, but also the reaction rate – which increases sharply with time as shown in Figure 12. From the results of Figure 12, it can be seen that the electrochemical plasma appearance time will depend on the electrochemical reaction rate by DC on the electrodes. The greater the speed of the electrochemical reaction, the faster and more abundant the hydrogen and oxygen gas generated, especially when the conductivity is higher and the pH is farther from the neutral medium, the sooner the electrochemical plasma occurs.
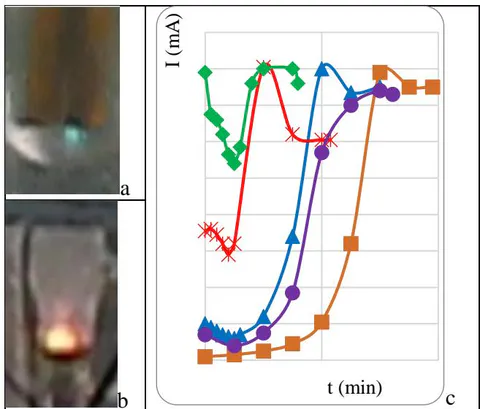
The color of the electrochemical plasma on the different cathode and anode electrodes may be due to the different gaseous nature of the two electrodes according to processes (2) and (4). Of course, technological parameters affect the rate of electrochemical reactions by high voltage DC such as: voltage, electrode spacing, pH and conductivity as well as the initial temperature of the solution as well as the nature of the metal. of the electrode will also affect the electrochemical plasma appearance time (Table 9). The results from Table 9 also show that the faster the electrochemical plasma appears time as the voltage, the higher the initial temperature as well as the increased conductivity or pH of the non-neutral medium. The shorter the distance between the anode and cathode electrodes, the sooner the plasma will appear.
| Reaction conditions | Điện cực | Cu | Fe | W |
| , kV( : 200 mm; : 30 °C;pH:7; : 1,4 μScm ) | 5 | - | - | - |
| 10 | 55 | 40 | 20 | |
| 15 | 30 | 25 | 5 | |
| , mm( : 15 kV; : 30 °C;pH: 7; : 1,4 μScm ;) | 200 | 30 | 20 | 7 |
| 250 | - | 45 | 10 | |
| 300 | - | - | 20 | |
| , μScm ( : 15 kV; : 200 mm; : 30°C) | 4/120 | 3 | 2 | 1 |
| 7/1.4 | - | - | - | |
| 11/150 | 3 | 2 | 1 | |
| , °C( : 15 kV; : 200 mm;pH: 7; : 1,4 μScm ) | 30 | - | 70 | 20 |
| 30 | 30 | 15 | 10 | |
| 40 | 25 | 5 | 3 |
On the electrode W, the time appears electrochemical plasma faster than Cu and Fe electrodes due to more electrochemicals, so it is difficult to dissolve and the air release reaction will prioritize more and faster than the favorable conditions to form the plasma earlier.
4.2 Plasma Reaction to Create Free Radicals
Plasma is formed from the electrochemical process that creates a gas environment with high voltage is a cold plasma state with different levels of ionization. According to Lukes and Ruma plasma formed in a solution in the gas phase surrounding the electrode and liquid phase area in contact with the plasma area in the gas phase. Free radicals: H , O , OH H , H O , O , H , OH ions as well as new molecules and molecules activities: H , O , H O formed in the plasma area from the reaction.
(34)
\mathrm{H}_{2}\mathrm{O}^{+} + \mathrm{H}_{2}\mathrm{O}_{2} \rightarrow \mathrm{H}_{3}\mathrm{O}^{+} + \mathrm{OH}^{ullet}The emission of UV rays when appearing plasma also contributes to the fracture of O-O into OH :[63,64]
The equations (20), (29) show that is formed when the state of electrochemical plasma appears. Although is not durable and easy to participate in the correspondence (31), (36), it is still possible to determine quantitative by UV-Vis method with yellow complex at the wavelength:
Figure 13 shows the standard line determining with UV-Vis UH-5300, Hitachi with nm (A) and the defined concentration on Cu, Fe, W electrodes at the condition of appearing plasma: , U = 15 kV, H = 200 mm, pH = 7 and . [66] {"image_source":{"path":"images/a0139358e0c6043b95286d9f4b888c2cacb6dcac2fd8f4fca0806ccc39510a9b.jpg"},"content":"","chart_caption":[],"chart_footnote":[]}
{"image_source":{"path":"images/6de780eb97c46b15f0b8d2c44712310ad5e49c4e72abddf62f94507f672cf93b.jpg"},"content":"","chart_caption":[{"type":"text","content":"Figure 13: a) Standard line in the area 0.005 mg/L to 0.05 mg/L;
b) The concentration of "},{"type":"equation_inline","content":"H_{2}O_{2}"},{"type":"text","content":" formed on Cu, W, Fe electrodes depends on the time at U: 15 kV; H: 200 mm, T: 30°C with pH 7 and "},{"type":"equation_inline","content":"\chi = 1.4 \mu s cm^{-1}"},{"type":"text","content":"."}],"chart_footnote":[]}
The result from Figure 13 shows that the content was formed on the electrodes that increased rapidly in the first 30 minutes but then slowed down and reached balance with the reactions using . The amount of formed on the electrodes decreased in order W > Fe > Cu corresponding to the 60 -minute gain: 0.054 mg/L > 0.043 mg/L > 0.032 mg/L.
The appearance of OH radical at Equations 27, 36, 38, 41 on Fe electrode can also be determined by UV-Vis spectroscopy with salicylic acid complex (SA):[67-69]
The UV-Vis spectral absorption peaks are 290 nm for SA, 310 nm for 2.3 DHB and 330 nm for 3.5 DHB, respectively, as well as standard curves in the concentration range to respectively is shown in Figure 14 with equations (45), (46) and (47) respectively.
The result of solving the system of equations can be obtained, the concentration value of OH radical formed with electrochemical plasma on the iron electrode after 30 minutes is M and after 60 minutes is M.
{"image_source":{"path":"images/c605aa75bb27477aed55b9bc4cdc4342d0d61363a7363516c7c3428051350ec2.jpg"},"content":"","chart_caption":[{"type":"text","content":"a"}],"chart_footnote":[]} {"image_source":{"path":"images/e40c1de212aeb053ebe8b4c2d3ef2975c73ba9d9ed2e9591f738452cf9ecd423.jpg"},"content":"","chart_caption":[{"type":"text","content":"b"},{"type":"text","content":"Figure 14: Adsorption spectrum and SA calibration curve with "},{"type":"equation_inline","content":"(R^{2}=0.999)"},{"type":"text","content":", 2.3DHB with "},{"type":"equation_inline","content":"(R^{2}=0.997)"},{"type":"text","content":" and 2.5 DHB "},{"type":"equation_inline","content":"(R^{2}=0.994)"},{"type":"text","content":" of complexes with OH radicals"}],"chart_footnote":[]}
4.3. Fenton Catalyst and Photocatalyst to form OH Radicals
The reactions in the plasma state have created many strong reactive agents and free radicals with very short duration such as: OH , O, H O , HO with similar oxidation potential values. response: 2.8 V; 2.42 V; 1.78 V and 1.7 V. In order to increase the formation of OH free radicals in situ to increase the concentration as well as maintain a high activated state, the catalyst systems are commonly used as: H O /UV; Fenton system (H O /Fe ); or optical Fenton (UV/H O /Fe ). When performing DC high Voltage electrochemical reaction on Fe electrode is Fenton catalyst system can be used:
\mathrm{Fe}^{3+} + \mathrm{H}_{2}\mathrm{O}_{2} \rightarrow \mathrm{H}^{+} + \mathrm{Fe}^{2+} + \mathrm{HO}_{2}^{ullet}Thus, the use of Fe electrode to perform a DC high-voltage electrochemical reaction to generate plasma also creates a Fenton catalyst system that always maintains the reactions providing free radicals , and , wich. strong reactive agents can be applied to treat water pollution.
V. TREATMENT OF WATER ENVIRONMENTAL POLLUTION
Water is a very important environment for the life of all things and people. However, human production and living activities discharge into the water environment many dissolved or dispersed substances that pollute the water environment, which have toxic effects on the life of organisms as well as human health. Therefore, treatment of water pollutants is becoming more and more urgent to ensure the safety of life. Often water pollutants are chemicals that can be oxidized, reduced, or coagulated and adsorbed to remove them from the environment.
5.1 Oxidizes Difficult-to-Treat Pollutants
Water pollution from the textile and dyeing industry such as methylene blue or from pesticides and herbicides, including from Agent Orange that the US used during the Vietnam War such as : 2,4-dichlorophenoxyacetic (2,4-D) and : 2,4,5-trichlorophenoxyacetic (2,4,5-T) both contain persistent cyclic compounds that are difficult to handle. The application of current treatment methods such as: burial, adsorption, combustion or the use of advanced oxidizing agents, although achieving certain efficiency, is still limited, such as using a lot of energy or materials and chemicals as well as land. Moreover, the treatment processes are not really thorough, which can still pollute groundwater when burying or create other pollution products for the air from combustion or oxidation reactions. Therefore, the study of highly effective water pollution treatment technologies including plasma technology is being very noticeable. With the electrochemical plasma state, strong reactive agents can be created, including strong oxidizing agents such as , ,... especially with Fenton's catalyst from the iron electrode, -radical insitu can always be formed from the iron electrode stable concentration ensures the waste treatment process in the water environment. Figure 15 shows the treatment efficiency of 2,4-D: 28.98 mg/L and 2,4,5-T: 30.22 mg/L on electrodes W, Cu, Fe (a) at: : 5 kV, ; 300 mm, T: 30°C and , t: 60 minutes and (b) treatment results on Fe electrode with the same reaction conditions as (a) with other concentrations of pollutants together.
{"image_source":{"path":"images/b872bc9f17c262e1a8a67c647c7455505340c5542aa7ac2551f60ae4f76bcf10.jpg"},"content":"","chart_caption":[],"chart_footnote":[]} {"image_source":{"path":"images/8b6479fee57ae7ca2e7ba7cc3832046685dab8c2ee0e401ccde56a35748975da.jpg"},"content":"","chart_caption":[{"type":"text","content":"Figure 15: Effect of electrode material (a) and pollutant concentration on treatment efficiency of 2,4-D and 2,4,5-T on Fe electrode (b)"}],"chart_footnote":[]}
Figure 15(a) shows that the electrochemical plasma treatment efficiency on Fe electrode is much higher than that on Cu and W electrodes. This proves that Fenton catalysis plays a role. With a more complex molecular structure, the treatment efficiency of 2,4,5-T is always lower than that of 2,4-D. Figure 15(b) shows that when increasing the effective pollutant concentration, the effective pollutant concentration will also decrease because the ratio between oxidizing agents such as , in the solution to the substances to be treated in the solution decreases. Effect of high voltage, distance of anode-cathode electrodes, reaction time and ambient temperature on treatment efficiency of 2,4-D and 2,4,5-T by electrochemical plasma on Fe electrode presented in Table 10.
| Parameters change | 2,4-D (28,89 mg/L) | 2,4,5-T (30,22 mg/L) | |
| , kV | 2 | 25.85% | 20.96% |
| 5 | 67.13% | 51.65% | |
| 10 | 93.57% | 88.68% | |
| t, min | 30 | 47.94% | 36.96% |
| 60 | 67.13% | 51.65% | |
| 120 | 86.62% | 71.18% | |
| T, °C | 20 | 43.98% | 32.78% |
| 30 | 67.13% | 51.65% | |
| 50 | 90.18% | 72.52% | |
| 250 | 75.92% | 63.55% | |
| , mm | 350 | 53.22% | 42.74% |
| 500 | 26.83% | 12.81% | |
The results from Table 10 show that the treatment efficiency of 2,4-D and 2,4,5-T both increase with increasing DC high voltage, increasing reaction time as well as increasing ambient temperature, but vice versa, the treatment results will decrease sharply as the distance between the anode and cathode increases. That is related to the appearance and existence time of the electrochemical plasma on the iron electrode. The highest efficiency can be achieved at high voltage of 15 kV, distance of 2 electrodes 300 mm, temperature of 30°C, reaction time of 60 minutes and environmental conductivity of 38.8 Scm respectively 93.57% for 2,4-D and 88.68% for 2,4,5-T.
The results from Table 11 also show that the demand for oxidation of organic compounds (COD) as well as the total amount of carbon in water (TOC) decreased rapidly, indicating that the composition of organic substances decreased with increasing electrochemical plasma treatment time. It also shows that there is mineralization of difficult organic compounds such as 2.4-D and 2,4,5-T by oxidation with radicals such as OH and H O to CO and H O.
| t, phút | mg/L | % | mg/L | % | |
| COD | 0 | 196 | 57.0 | ||
| 30 | 40.2 | 62.1 | 30.2 | 47.0 | |
| 60 | 15.9 | 85.0 | 12.4 | 78.2 | |
| 90 | 6.8 | 93.6 | 8.9 | 84.4 | |
| TOC | 0 | 6.1 | 4.6 | ||
| 30 | 4.7 | 22.9 | 3.7 | 19.5 | |
| 60 | 3.7 | 19.5 | 2.9 | 36.9 | |
| 90 | 2.8 | 54.1 | 2.4 | 47.8 | |
| 120 | 2.1 | 65.6 | 1.8 | 60.8 |
{"image_source":{"path":"images/bea115c9a81fbc5a8ad8c148325d219e64b5dc958d606833103a983179cacd3e.jpg"},"content":"","chart_caption":[{"type":"text","content":"Figure 16: GC-MS spectrum of 2,4-D (a) and 2,4,5-T (b) decomposition products after 120 minutes of electrochemical plasma reaction at: "},{"type":"equation_inline","content":"U_{} = 5 "},{"type":"text","content":", "},{"type":"equation_inline","content":"H_{} = 300 "},{"type":"text","content":", "},{"type":"equation_inline","content":" = 30^{\circ}"},{"type":"text","content":" and "},{"type":"equation_inline","content":"\chi = 38.8 \mu \mathrm{Scm}^{-1}"}],"chart_footnote":[]}
Table 12 presents the intermediate organic compounds of 2,4-D and 2,4,5-T by electrochemical plasma that can be found by GC-MS spectroscopy.
Besides the formation of organic intermediates, the 2,4-D and 2,4,5-T process by electrochemical plasma also performs a dechlorination reaction that produces electrolytes that increase electrical conductivity. Figure 17 presents the conductivity change of the 2,4-D and 2,4,5-T solutions after the electrochemical plasma treatment times.
| No. | Name of compound | , min |
| 1 | Phenol | 6.839 |
| 2 | 4-chlorophenol-TMS este | 10.233 |
| 3 | 1-chlorophenol | 10.387 |
| 4 | 2,3-dichlorophenol | 9.925 |
| 5 | 3,4-dichlorophenol | 13.258 |
| 6 | 2,4-dichlorophenol | 9.844 |
| 7 | 2,4,5-dichlorophenol | 12.498 |
| 8 | 2,4,6-dichlorophenol | 12.580 |
| 9 | 2,3,5-trichlorophenol | 12.432 |
| 10 | Axit formic-TMS este | 2.198 |
| 11 | Axit acetic-TMS este | 2.911 |
| 12 | Axit propanoic-TMS este | 4.051 |
| 13 | Axit propanoic, 2-methylTMS este | 5.328 |
| 14 | Axit pentanoic-TMS este | 6.842 |
| 15 | Axit propanoic, 2-[TMSoxi]-,TMS este | 8.235 |
| 16 | Axit hexanoic-TMS este | 8.355 |
| 17 | Axit pentanoic, 4-oxo-, TMS este | 9.324 |
| 18 | Axit succinic-TMS este | 11.958 |
| 19 | Axit oxalic-TMS este | 12.038 |
18\nAxit succinic-TMS este\n11.958\n19\nAxit oxalic-TMS este\n12.038
| 18 | Axit succinic-TMS este | 11.958 |
| 19 | Axit oxalic-TMS este | 12.038 |
{"image_source":{"path":"images/aa0bd76cca7f02f97dea27d15cec89d66947df7d5047f7d5c8edd781a8ec8d36.jpg"},"content":"","chart_caption":[{"type":"text","content":"Figure 17: Change of conductivity of 2,4-D and 2,4,5-T solutions with time of electrochemical plasma treatment on Fe electrode at "},{"type":"equation_inline","content":"U_{DC}=5"},{"type":"text","content":" kV, "},{"type":"equation_inline","content":"H_{AC}=300"},{"type":"text","content":" mm, "},{"type":"equation_inline","content":"T=30^{\circ}C"}],"chart_footnote":[]} From Figure 17 it can be seen that after 120 min of electrochemical plasma treatment on the Fe electrode, the conductivity of the solution increased from up to with 2,4-5-T and with 2,4-D. Since 2,4,5-T contains more than 2,4-D contains only , the conductivity of the treated solution is always higher.
From the above results, it can be assumed that the oxidation of 2,4-D and 2,4,5-T by OH by electrochemical plasma will form phenol compounds and then open the ring into straight organic acids and continue to be mineralized into CO and H O according to the following diagram:
| 2,4-D | +OH* | Phenolic compounds | +OH* | Straight chain organic acids | +OH* | CO2, H2O |
| 2,4,5T |
Thus, the process of treating difficult-to-treat pollutants with cyclic structures such as 2,4-D and 2,4,5-T by electrochemical plasma with forming OH - radicals is not only highly efficient but also thoroughly mineralized.
Methylene blue dye: - Phenothiazine-5-ium, 3,7-bis(dimethylamino)-, chloride is also easily treated by electrochemical plasma on the Fe electrode. Figure 16 shows the reduction of methylene blue concentration as well as total organic carbon (TOC) over time of the solution when treated with electrochemical plasma on the iron electrode at : 2.5 kV, : 300 mm, pH: 6.06.
{"image_source":{"path":"images/fc36fad3221c5364d7041923fa50ed51cff291a50dcd9eeb1aa63f8e58b0cc8c.jpg"},"content":"","chart_caption":[{"type":"text","content":"Figure 18: Remaining methylene blue concentration (a) and TOC (b) of solution after electrochemical plasma treatment on Fe electrode at "},{"type":"equation_inline","content":"U_{DC}=2.5"},{"type":"text","content":" kV, "},{"type":"equation_inline","content":"H_{AC}=300"},{"type":"text","content":" mm, pH=6.06"}],"chart_footnote":[]} From Figure 18 it can be seen that the electrochemical plasma treatment of methylene blue on the Fe electrode also achieves very high efficiency and complete mineralization.
5.2 Combining Capabilities
In addition to strong oxidation free radicals, electrochemical plasma on Fe electrode also creates reducing agents and flocculation to be used to treat other difficult environmental pollutants.
Ammonium-contaminated water is always concerned by scientists because the existence in the water will turn into and which is also toxic, easily converted to nitrosamines in the body, causing cancer. Therefore, according to QCVN 08-MT, 2015/BTNMT stipulates the limit value of ammonium in water is very low: 0.3 mg/L (level A) and 0.9 mg/L (b). Ammonium treatment methods such as stripping chasing , adsorbing, flocculation, advanced oxidation (AOPS) or biotechnology still limited as complex equipment, use a lot energy and chemicals as well as the effect are not as expected. Therefore, the use of plasma to treat ammonium is also being noticed.
Figure 19 shows that the ammonium concentration decreases quite rapidly with time (a) as well as increases the electrochemical plasma treatment DC voltage (b).
Figure 19a shows that from 800 mg/L concentration to 100 mg/L in 14 minutes of electrochemical plasma treatment at : 1.5 kV, : 350 mm, pH: 6.7. Processing efficiency after 8 minutes has reached 58%.
{"image_source":{"path":"images/2f241cae26fbe6804fac82f955971a3f65e26fcd1a247dc7235bffd3f0f96cf4.jpg"},"content":"","chart_caption":[],"chart_footnote":[]} {"image_source":{"path":"images/78c93513a868ce5916abd5673e3a514acf125fd1307c4df06811aab3d7bb12c4.jpg"},"content":"","chart_caption":[{"type":"text","content":"Figure 19: Ammonium concentration decreased with electrochemical plasma treatment time at "},{"type":"equation_inline","content":"U_{DC}"},{"type":"text","content":": 1.5 kV, "},{"type":"equation_inline","content":"H_{AC}"},{"type":"text","content":": 350 mm, pH: 6.7 (a) as well as with increasing DC voltage and corresponding efficiency also increased (b)"}],"chart_footnote":[]}
Figure 19b shows that at a DC voltage of 0.5 kV, the ability to remove ammonium is still low, but from 1.0 kV onwards, the ammonium concentration has decreased to nearly 100 mg/L after 10 minutes and the treatment efficiency has reached nearly 80% then more than 80% when the voltage is 1.5 kV.
With strong oxidizing agents such as , OH radicals are formed from electrochemical plasma, ammonia pollution can also be oxidized by the following reactions:
\mathrm{NH}_{4}^{+} + 10\mathrm{OH}^{ullet} \rightarrow \mathrm{NO}_{3}^{-} + 7\mathrm{H}_{2}\mathrm{O}Figure 20 shows the variation of , and concentrations over time up to 240 min of electrochemical plasma treatment at : 0.5 kV, : 350 mm, pH: 6.7.
{"image_source":{"path":"images/43db144eb9ae7bcdcde8201eaf06502ebbb9f77d9ad94c7e414516d52fb0f075.jpg"},"content":"","chart_caption":[],"chart_footnote":[]} {"image_source":{"path":"images/685e47a1dd1e47a9162362c6c9a62eada7e659ebc343ee85ff8a8b0507b1893d.jpg"},"content":"","chart_caption":[{"type":"text","content":"Figure 20: Concentrations of "},{"type":"equation_inline","content":"NH_{4}^{+}(a)"},{"type":"text","content":", "},{"type":"equation_inline","content":"NO_{3}^{-}(b)"},{"type":"text","content":" and "},{"type":"equation_inline","content":"NO_{2}^{-}(c)"},{"type":"text","content":" in ammonium wastewater treated with electrochemical plasma at "},{"type":"equation_inline","content":"U_{DC}"},{"type":"text","content":": 0.5 kV, "},{"type":"equation_inline","content":"H_{AC}"},{"type":"text","content":": 350 mm with time up to 240 minutes"}],"chart_footnote":[]}
From Figure 20 it can be seen that when increasing the electrochemical plasma treatment time at : 0.5 kV, the ammonia concentration decreased by more than 400 mg/L in 120 min (Figure 20a) while the concentration increased by nearly 250 mg/L (Figure 20b) and concentration increased by nearly 25 mg/L (Figure 20c). From the minute, the concentration of continued to decrease slightly while the concentration of and both decreased sharply to 150 minutes and then continued to decrease slightly to 240 minutes. The concentration of and increased correspondingly with the decrease of concentration, indicating that the reactions (51) to (54) occurred when ammonia pollution was treated with electrochemical plasma. But after 120 minutes, the concentrations of (Figure 20b) and (Figure 20c) decreased again as the reaction time continued to increase, indicating that reduction occurred with gas formed from electrochemical plasma that can be simulated set according to the following reactions:
Thus, the combination of oxidizing and reducing agents caused by electrochemical plasma to produce ammonia pollution can be treated sparingly so as not to form intermediate products that still pollute the environment.
VI. CONCLUSION
The process of electrodes with high DC voltage to create electrochemical plasma on the electrodes will form many oxidizing and reducing substances in gaseous state, ions or radicals such as , , , , etc in the aquatic environment for the production of metal nanomaterials or for the treatment of chemical substances that pollute the environment.
Characteristics as well as efficiency of manufatoring of metal nanoparticles as well as water pollution treatment can be controlled by high -voltage electrochemical reaction technology parameters such as: voltage, distance between the anode and cathode, the environmental temperature and the conductivity of the solution.
AgNPs or Cu/AgNPs solution is prepared by high pressure DC and electrochemical plasma with appropriate technological conditions will obtain a particle size, concentration as well as stability and ability to kill bacteria compare with other methods. The outstanding advantage is that the product is obtained without agents for reducing and stabilizers, so high purity promises to apply for medicine.
Strong oxidizing agents such as , OH radicals as well as Fenton catalysts supporting the generation of insitu radicals have been used to treat environmental pollutants such as 2,4-D as well as 2,5,5-T and methylene blue dye. Although these polluting chemicals have aromatic rings that are difficult to handle, by high voltage DC with electrochemical plasma they are all treated with a fairly thorough mineralization process to and . The advantage of electrochemical plasma pollution treatment is that it does not use materials, chemicals and does not create polluting intermediate products, so it is considered an environmentally friendly method. Combining oxidizing and reducing agents and large amounts of gas from plasma water decomposition to treat ammonium contaminated water and intermediate products and also achieves high and thorough efficiency up to . The advantage of the method is that it also does not use chemical materials as well as large areas, but the processing time is quite fast.
Conflict of interest: The authors declare that they have no competing interests.
ACKNOWLEDGMENTS
We acknowledge the support of the fund NAFOSTED and VAST for facilitating with the study as well as the PhD students and master students who have conducted research in this direction.
Allen J. Bard, Larry R. Faulkner, Electrochemical Methods: Fundamentals and Applications, New York: Wiley, 2001, 2nd ed.
AP O'Mullane, Electrochemistry, Elsevier Inc.
Rashid A. Khaydarov, Renat R. Khaydarov, Olga Gapurova, Yuri Estrin, Thomas Scheper, Electrochemical method for the synthesis of silver nanoparticles, J. Nanopart. Res., 2009, 11, 1193–1200.
Liang C. L., Zhong K., Liu M., Jiang L., Liu S. K., Xing D. D., Li H. Y., Na Y., Zhao W. X., Tong Y. X., Liu P., Synthesis of morphology-controlled silver nanostructures by electrodeposition Nano-Micro Letters, 2010, 2(1), 6-10.
Nguyen Cong Phuc, Nguyen Duc Hung, Bactericidal activity of nano silver and nanocomposite using electrochemical deposition, Vietnam J. Chem., 2010, 41(4), 409-413.
Doan Thi Kim Bong, Nguyen Nhi Tru, Preparation of silver nano-solutions by electrolysis combined with ultrasound, Vietnam J. Chem., 2012, 50(5A), 343-346.
San P.T., Khoa T.A., Hoang N., Electrochemical Method for Synthesis of Silver Nanoparticles, Vietnam Journal of Science and Technology, 2010, 48(5A), 150-154.
Vo Huu Thinh, Nguyen Nhi Tru, Preparation of copper nanoparticle solution by electrochemical technique, Vietnam Journal of Science and Technology, 2013, 51(5B), 21-26
Truong Anh Khoa, Phạm Trung San, Nguyen Hoang, Le Lan Anh, Research on the preparation of nano silver applied in medicine by electrochemical method, Journal of analytical Sciences, 2012, 17, 35-40.
Nguyen Duc Hung, Mai Van Phuoc, Nguyen Minh Thuy, Conductivity of silver nanoparticle solution, Journal of Military Science and Technology Research, 2012, 17(2), 96-101.
Nguyen Duc Hung, Electrochemical reaction at high voltage with electrode plasma, Vietnam J. Chem., 2012, 50(DB), 103-111
Vietnam standard, Water for analytical laboratory use - Specification and test methods, TCVN 4854-1989 (ISO 3696:1987).
Nguyen Duc Hung, Method for preparation of metallic silver nanosolutions and equipment for implementing this method, Patent, No. 12229, 2013, December 31.
Tadahiko Mizuno, Tadayoshi Ohakimoto, Akito Takahashi, Production of Heat during Plasma Electrolysis in Liquid, The Japan Society of Applied Physis, Part 1, 2000, 10.
Mai Van Phuoc, Nguyen Minh Thuy, Nguyen Duc Hùng, Energy balance in the process of creating silver nanoparticles using high-voltage electrochemical nanotechnology, Vietnam J. Chem., 2014, 52(6B), 183-186.
S. -K. Sengupta, R. Singh, A. -K. Srivastava, A Study on the Origin of Nonfaradaic Behavior of anodic Contact Glow Discharge Electrolysis, J. Electrochem. Soc., 1998, 145(7), 2209-2213.
Li Xu, Yi-Yi Wang, Jie Huang, Chun-Yuan Chen, Zhen-Xing Wang, Hui Xie, Silver nanoparticles: Synthesis, medical applications and biosafety, Theranostics, 2020, 10(20), 8996-9031.
Kholoud M.M Abo El-Nour, Ala'a Eftaiha, Abdulrhman Al-Wrthar Reda A.A. Ammar, Synthesis and applications of silver nanoparticles, Arabian Journal of Chemistry, 2010, 3, 135-140.
Nasretdinova, Gulnaz R., Fazleeva, Rezeda R., Mukhitova, Rezeda K., Nizameev, Irek R., Kadirov, Marsil K., Ziganshina, Albina Y., Yanilkin, Vitaliy V., Electrochemical synthesis of silver nanoparticles in solution, Electrochemistry Communications, 2015, 50, pp. 69–72.
T. Sowmyya, G. Vijayalakshmi, Green synthesis and characterization of silver nanoparticles using Soymida febrifuga aqueous leaf extract, World J. Pharm. Sci., 2016, 5(1), 786-805.
Sukdeb Pal, Yu Kyung Tak, Joon Myong Song, Does the Antibacterial Activity of Silver Nanoparticles Depend on the Shape of the Nanoparticle? A Study of the Gram-Negative Bacterium Escherichia coli, Applied and Environmental Microbiology, 2007, 73(6), 1712-1720
Hayelom Dargo Beyene, Adhena Ayaliew Werkneh, Hailemariam Kassa Bezabh, Tekilt Gebregergs Ambaye, Synthesis paradigm and applications of silver nanoparticles (AgNPs), a review, Sustainable Materials and Technologies, 2017, 13, 18–23.
Xuan Hoa Vu, Thi Thanh Tra Duong, Thi Thu Ha Pham, Dinh Kha Trinh, Xuan Huong Nguyen, Van-Son Dang, Synthesis and study of silver nanoparticles for antibacterial activity against Escherichia coli and Staphylococcus aureus, Adv. Nat. Sci.: Nanosci. Nanotechnol. 2018, 9, 025019 (7pp).
Atiqah Salleh, Ruth Naomi, Nike Dewi Utami, Abdul Wahab Mohammad, Ebrahim Mahmoudi, Norlaila Mustafa, Mh Busra Fauzi, The Potential of Silver Nanoparticles for Antiviral and Antibacterial Applications: A Mechanism of Action, Nanomaterials 2020, 10, 1566 (20 pp).
Rama Koyyati, Vee babu Nagati, Rau Nalvothula, Ramchander Merugu, Karunakar Rao Kudle, Paul Max, Pratap Rudra Manthur Padigya, Antibacterial activity of silver nanoparticles synthesized using Amaranthus viridis twig extract, Int.J. Res. Pharm. Sci., 2014, 5(1), 32-39.
S Elumalai, R Devika, Biosynthesis of silver nanoparticles using curcuma longa and their antibacterial activity, Int. J. Pharm. Res. Sci., 2014, 02(1), 98-103.
Ratyakshi, R.P. Chauhan, Colloidal Synthesis of Silver Nano Particles, Asian Journal of Chemistry, 2009, 21(10), 113-116.
Guangyu Zhang, Yan Liu, Xiaoliang Gao, Yuyue Chen, Synthesis of silver nanoparticles and antibacterial property of silk fabrics treated by silver nanoparticles, Nanoscale Research Letters, 2014, 9, 216-224.
Amany A. El-Kheshen, Sanaa F. Gad El-Rab, Effect of reducing and protecting agents on size of silver nanoparticles and their anti-bacterial activity, Der Pharma Chemica, 2012, 4(1), 53-65.
Zong-ming Xiu, Qing-bo Zhang, Hema L. Puppala, Vicki L. Colvin, Pedro J. J. Alvarez, Negligible Particle-Specific Antibacterial Activity of Silver Nanoparticles, Nano Lett. 2012, 12, 4271-4275.
Ratan Das, Sneha Gang, Siddhartha Sankar Nath, Preparation and Antibacterial Activity of Silver Nanoparticles, Journal of Biomaterials and Nanobiotechnology, 2011, 2, 472-475.
Nguyen Minh Thuy, Research on electrochemical dissolution reaction at the anode (anode) to create silver nano solution by high voltage, Military Academy of Science and Technology, Thesis of Ph. D, 2014.
Nguyen Minh Thuy, Nguyen Duc Hung, Nguyen Thi Ngoc Tinh, Nguyen Nhi Tru, Silver nano solution prepared by high-voltage electrochemical method: bactericidal ability and application in medicine and pharmacy. Vietnam J. Chem., 2012, 50(5A), 134-138.
N.Q. Buu, T.T.N. Dung, N.H. Chau, D.T. Hieu, Studies on manufacturing of topical wound dressings based on nanosilver produced by aqueous molecular solution method, J. Exp. Nanoscience, 2011, 6(4), 409-421.
Nguyen Thi Huong, Nguyen Viet Hung, Preparation of silver nano colloidal solution with sucrose reducing agent, Journal of Military Science and Technology, 2011, 10(15), 86-91.
Tadahiko Mizuno, Tadasi Akimoto, Kazuhisa Azumi, Tadayoshi Ohmori, Yoshiaki Aoki, AkitoTakahasi, Hydrogen Evolution by Plasma Electrolysis in Aqueous Solution, Japanese Journal of Applied Physics, 2005, 44(1A), 396-401.
Wenjing Zhang, Aijuan Zhang, Ying Guan, Yongjun Zhang, X.
X. Zhu, Silver-loading in uncrosslinked hydrogen-bonded LBL films: structure change and improved stability, J. Mater. Chem., 2011, 21, 548–555.
Carla Gasbarri, Maurizio Ronci, Antonio Aceto, Roshan Vasani, Gianluca Iezzi, Tullio Florio, Federica Barbieri, Guido Angelini, Luca Scotti, Structure and Properties of Electrochemically Synthesized Silver Nanoparticles in Aqueous Solution by High-Resolution Techniques, Molecules, 2021, 26, 5155.
X. Wang, H.F. Wu, Q. Kuang, R.B. Huang, Z.X. Xie, L.S. Zheng, Shape-dependent antibacterial activities of polyhedral particles, Langmuir, 2010, 26(4), 2774-2778.
S. Link, Z. L. Wang, M. A. El-Sayed, Alloy formation of gold-silver nanoparticles and the dependence of the plasmon absorption on their composition, J. Phys. Chem. B, 1999, 103(18), 3529-3533.
Z. Kiani, Y. Abdi, E. Arzi, Low temperature formation of silver and silver-copper alloy nanoparticles using plasma enhanced hydrogenation and their optical properties, World Journal of Nano Science and Engineering, 2012, 2, 142-147.
Nguyen Duc Hung, Tran Van Cong, Hoang Nhu Trang, Synthesis of bimetallic Cu-Ag nanoparticles prepared by DC high voltage electrochemical method, Vietnam J. Chem., 2019, 57(5), 609-614.
Tien D.C., Liao C. Y., Huang J. C., Tseng K. H., Lung J. K., Tsung T. T., Kao W. S., Tsai T. H., Cheng T. W., Yu B. S., Lin H. M., Stobinski L., Novel technique for preparing a nano-silver water suspension by the arc-discharge method, Rev. Adv. Marter. Sci., 2008, 18, 750-756.
Kroesen G.M.W., Schram D.C., De Haas J.C.M., Description of cascade arc plasma, Plasma Chemistry and Plasma Processing, 1990, 10(4), 531–551
B. Jiang, J.T. Zheng, S. Qiu, M.B. Wu, Q.H. Zhang, Z.F. Yan, Q.Z. Xue, Novel technique for preparing a nano-silver water suspension by the arc-discharge method, Rev. Adv. Marter. Sci., 2008, 18, 750-756.
Fang-Chia Chang, Carolyn Richmonds, R. Mohan Sankarana, Microplasma-assisted growth of colloidal Ag nanoparticles for point-of-use surface-enhanced Raman scattering applications, J.Vac.Sci.Technol.A, 2010, 28(4), 5-8
Park J., Henins I., Herrmann H.W., Selwyn G.S., Hicks R.F., Discharge phenomena of an atmospheric pressure radio frequency capacitive plasma source, Journal of Applied Physics, 2001, 89, 20.
Hopwood J., Review of inductively coupled plasmas for plasma processing, Plasma Sources Science and Technology, 1992, 1(2), 109–116.
Ruma Hosano H., Sakugawa T., Akijama H., The Role of pulse voltage amplitude on
Seong Cheol Kim, Sung Min Kim, Jung Wan Kim, Sang Yul Lee, Synthesis nanoparticles using solution plasma process and their various applications, The . International Workshop on Nanotechnology and Application, Vung Tau, 2013, 71-74.
Leroux F., Perwuelz A., Campagne C., Behary N., Atmospheric air-plasma treatments of polyester textile structures, Journal of Adhesion Science and Technology, 2006, 20(9), 939.
Sugiarto A.T., Ohshima T., Sato M.. Advanced oxidation processes using pulsed streamer corona discharge in water, Thin Solid Films, 2002, 407, 174-178.
Sunka P., Babicky V., Clupek M., Lukes P., Simek M., Schmidt J., Cernak M, Generation of chemically active species by electrical discharges in water, Plasma Sources Sci. Technol, 1999, 8, 258-265.
Lukes P., Locke B.R., Brisset J.L., Aqueous-phase chemistry of electrical discharge plasma in water and in gas-liquid environments, 2012, WileyVCH Verlag GmbH & Co. KgaA, pp. 243-308.
Joshi A.A., Locke B.R., Arce P., Finney W.C., Formation of hydroxyl radicals, hydrogen peroxyde and aqueous electrons by pulsed streamer corona discharge in aqueous solution, Journal of Hazardous Materials, 1995, 41, 3-30.
Sahni M., Locke B.R., Quantification of hydroxyl radicals produced in aqueous phase pulsed electrical discharge reactors, Ind. Eng., Chem. Res, 2006, 45, 5819-5825.
T. Mizuno, T. Akimoto, K. Azumi, T. Ohmori, Y. Aoki, A. Takahashi, Hydrogen Evolution by plasma electrolysis in aqueous solution, Japanese Journal of Applied Physics, 2005, 44(1A), 396-401.
Kirkpatrick M.J., Locke B.R., Effects of platinum electrode on hydrogen, oxygen, and hydrogen peroxide formation in aqueous phase pulsed corona electrical discharge, Ind. Eng. Chem. Res, 2006, 45, 2138-2142.
Porter D., Poplin M.D., Holzer F., Finney W.C., Locke B.R., Formation of hydrogen peroxide, hydrogen, and oxygen in gliding arc electrical discharge reactors with water spray, Transactions on industry applications, 2009, 45, 623-629
Wang L., 4-Chlorophenol Degradation and Hydrogen Peroxyde Formation Induced by DC Diaphragm Glow Discharge in an Aqueous Solution, Plasma Chem Plasma Process, 2009, 29, 241-250.
Stara Z., Krcma F., The study of generation by DC diaphragm discharge in liquids, Czechoslovak Journal of Physics, 2004, 54, 1050-1055.
Sayed M., Efficient removal of phenol from aqueous solution by the pulsed high-voltage discharge process in the presence of , Chemistry International, 2015, 1(2), 81-86.
Peralta E., Roa G., Servin J.H., Romero R., Balderas P., Hydroxyl Radicals quantification by UV spectrophotometry, Electrochimica Acta, 2014, http://dx.doi.org/10.1016/j.electacta.2014.02.047.
Anpilov A.M., Barkhudarov E.M., Bark Y.B., Zadiraka Y.V., Christofi M., Kozlov Y.N., Kossyi I.A., Kop'ev V.A., Silakov V.P, Taktakishvili M.I., Temchin S.M., Electric discharge in water as a source of UV radiation, ozon and hydrogen peroxyde, Journal of Physic. D: Applied Physic, 2001, 34, 993-999.
Tran Van Cong, Reseaching high voltage electrochemical engineering of applied electrodic plasma generation for decomposition of 2,4-dichlorophenoxyacetic acid and 2,4,5-trichlorophenoxyacetic acid in water environment, Thesis of Ph.D., Academy of Military Science and Technology, 2022.
Ronald S. Lankone, Alyssa R. Deline, Michael Barclay, D. Howad Fairbrother, UV-Vis quantification of hydroxyl radical concentration and dose using principal component analysis, Talanta, 2020, 218, 121148.
E. Peralta, G. Roa, J.A. Hernandez-Servin, R. Romero, P. Balderas, R. Natividad, Hydroxy Radicals quantification by UV spectrophotometry, Electrochimica Acta, 2014, 129, 137-141.
Chongchong Wu, Alex De Vischer, Ian Donald Gates, Reactions of hydroxyl radicals with benzoic acid and benzoate, ASC Advances., 2017, 7, 35776-35785.
Haiqian Zhao, Jihui Gao, Wei Zhou, Zhonghua Wang, Shaohua Wu, Quantitative detection of hydroxyl radicals in Fenton system by UV-Vis spectrophotometry, Analytical Methods, 2015.
Manfred Saran, Karl H. Summer, Assaying for Radicals: Hydroxylated Teraphthalate is a Superior Fluorescence Marker than Hydroxylated Benzoate, Free Rad. Res., 1999, 31, 429-436.
Arthur L. Sagone, Mary Ann Decker, Rose Marie Wells, Charles Democko, A new method for the detection of hydroxyl radiacal production by phagocytic cells, Biochimica et Biophysica Acts, 1980, 628, 90-97.
Lukes P., Water treatment by pulsed streamer corona discharge, Ph.D.Thesis, 2001, Institute of plasma physics academy of sciences of the Czech Republic.
Lukes P., Clupek M., Babicky V., Sisrova I., Janda V., The catalytic role of tungsten electrode material in the plasmachemical activity of a pulsed corona discharge in water, Plasma Sources Science and Technol, 2011, 20, 1-11.
Ruzhong Chen and Joseph J. Pignatello, Role of Quinone Intermediates as Electron Shuttles in Fenton and Photoassisted Fenton Oxidations of Aromatic Compounds, Environ. Sci. Technol. 1997, 31, 2399-2406.
F. Abdelmalek, R.A. Tores, E. Combet, C. Petrier, C. Pulgarin, A. Addou, Gliding Arc Discharge (GAD) assisted catalytic degradation of bisphenol a in solution with ferrous ions, Separation and Purification Technology, 2008, 63, 30-37.
Xiaolong Hao, Minghua Zhou, Qing Xin, Lecheng Lei, Pulsed discharge plasma induced Fenton-like reaction for the enhancement of degradation of 4-chlorophenol in water, Chemosphere, 2007, 66, 2185-2192.
Shunsuke Tomizawa, Meguru Tezuka, Kinetics and Mechanism of Organic Degradation in Aqueous Solution Irradiated with Gaseous Plasma, Plasma Chem. Plasma Process, 2007, 27, 486-495.
Jong K.I., Huyn S.S., Kyung D.Z., Perchlorate removal in systems: Impact of oxygen availability and UV radiation, Journal of Hazardous Materials, 2011, 192, 457-464.
Xia Q., Jiang Z., Wang J., Yao Z., A facile preparation of hierarchical dendritic zero valent iron for Fenton-like degradation of phenol, Catalysis Communications, 2017, 100, 57-61.
Basil Amaka-Anolue, Agu Augustine, Agbo Christain, Water use efficiency and conservation in green building, Journal of Environmental Management and Safety, 2022, 13, 1, 67-78.
Li Lin, Haoran Yang, Xiaocang Xu, Effects of Water Pollution on Human Health and Disease Heterogeneity: A Review, Water and Wastewater Management, 2022, 10, 1-20.
Arvaniti OS, Stasinakis AS, Review on the occurrence, fate and removal of perfluorinated compounds during wastewater treatment. The Science of the Total Environment, 2015, 524–525: 81–92.
A. Saravanan, P. Senthil Kumar, S.Jeevanantham, S.Karishma, b. Tajsabreen, P.R. Yaashikaa, B. Reshma, Effective water/wastewater treatment methodologies for toxic pollutants removal: Processes and applications towards sustainable development, Chemosphere, 2021, 280, 130595.
Reddy P.M.K., Raju B.R., Karuppiah J., Reddy E.L., Subrahmanyam. C., Degradation and mineralization of methylene blue by dielectric barrier discharge non-thermal plasma reactor, Chemical Engineering Journal, 2013, 217, 41-47
Lu Q., Yu J., Gao J., Degradation of 2,4-dichlorophenol by using glow discharge electrolysis, J. of Hazardous Materials, 2006, B1,36, 526-531.
Reddy, P.M.K., Subrahmanyam, C., Green approach for wastewater treatment degradation and mineralization of aqueous organic pollutants by discharge plasma, Ind. Eng. Chem. Res, 2012, 51, 11097-11103.
Pasinszki, T., Krebsz, M., Synthesis and Application of Zero Valent Iron Nanoparticles in Water Treatment, Environmental
- Remediation, Catalysis, and Their Biological Effects, Nanomaterials, 2020, 10, 917.
Li H.O.L., Kang J., Urashima K., Saito N., Comparison between the mechanism of liquid plasma discharge process in water and organic solution, Journal of Institute Electrostat Janpan, 2013, 37, 22-27.
Jiang B., Zheng J., Liu Q., Wu M., Degradation of azo dye using non-thermal plasma advanced oxidation process in a circulatory airtight reactor system, Chemical Engineering Journal, 2012, 204-206, 32-39.
Peyton, G.R., Glaze, W.H., Destruction of pollutants in water with ozone in combination with ultraviolet radiation.
Photolysis of aqueous ozone, Environ. Sci. Technol, 1998, 22, 761-767.
Jiang, B., Zheng, J., Qiu, S., Wu, M., Zhang, Q., Yan, Z., Xue, Q., Review on electrical discharge plasma technology for wastewater remediation, Chemical Engineering Journal, 2014, 236, 348-368.
Locke B.R., Thagard S.M., Analysis and review of chemical reactions and transport processes in pulsed electrical discharge plasma formed directly in liquid water, Plasma Chem Plasma Process, 2012, 32, 875-917.
Tran Van Cong, Nguyen Duc Hung, Ngoc Dung Tran Thi, Nguyen Van Hoang, Surya Veerendra Vattikuti, Nam Nguyen Dang, Electrochemical plasma for treating 2,4,5 trichlorophenoxyacetic acid in water environment using iron electrodes, ÁCS Omega, 2021, 6, 26329-26337.
QCVN 08-MT:2015/BTNMT, National technical regulation on surface water quality, Ministry of Natural Resources and Environment of Vietnam, 2015.
Lennevey Kinidi, Ivy Ai Wei Tan, Noraziah Binti Abdul Wahab, Khairul Fikri Bin Tamrin, Cirilo Nolasco Hipolito, Shanti Faridah Salleh, Review Article: Recent Development in Ammonia Stripping Process for Industrial Wastewater Treatment, International Journal of Chemical Engineering, 2018, Vol. 2018 | Article ID 3181087 | https://doi.org/10.1155/2018/3181087.
A. Bonmati, X. Flotats, Air stripping of ammonia from pig slurry: characterisation and feasibility as pre- or posttreatment to mesophilic anaerobic digestion, Waste Management, 2003, 23(3), 261–272.
Jianyin Huang, Nadeeka Rathnayke Kankanamge, Christopher Chow, David T. Welsh, Tianling Li, Peter R. Teasdale, Removing ammonium from water and wastewater using cost-effective adsorbents: A review, Journal of environmental sciences, 2017, doi.org/10.1016/j.jes2017.09.009.
X. Z. Li., Q. L. Zhao., X. D. Hao, Ammonium removal from landfill leachate by chemical precipitation, Waste Management, China, 1999, 19(6), 409–415.
Conflict of Interest
The authors declare no conflict of interest.
Ethical Approval
Not applicable
Data Availability
The datasets used in this study are openly available at [repository link] and the source code is available on GitHub at [GitHub link].
Funding
This work did not receive any external funding.
References
Cite this article
Related Research

Special Issue
Launch a focused special issue to highlight research, emerging trends, and expert insights in your academic field.