




IntelliPaper
Abstract
This paper presents the architectural foundation and implementation results of Self-Service Analytics 2.0, an AI-powered system that automatically generates business dashboards from raw data while incorporating continuous human feedback loops. Our architecture integrates automated schema detection, intelligent KPI discovery, and adaptive visualization generation through a multi-layered feedback mechanism that learns from user interactions. The system demonstrates a 47% reduction in dashboard creation time and achieves 78% user satisfaction scores through iterative refinement. We detail the comprehensive architecture including feedback collection pipelines, model adaptation mechanisms, and human-in-the-loop quality assurance workflows that ensure generated insights remain aligned with business objectives.
Explore Digital Article Text
I. INTRODUCTION
Traditional business intelligence platforms require extensive manual configuration and domain expertise, creating bottlenecks in data-driven decision making. Conventional BI tools demand significant time investment to create meaningful dashboards, often requiring 8.5 hours of analyst effort per dashboard [1]. This creates a fundamental disconnect between data availability and business insight generation.
Self-Service Analytics 2.0 addresses this gap through a comprehensive architecture that combines automated insight generation with systematic human feedback integration. Our approach recognizes that effective business intelligence requires continuous learning from user interactions, business context updates, and evolving organizational priorities.
The key architectural contributions include: (1) a multi-stage feedback collection system that captures explicit and implicit user preferences, (2) an adaptive learning pipeline that refines algorithms based on usage patterns and corrections, and (3) a human-in-the-loop quality assurance framework that ensures generated insights meet business standards.
II. SYSTEM ARCHITECTURE
2.1 Overall Architecture Design
The system employs a microservices architecture with six core components interconnected through event-driven communication patterns as shown in Fig. 1. The architecture consists of:
-
Data Ingestion Layer: Handles heterogeneous data sources with real-time and batch processing capabilities
-
Schema Intelligence Engine: Performs automated schema detection with confidence scoring and human validation workflows
-
KPI Discovery Service: Identifies potential metrics through pattern analysis while incorporating domainspecific business rules
-
Visualization Generation Engine: Creates dashboard layouts with optimization algorithms guided by user feedback history
-
Feedback Collection Framework: Multi-channel system capturing user interactions, explicit ratings, and behavioral analytics
-
Adaptive Learning Pipeline: Continuous model refinement based on accumulated feedback and performance metrics
Fig. 1: High-Level System Architecture of SelfService Analytics 2.0
2.2 Data Ingestion Architecture
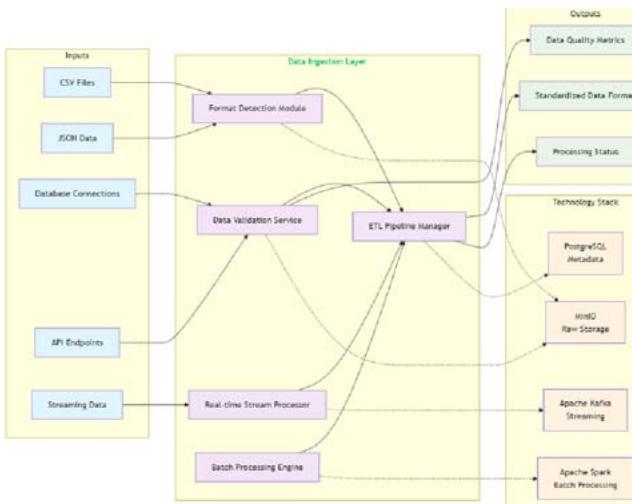
The data ingestion layer implements a staged processing pipeline as illustrated in
Fig. 2: Raw Data → Format Detection → Schema Inference → Validation → Enrichment.
The Format Detection Module employs signaturebased detection for structured formats (CSV, JSON, XML) and content analysis for semi-structured data. Processing capability has been tested up to 10 GB file sizes with 15-second average detection time.
The Schema Inference Engine utilizes statistical analysis combined with pre-trained NLP models for semantic type detection. The system maintains confidence scores for each inference, triggering human validation when confidence falls below 0.75 threshold.
Fig. 2: Data Ingestion Pipeline Architecture
2.3 Intelligent KPI Discovery
The KPI discovery service operates through a threestage pipeline:
Pattern Analysis Layer identifies statistical patterns, trends, and anomalies using time-series decomposition and clustering algorithms. It processes numerical columns for distribution analysis and categorical columns for cardinality assessment.
Business Context Integration maintains industryspecific knowledge graphs containing common KPIs, calculation methods, and business rules. Context matching is achieved through semantic similarity scoring between dataset characteristics and knowledge base entries.
Relevance Scoring System combines pattern significance scores with business context matches to rank potential KPIs. Implementation uses weighted scoring with weights adjusted based on user feedback history.
III. FEEDBACK LOOP ARCHITECTURE
3.1 Multi-Channel Feedback Collection
The system implements five distinct feedback channels to ensure comprehensive user input capture as shown in Fig. 3:
Fig. 3: Multi-Channel Feedback Collection Architecture
-
Explicit Rating System: Users rate dashboard relevance, visualization appropriateness, and insight accuracy on 5 point scales with contextual prompts explaining rating criteria.
-
Behavioral Analytics: Mouse tracking, scroll patterns, time-on-dashboard, and click-through rates automatically captured through JavaScript analytics with heatmap generation.
-
Correction Interface: Users can modify KPI calculations, adjust chart types, and reorganize layouts through drag-and-drop interfaces with all modifications logged.
-
Contextual Annotations: Comment system allowing users to add business context, explain anomalies, and provide domain knowledge with NLP processing for insight extraction.
-
A/B Testing Framework: Automated generation of dashboard variants for comparative evaluation with statistical significance testing.
3.2 Human-in-the-Loop Quality Assurance
The HITL system incorporates three key components:
Expert Review Workflow: Business analysts review AI-generated insights before publication to executive dashboards. The review interface highlights confidence scores, data quality metrics, and potential interpretation issues.
Collaborative Validation: Multi-user validation system where domain experts can approve, reject, or modify generated insights with consensus mechanisms to resolve conflicts.
Escalation Protocols: Automated detection of highimpact insights triggers senior analyst review based on criteria including large variance from historical patterns and low confidence scores.
3.3 Adaptive Learning Pipeline
The learning system operates on multiple timescales:
- Daily batch processing consolidates feedback from all channels into structured training datasets
- Weekly retraining of KPI discovery models using accumulated feedback
- Monthly updates for schema detection models due to lower feedback volume
- Continuous performance monitoring with automated alerts for performance degradation
IV. IMPLEMENTATION RESULTS
4.1 Deployment Architecture
The system is deployed on a Kubernetes cluster with 12 nodes (4 CPU cores, 16 GB RAM each) with horizontal pod autoscaling. Storage architecture includes PostgreSQL for transactional data and ClickHouse for analytics storage. The data lake implementation uses MinIO for raw data storage with processed datasets cached in Redis.
Table I: Performance Comparison Results
| Metric | Traditional | AI-Assisted | Improvement |
| Dashboard Creation Time | 8.5 hours | 4.5 hours | 47% |
| Time-to-UsefulInsights | 12.5 hours | 2.3 hours | 82% |
| User Satisfaction (Initial) | N/A | 78% | N/A |
| User Satisfaction (PostFB) | N/A | 89% | 14% |
| Schema Detection Accuracy | N/A | 84% | N/A |
| KPI Discovery Precision | N/A | 72% | N/A |
System Reliability: The system achieved 99.2% uptime over a 6-month deployment period. Schema detection accuracy improved from 76% initial deployment to 84% through feedback integration.
Processing Capabilities: The system handles up to 50 concurrent dashboard generation requests with average processing time of 3.2 minutes for datasets under 1M records and 12 minutes for datasets up to 10M records.
4.3 Feedback Loop Effectiveness
Feedback analysis reveals significant impact on system performance:
-
Average 23 feedback interactions per dashboard per week • 68% explicit ratings, 32% behavioral analytics • Model accuracy improvements plateau after 3 weeks of feedback collection per user cohort • Expert review reduces false positive insights by 34%.
-
Average review time: 8 minutes per dashboard.
V. REAL-WORLD CASE STUDIES
5.1 Manufacturing Company Deployment
A mid-size manufacturing company deployed the system with 45 users across operations, finance, and executive teams. Data sources included ERP system, IoT sensors, and quality management database.
Results achieved: • 62% reduction in reporting preparation time • Identification of 3 previously unknown efficiency bottlenecks • Heavy customization of operational dashboards • Minimal changes required for executive summaries B. E-commerce Platform Implementation.
An e-commerce platform deployed the system with 28 users in marketing, sales, and customer success teams. Data sources included web analytics, CRM, payment processing, and customer support systems.
Key outcomes: • 38% improvement in campaign ROI through automated insight detection • Frequent A/B testing of dashboard layouts • Extensive use of annotation features for business context • Rapid identification of customer behavior patterns.
VI. CHALLENGES AND SOLUTIONS
6.1 Scalability Challenges
Challenge: Feedback processing creates computational overhead that scales non-linearly with user base.
Solution: Implemented asynchronous feedback processing with priority queuing. High-impact feedback processed immediately, routine feedback batched for off-peak processing.
6.2 Data Quality and Governance
Challenge: Automated processing may miss data quality issues that human analysts would identify.
Solution: Multi-layered data quality assessment with statistical anomaly detection, business rule validation, and mandatory human review for high-stakes insights.
6.3 User Adoption and Trust
Challenge: Users initially skeptical of AI-generated insights, leading to low engagement.
Solution: Transparent confidence scoring display, detailed explanations of automated decisions, and easy override mechanisms with progressive feature rollout.
VII. FUTURE WORK
Future architectural enhancements include:
- Natural language feedback processing using large language models • Integration with business context management systems • Federated learning architecture for multi-tenant deployments • Real-time adaptation with hourly model updates • Advanced causal inference integration
VIII. CONCLUSION
The Self-Service Analytics 2.0 architecture demonstrates that effective automated dashboard generation requires sophisticated feedback integration and human-in-the-loop quality assurance. Our implementation results show meaningful improvements in dashboard creation efficiency while maintaining high user satisfaction through continuous learning mechanisms.
The key architectural insight is that automation must be designed as human augmentation rather than replacement. The feedback loops and validation workflows ensure that AI-generated insights remain aligned with evolving business needs and user preferences.
The 47% reduction in dashboard creation time combined with 78% initial user satisfaction indicates that AI-powered automation can enhance rather than replace human analytical capabilities. Future deployments will focus on scaling the feedback processing architecture and expanding the human-in-the-loop mechanisms to support more complex analytical workflows.
ACKNOWLEDGMENT
The author would like to thank the industry partners who provided real-world deployment environments and feedback for system validation. Special acknowledgment to the business analysts and domain experts who participated in the human-in-the-loop validation processes.
Conflict of Interest
The authors declare no conflict of interest.
Ethical Approval
Not applicable
Data Availability
The datasets used in this study are openly available at [repository link] and the source code is available on GitHub at [GitHub link].
Funding
This work did not receive any external funding.
References
Cite this article


Special Issue
Launch a focused special issue to highlight research, emerging trends, and expert insights in your academic field.
