





IntelliPaper
Abstract
Background: When COVID-19 vaccines arrived in Uganda in March of 2021, there was inadequate information on vaccine acceptance in the population due to many factors, but mainlydue to misinformation and disinformation circulating in Ugandan media. This study aimed to determine the prevalence and factors associated with COVID-19 vaccine acceptance among adult population in northern Uganda.
Methods: We conducted a cross-sectional study on 723-adult populations in northern Uganda from March to April of 2022. Participants were selected by systematic sampling from twenty-four health facilities in Acholi sub-region. SPSS version 25.0 was used for data analysis at multivariable regression analysis and a p-value
Explore Digital Article Text
I. INTRODUCTION
Coronavirus disease 2019 (COVID-19) is one of today's most significant public health worries world-wide [1,2]. As a result, much effort has been devoted to implementing control strategies for COVID-19 pandemic globally, for example, lockdown measures, travel bans, isolation of confirmed cases and close contacts, bans on mass gatherings, social distancing, wearing facemasks, COVID-19 vaccination, and other hygiene measures, but the transmission of the virus is likely to blowback when these strategies are lifted [2]. Thus, many scholars, academicians, physicians, and public health specialists have observed that of the many approaches to control this pandemic, mass COVID-19 vaccination is one of the top priority interventions [3]. It is now known that COVID-19 vaccines can potentially decrease the spread of coronavirus by reducing its incidence, risks of developing severe disease and hospitalization, and death in the general population; however, these have generated a lot of debate in the population [4].
Reports from Vaccine Alliance found that wealthier nations had hoarded so much of COVID-19 vaccines that it was predicted that many of the low-to-middle-income countries would most likely not receive COVID-19 vaccines in 2021 [5]. In addition, in Africa, where most vaccines for many killer diseases have been very successful in reducing infant and child mortality rates and increased the lifespan of the current population, the population suffered from false rumors and conspiracy theories that have led to COVID-19 vaccine hesitancy; a factor jeopardizing critical efforts to stop the spread of severe -acute-respiratory-syndrome-coronavirus-2 (SAR S-CoV-2) on the continent [5].
Also, vaccine safety and access to COVID-19 vaccines have been among the top concerns of most respondents in a survey conducted by GeoPoll in sub-Saharan Africa . The survey showed that 23% of respondents believed that whoever paid for COVID-19 vaccines got it first, thus highlighting the inequity in healthcare resource distribution at critical moments, especially in sub-Saharan Africa .
Experts have described COVID-19 vaccine hesitancy as one of the top ten commonest threats to global health security in 2019 [6], and as defined by the World Health Organization (WHO), vaccine hesitancy is a reluctance or refusal by a person to get vaccinated despite availability of vaccines [6]. Accordingly, WHO states that some reasons people choose not to get vaccinated include the lack of trust in the healthcare systems, complacency, and inconvenience in getting vaccines [6]. On the other hand, vaccine acceptance is defined as the degree to which individuals accept, question, or refuse vaccination, and it determines vaccine uptake and distribution successes [7].
As part of a broader process to prioritize frontline health workers' vaccination with limited COVID-19 vaccines in Uganda, a recent report from Amuru district local government in northern
Uganda showed that most COVID-19 vaccines sent for health workers were not used and were at risk of getting expired . In response, the Resident District Commissioner (RDC) of Amuru issued an ultimatum to health workers to either get vaccinated with COVID-19 vaccines or quit their jobs .
So, looking broadly at vaccine acceptance in Uganda, it was found that approximately (600/1,000) of respondents were interested in getting COVID-19 vaccines [9]. However, there were no comprehensive details on regional prevalence of COVID-19 vaccine acceptance as Uganda prepared to roll out mass COVID-19 vaccinations. As seen in many reports on the management of diseases with epidemic potential, population's education is part of the prevention and control strategies, particularly to inform people to change their habits and behaviors and holistically tackle the spread of the infection [10].
However, despite this vast knowledge on the role played by the population's goodwill in managing epidemics, some African governments still wanted to cut health education-related budgets during the COVID-19 pandemic . Such moves on health budget cuts during the pandemic could hamper efforts to effectively educate and vaccinate the general population in the African continent.
Remarkably, one study conducted among medical students in the United States of America (USA) showed that there was COVID-19 vaccine hesitancy and that 23% were unwilling to take COVID-19 vaccines [11]. Students raised concerns about COVID-19 vaccines, especially regarding the population's trust in public healthcare systems and side effects of COVID-19 vaccines [11].
Similarly, findings among university students in Italy, the United Kingdom, and Turkey showed a high COVID-19 vaccine hesitancy ranging from 14% to 31% [12].
On COVID-19 vaccine hesitancy, many scholars and experts view the many uncertainties surrounding the origin of the SAR-CoV-2 virus as the main underlying reason . In addition, a study found that COVID-19 vaccine hesitancy was associated with beliefs and suspicions about the origin of the SAR-CoV-2 virus [13]. It is said that most people who believed in the natural evolution of SAR-CoV-2 virus were more likely to accept COVID-19 vaccines than those who thought the virus was manufactured [13].
In Jordan and Kuwait, a study investigating COVID-19 vaccine hesitancy found that misinformation and disinformation circulating in social media with numerous conspiracy theories extensively played a part in vaccine hesitancy in that population . In the same study, 28% of participants believed COVID-19 vaccines were to introduce microchips into recipients' bodies, and 23% thought COVID-19 vaccines were to reduce fertility in their population .
Also, a study on COVID-19 vaccine hesitancy in healthcare workers in two large academic centers in South Africa found that 90% of the 1308 sampled population accepted COVID-19 vaccines [15]. However, healthcare workers with lower educational status and those who previously refused other vaccines were less likely to take COVID-19 vaccines [15]. In addition, Ahmed and colleagues researching COVID-19 vaccine acceptability in Somalia found that 23% of their survey population were reluctant to take COVID-19 vaccines, and being a female was associated with vaccine hesitancy [16].
Not much is known or published on COVID-19 vaccine acceptance in the general Ugandan population. Because of this, several questions have been raised, and many more unanswered questions are being asked on the level of vaccine hesitancy/inquisitiveness or acceptance in the general Ugandan population as the country prepared to roll out COVID-19 vaccinations.
This study aimed to determine the prevalence and factors associated with COVID-19 vaccine acceptance among adult population of northern Uganda.
II. METHODS
Study design: We conducted a cross-sectional study among adult population in northern Uganda from March to April 2022.
2.1 Study Sites
The study was conducted in Outpatient Departments (OPDs) of twenty-four health facilities in nine districts of Acholi sub-region in northern Uganda. Namukora HC IV, Kitgum Government, and St. Joseph's Hospitals in Kitgum district; Padibe HC IV, Palabek HC III, and Madi Open HC IV in Lamwo district; Pajule HC IV, Atanga-Lacekocot HCIII and Pader HC III in Pader district, Dr. Ambrosoli memorial Hospital, Kalongo and Patongo HCIII in Agago district; Lalogi HC IV, Opit HC III and Odek HC III in Omoro district; Anaka Hospital and Koch Goma HC III in Nwoya district; Atiak HC IV, Pabbo HCIII and Amuru HC III in Amuru district, St. Mary's Hospital Lacor, Independent Hospital, Gulu Regional Referral Hospital in Gulu City; Awach HC IV and Cwero HC III in Gulu district.
These health centers (HCs) were selected based on their participation in offering free COVID-19 vaccines to the region's population.
2.2 Study Population
We recruited participants (adults/ 18 years) who were attendees or attendants to outpatient clinics of the twenty-four health facilities in northern Uganda's nine districts of the Acholi sub-region.
The selection of participants was stratified at regional level into nine districts of the Acholi subregion and at district level to twenty-four health facilities (Hospitals, HCIVs, and HCIIIIs).
2.3 Selection Criteria
2.4 Sample Size Estimation
The study was conducted in the Outpatient Department (OPD) in each of the twenty-four health facilities. Participants were selected by systematic sampling in that every third adult attendee or attendant aged 18 years and above who consented to the study were recruited. We excluded participants who were critically ill and those who were not willing to answer our research questions.
2.5 Sampling Technique
The sample size was calculated based on the Raosoft sample size calculation methods. The computation was built on a 50% response distribution, 5% margin of error, and 95% Confidence Interval. The online software foundation uses a widely utilized descriptive sample size estimation formula . The research team chose this software calculator because Raosoft, Inc. form and survey software comprises a database management system of great strength and reliability that communicates with other proprietary formats. In addition, the Raosoft database is a highly robust, proven system with high data integrity and security .
Based on the assumption of a population size of 45,000 clients and visitors in one month in all the health facilities in the Acholi subregion, the minimum sample size was calculated to be 396 participants.
We conducted a stratified sampling approach at regional and district levels, and a systematic sampling approach for selecting participants at each of the twenty-four health facility's outpatient departments . The Acholi subregion was stratified into the nine districts (Gulu City, Gulu, Nwoya, Amuru, Omoro, Pader, Agago, Kitgum, and Lamwo districts) and further into twenty-four selected health facilities (Hospitals, HCIVs, and HCIIIIs) where COVID-19 vaccines were administered freely to the population. At each outpatient department, every day from morning to evening, a third attendee or attendant was selected from the OPD register by a systematic sampling method for one week until the required sample size was achieved .
It was estimated that approximately 45,000 people receive health services in the twenty-four selected health facilities' outpatient departments in one month. We also defined systematic sampling as a probability sampling method where researchers select population members at regular intervals [19, 20]. We chose this sampling technique because it allowed us to quickly get the desired sample size, thereby reducing the risk of our study team acquiring COVID-19. In addition, we chose the outpatients' department because it was the most convenient place to receive participants for this study as most population were still apprehensive about receiving or accepting visitors or researchers in their homes, offices, or public places as the Government of Uganda had recently eased the lockdown measures and the population were still in fear of contracting the virus.
Also, outpatient departments had the required facilities for infection, prevention, and control (IPC) and standard operating procedures (SOPs), allowing interviewees and interviewers to interact while following the national COVID-19 standard protocols. Last but most importantly, systematic sampling method helps to minimize biased samples and poor survey results in addition to eliminating clustered selection with a low probability of obtaining contaminated data , which was the ideal situation the research team had to achieve.
2.6 Study Variables
The dependent variable was COVID-19 vaccine acceptance ("Have you received a jab of COVID-19 vaccine? and the answer was either "yes" and coded as "1" or "no" and coded as "o" for the analysis).
The independent variables were the sociodemographic characteristics such as; age, sex, occupation, religion, level of education, tribe, marital status, districts, presence of comorbidities, nationality, race, health insurance coverage status, and whether participants "Strongly agree" ("SA"), "Agree," ("A"), "Neutral" ("N"), "Disagree" ("DA") or "Strongly Disagree," ("SD") that vaccines in health facilities in northern Uganda were safe.
2.7 Data Collection Methods
Data were collected using face-to-face questionnaire interviews by our research team, strictly following Uganda's standard operating procedures (SOPs) and COVID-19 infection, prevention, and control (IPC) guidelines [21]. We used a questionnaire constructed in English, consisting of questions on sociodemographic characteristics and participants' views on vaccine safety in health facilities in the Acholi sub-region (Additional file 1). The questionnaire was developed and grounded on literature reviews and discussions by our research team [22, 23].
Further, the questionnaire was pretested among out patients at Gulu Regional Referral Hospital with an internal validity of Cronbach's .
Also, participants were assured of confidentiality and privacy of their responses to reduce potential bias introduced by self-reported data. In addition, the questionnaire was designed short to minimize lethargy in answering questions which made it easy for participants' responses.
2.8 Data Analysis
Data analysis was performed using SPSS statistical software version 25.0. Continuous variables were presented in means, histograms, standard deviations, medians, and interquartile ranges. Categorical data were presented as frequencies and percentages. Chi-square and crosstabs tests were performed on categorical data when comparing two or more groups. Also, to assess associations of each independent variable with COVID-19 vaccine acceptance (dependent variable), a bivariable logistic regression analysis was conducted and Crude Odds Ratios (COR), at 95% Confidence Intervals (CI) and P-values were presented.
Independent variables found insignificant at bivariable level but with (P-values ) were included in the final multivariable logistic regression analysis model together with significant independent variables and the dependent variable. However, independent variables that had P-values above 0.201 at bivariable level were not included in the final multivariable regression models. In the multivariable regression analysis, we constructed two models by categorizing independent variables into sociodemographic characteristics, comorbidity status, national insurance coverage status, and participants' views on safety of vaccines in health facilities of northern Uganda.
The first multivariable logistic regression model included participant's socio-demographic characteristics (age, sex, level of education, districts, religion, occupation, and smoking status). After that, we constructed a second and final multivariable regression model adjusting for participants' comorbidity status, health insurance coverage status and views on the safety of vaccines in health facilities of northern Uganda.
The adjusted odds ratios (aOR) at 95% Confidence Intervals (CI) and p-values were determined with a significant level set at a p-value \<0.05.
2.9 Ethical Approval
III. RESULTS
The most important finding from this study was that COVID-19 vaccine acceptance among adult participants in northern Uganda was high at 580/723 (80.2%, 95%CI: 78.9%-83.4%). Among sociodemographic characteristics, most participants were males 394/723 (54.5%), in the age-group of 20-29 years 279/723 (38.6%) and married 377/723 (52.1%). Most participants were Catholics 354/723 (49.0%), Acholi 446/723 (61.7%), and from Gulu district 364/723 (50.4%).
Most had secondary level of education 237/723 (32.8%), non-health workers 518/723 (71.7%), and Ugandans by nationality 720/723(99.6%), Africans by race 721/723(99.7%), did not smoke cigarettes 699/723 (96.7%), never drank alcohol 521/723 (72.1%), had no comorbidities 520/723 (71.9%), most agreed that vaccines in health facilities in northern Uganda were safe 250/723 (34.6%), and most had no health insurance coverage 666/723 (92.1%) (Table 1).
Participants' ages were normally distributed with a mean age of 31.4 years SD±10.1 at (95%CI: 30.62-32.10), median age of 30 years, minimum age of 18 years, and maximum of 75 years. The interquartile range was 14 years with a range of 57 (Figure 1).
Participants' perceptions and views on COVID-19 in northern Uganda were that most of them had been exposed to coronavirus 407/723 (56.29%); most were worried about getting infected with the virus 491/723 (67.91%); most had got vaccinated with COVID-19 vaccines 580/723 (80.22%); most had been vaccinated with AstraZeneca 414/723 (57.26%) and had received all two doses of the vaccine 392/723 (54.22%) (Table 2).
The reasons why participants accepted COVID-19 vaccines (taking a COVID-19 vaccine jab) at bivariable analysis were; participants considered prior exposure to the COVID-19, ; p=0.023; the fear of getting infected with the virus, ; p\<0.000; the fear of death, ; p=0.027; the fear of a family member getting infected, ; p=0.055; worries of being forced to take COVID-19 medications, ; p=0.031; worries of being forced to take COVID-19 vaccines, ; p=0.004; and those who had no worries about COVID-19 vaccines, ; p\<0.000 (Table 3).
Symptoms and signs experienced by participants who received COVID-19 vaccines in our study population varied by characteristics. Findings in this study offer significant differences in signs and symptoms shared among age-groups, especially excessive sweating, and the fear of death, among older age-groups.
Joint pains,; p=0.058; loss of appetite,; p=0.020; blood clots,; p\<0.002; the fear of death,; p\<0.0001; and excessive sweating,; p=0.001 were reported among participants from districts.
Blood clots ; p=0.002 and fear of death ; p=0.014 were reported at different educational levels of participants. For occupation, blood clots ; p=0.003 and the fear of death ; p=0.026 were reported, while blood clots ; p=0.005 and the fear of death ; p=0.000 were reported among participants with comorbidities (Table 4).
Table 5 shows the preferred COVID-19 vaccine taken by participants (N=723). The table shows there was a substantial difference between males and females in the COVID-19 vaccine taken ; p=0.001; age-groups ; p=0.001; religious groups ; p=0.048; districts ; p\<0.000; tribes ; p=0.008; and among those with and without comorbidities ; p=0.001.
Furthermore, multivariable logistic regression analyses were conducted to determine factors associated with COVID-19 vaccine acceptance among this study population. The analysis found that participants who disagree that vaccines in health facilities in northern Uganda were safe, were 1.98 times more likely to accept COVID-19 vaccines, (aOR=1.98,95% CI: 1.01-3.89; p=0.046) and participants who strongly disagree that vaccines in health facilities in northern Uganda were safe, were 3.31 times more likely to accept COVID-19 vaccines (OR=3.31, 95% CI:1.49-7.36; p=0.003) than those who strongly agree, respectively. Participants from Gulu district were 5.19 times more likely to accept COVID-19 vaccines (aOR=5.19,95% CI:1.71-15.80; p=0.004); Kitgum district were 6.05 times more likely (a OR=6.05, 95% CI:1.76-20.80; p=0.004); and
Pader district were 3.45 times more likely to accept COVID-19 vaccines (aOR=3.45,95% CI:1.07-11.14; p=0.038) than Lamwo district, respectively; smokers were 7.75 times more likely to accept COVID-19 vaccines (aOR=7.75,95% CI:2.06-29.23; p=0.002) than non-smokers; females were 1.95 times more likely to accept COVID-19 vaccines (aOR=1.95,95% CI:1.04-2.42; p=0.032) than males; Baganda tribe were 5.19 times more likely to accept COVID-19 vaccines (a OR=5.19,95% CI:1.71-15.80; p=0.004); and other tribes (Alur, Basoga, Banyoro) were 6.05 times more likely to accept COVID-19 vaccines (OR=6.05,95% CI:1.76-20.80; p=0.004) than Itesot tribe, respectively; non-health-workers were 1.74 times more likely to accept COVID-19 vaccines (aOR=1.74,95% CI:1.03-2.96; p=0.040) than health workers. However, participants with comorbidities (aOR = 0.42,95% CI:0.24-0.71; p=0.001) were 58% less likely to accept COVID-19 vaccines than those who did not have; graduates were 58% less likely to accept COVID-19 vaccines (aOR=0.42,95% CI:0.18-0.99; p=0.049) than participants with primary education; and age-group of 20-29 years were 48% less likely to accept COVID-19 vaccines (OR= 0.52,95% CI:0.31-0.86; p=0.011) than 30-39 year age-group (Table 6).
A map showing Acholi subregion and the nine districts is presented showing the health facilities where this study was conducted. A near-uniform distribution of health facilities in the region has been noted, indicating that findings from our study are representative of the region's population (Figure 2).
Table 1: The Socio-Demographic Characteristics of Participants in Northern Uganda
| Variables | Frequency (N=723) | Percent (%) |
| Sex | ||
| Female | 329 | 45.5 |
| Male | 394 | 54.5 |
| Age (years) | ||
| Less than 20 | 80 | 11.1 |
| 20-29 | 279 | 38.6 |
| 30-39 | 225 | 31.1 |
| 40-49 | 95 | 13.1 |
| 50 and above | 44 | 6.1 |
| Marital status | ||
| Never married | 316 | 43.7 |
| Married | 377 | 52.1 |
| Others | 30 | 4.1 |
| Religions | ||
| Catholic | 354 | 49.0 |
| Protestant | 226 | 31.3 |
| Others | 143 | 19.8 |
| Tribes | ||
| Acholi | 446 | 61.7 |
| Itesot | 22 | 3.0 |
| Lango | 82 | 11.3 |
| Baganda | 49 | 6.8 |
| Others | 124 | 17.2 |
| Districts | ||
| Agago | 83 | 11.5 |
| Amuru, Nwoya and Omoro | 25 | 3.5 |
| Gulu | 364 | 50.3 |
| Kitgum | 57 | 7.9 |
| Lamwo | 62 | 8.6 |
| Pader | 132 | 18.3 |
| Level of education | ||
| No education | 18 | 2.5 |
| Primary | 61 | 8.4 |
| Secondary | 237 | 32.8 |
| Diploma | 146 | 20.2 |
| Graduate | 200 | 27.7 |
| Postgraduate | 61 | 8.4 |
| Occupations | ||
| Health worker | 205 | 28.4 |
| Non-health worker | 518 | 71.6 |
| Nationality | ||
| Ugandan | 720 | 99.6 |
| Others | 3 | 0.4 |
| Race | ||
| African | 721 | 99.7 |
| European | 2 | 0.3 |
| Health insurance coverage | ||
| No | 666 | 92.1 |
| Yes | 57 | 7.9 |
| Smoking status | ||
| No | 699 | 96.7 |
| Smoker | 12 | 1.7 |
| Ex-Smoker | 12 | 1.7 |
| Alcohol use status | ||
| Never drank | 521 | 72.1 |
| Drinks | 127 | 17.6 |
| Quit drinking | 75 | 10.4 |
| Comorbidities | ||
| No | 520 | 71.9 |
| Yes | 203 | 28.1 |
| Vaccines in health facilities in the region are safe | ||
| Strongly Agree | 129 | 17.8 |
| Agree | 250 | 34.6 |
| Neutral | 180 | 24.9 |
| Disagree | 113 | 15.6 |
| Strongly Disagree | 51 | 7.1 |
Table 1 Shows That Most Participants Were Males 394/723(54.5%); in the Age-Group of 20-29 Years 279/723 (38.6%); Married 377/723 (52.1%); Catholics 354/723 (49.0%); Acholi by Tribe 446/723 (61.7%); From Gulu District 364/723 (50.4%), Had Secondary Level of Education 237/723 (32.8%), Non-Health Workers 518/723 (71.7%); Ugandans by Nationality 720/723 (99.6%); Africans by Race 721/723 (99.7%); Did Not Smoke Cigarettes 699/723 (96.7%); Never Drank Alcohol 521/723 (72.1%); Had No Comorbidities 520/723 (71.9%); Agreed That Vaccines in Health Facilities in the Region Were Safe 250/723 (34.6%); and Had No Health Insurance Coverage 666/723(92.1%).
{"image_source":{"path":"images/2d721e29f8d50d6e272ffddd86ad1dc054a030f9ab2eea93a8717481494d8517.jpg"},"content":"","chart_caption":[{"type":"text","content":"Figure 1: Age Distribution of Participants"}],"chart_footnote":[]}
Figure 1 is a Histogram Showing an Age Distribution of Participants with a Mean Age of 31.36 Years (SD ±10.07) at 95% CI:30.62-32.10; Median Age of 30 Years, Minimum Age of 18 Years, and a Maximum of 75 Years. the Interquartile Range of 14, and a Range of 57.
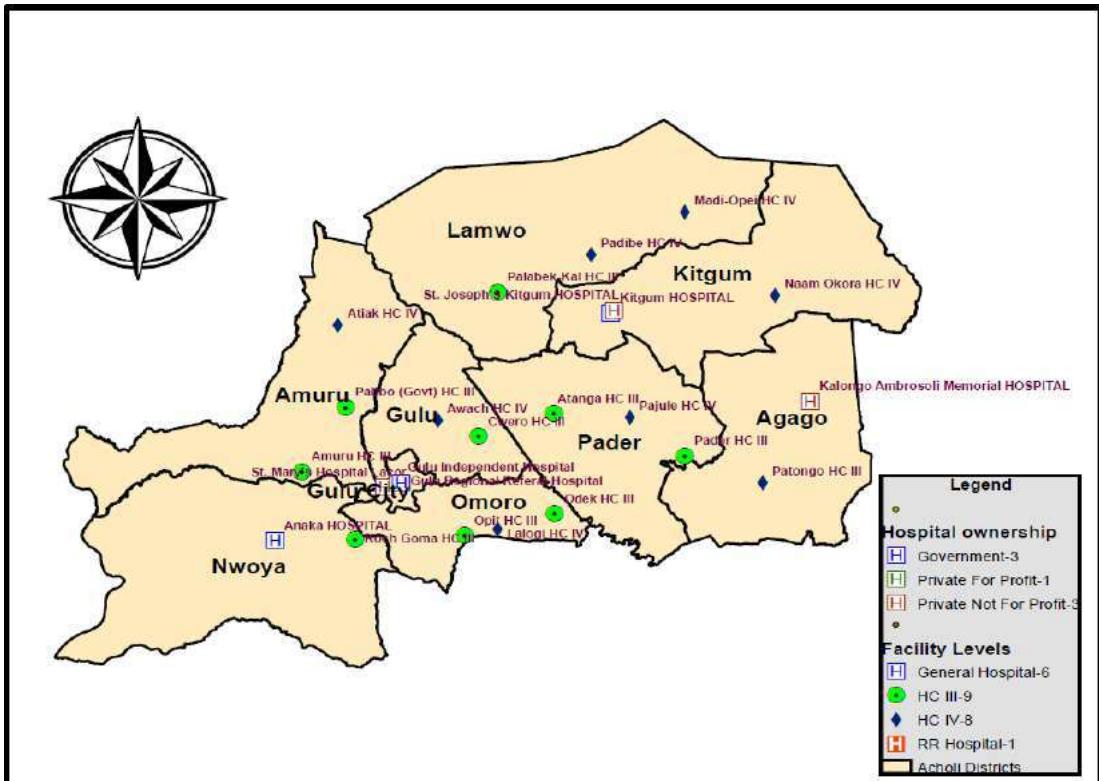 Figure 2: Map Showing Districts and Health Facilities Where the Study Was Conducted in the Acholi Sub-Region of Northern Uganda
Table 2: Participants' Views on COVID-19 and Vaccinations among Participants in Northern Uganda
| Variables | Yes (n,%) | No (n,%) |
| Have you been exposed to coronavirus? | 407(56.3) | 316(43.7) |
| What are you most worried about during this COVID-19 pandemic? | ||
| The fear of getting infected with coronavirus | 491(67.9) | 232(32.1) |
| The fear of a family member getting infected with coronavirus | 440(60.9) | 283(39.1) |
| The fear of death | 462(63.9) | 261(36.1) |
| Financial related worries | 325(45.0) | 398(55.0) |
| Food insecurity related worries | 163(22.5) | 560(77.5) |
| Unavailability of vaccines | 114(15.8) | 609(84.2) |
| Coronavirus is a plot or a conspiracy theory | 62(8.6) | 661(91.4) |
| I may be forced to take medicines for coronavirus | 59(8.16) | 664(91.8) |
| I may be forced to take COVID-19 vaccines | 158(21.9) | 565(78.1) |
| I am not worried about any COVID-19 issues | 34(4.7) | 689(95.3) |
| Have you got a jab of the COVID-19 vaccine? | 580(80.2) | 143(19.8) |
| Which COVID-19 vaccine have you received? | ||
| AstraZeneca | 414(57.3) | |
| Johnson and Johnson | 17(2.4) | |
| Modena | 117(16.2) | |
| Pfizer | 14(2.0) | |
| Sinovac | 13(1.8) | |
| Sputnik | 7(1.0) | |
| None | 141(19.5) | |
| How many doses of the COVID-19 vaccine have you received? | ||
| One | 189(26.1) | |
| Two | 392(54.2) | |
| None | 142(19.6) | |
Table 2 Shows That Most Participants Had Been Exposed to Coronavirus 407/723 (56.3%); Were Worried About Getting Infected With Coronavirus 491/723 (67.9%); Had Got Vaccinated With COVID-19 Vaccines 580/723 (80.2%); Had Got Vaccinated With Astra Zeneca 414/723 (57.3%) and Had Received All the Two Doses 392/723 (54.2%).
Table 3: Reasons Why Participants Accepted COVID-19 Vaccines (Taking a Jab) at Bivariable Analysis
| Participants' Responses | ||||
| Variables | Yes (n,%) | No (n,%) | $\chi^2$ | p-value |
| Those who were exposed to coronavirus | 337(46.6) | 243(33.6) | 5.183 | 0.023 |
| The fear of getting infected with coronavirus | 413(57.1) | 167(23.1) | 14.614 | 0.000 |
| The fear of death | 382(52.8) | 198(27.1) | 4.892 | 0.027 |
| The fear of a family member getting infected | 363(50.2) | 217(30.0) | 3.679 | 0.055 |
| Financial worries | 268(37.1) | 312(43.2) | 1.867 | 0.172 |
| Job-related worries | 152(21.0) | 428(59.2) | 0.183 | 0.669 |
| Food insecurity worries | 134(18.5) | 446(61.7) | 0.524 | 0.469 |
| Worries about unavailability of vaccines | 96(13.3) | 484(66.9) | 1.357 | 0.244 |
| Worries that COVID-19 is a plot or conspiracy theory | 47(6.5) | 533(73.7) | 0.833 | 0.361 |
| Worries of being forced to take COVID-19 medications | 41(5.7) | 539(74.6) | 4.661 | 0.031 |
| Worries about being forced to take COVID-19 vaccines | 114(15.8) | 466(64.5) | 8.297 | 0.004 |
| No worries on issues of COVID-19 vaccines | 19(2.6) | 561(77.6) | 13.32 | 0.000 |
Table 4: Symptoms and Signs Experienced by Participants Who Received COVID-19 Vaccines
| Variables | Age groups | Marital status | Religion | Tribe | Districts | Level of Education | Occupation | Nationality | Race | Comorbidities |
| Fever | 3.146(p=0.534) | 4.786(p=0.310) | 2.453(p=0.653) | 2.148(p=0.709) | 7.582(p=0.371) | 4.694(p=0.454) | 0.072(p=0.789) | 0.224(p=0.974) | 0.149(p=0.699) | 0.442(p=0.506) |
| Joint pains | 2.069(p=0.723) | 1.355(p=0.852) | 0.353(p=0.983) | 5.094(p=0.278) | 13.633(p=0.058) | 8.871(p=0.114) | 0.264(p=0.607) | 0.090(p=0.993) | 0.060(p=0.8007) | 2.037(p=0.153) |
| Loss of appetite | 3.927(p=0.416) | 1.311(p=0.846) | 1.592(p=0.810) | 6.284(p=0.179) | 16.573(p=0.020) | 3.593(p=0.609) | 1.395(p=0.237) | 0.025(p=0.999) | 0.017(p=0.899) | 1.440(p=0.230) |
| Steven-John son's reaction | 4.980(p=0.289) | 0.657(p=0.957) | 2.455(p=0.653) | 7.494(p=0.112) | 6.137(p=0.524) | 2.722(p=0.743) | 0.336(p=0.562) | 0.021(p=0.999) | 0.014(p=0.906) | 1.966(p=0.161) |
| Blot clot | 6.509(p=0.164) | 4.895(p=0.298) | 6.335(p=0.176) | 16.284(p=0.003) | 22.710(p=0.002) | 18.431(p=0.002) | 8.656(p=0.003) | 6.108(p=0.106) | 1.971(p=0.160) | 7.878(p=0.005) |
| Feeling dizzy | 0.691(p=0.952) | 0.461(p=0.977) | 1.549(p=0.818) | 8.880(p=0.064) | 3.060(p=0.879) | 5.532(p=0.354) | 0.890(p=0.346) | 0.108(p=0.99) | 0.072(p=0.789) | 1.870(p=0.171) |
| Death | 16.608(p=0.002) | 8.350(p=0.080) | 6.892(p=0.142) | 4.099(p=0.393) | 35.083(p=0.000) | 14.298(p=0.014) | 4.936(p=0.026) | 0.307(p=0.946) | 0.246(p=0.620) | 15.454(p=0.000) |
| Feeling uncomfortable | 4.402(p=0.354) | 0.786(p=0.940) | 1.762(p=0.779) | 3.335(p=0.503) | 4.855(p=0.678) | 3.971(p=0.554) | 1.023(p=0.312) | 0.064(p=0.994) | 0.042(p=0.837) | 1.078(p=0.299) |
Prevalence and Factors Associated with COVID-19 Vaccine Acceptance among Adult Population in Northern Uganda. A Cross-Sectional Study
Table 4 Shows Significant Differences in Signs and Symptoms Shared Among Age-Groups, Especially Excessive Sweating ; and the Fear of Death ; , Among Older Age-Groups. Joint Pains ; , Loss of Appetite ; , Blood Clots ; , the Fear of Death ; , and Excessive Sweating ; Were Common in Districts. Blood Clots ; and the Fear of Death ; Were Reported at Levels of Education. for Occupation, Blood Clots ; and the Fear of Death ; and Finally, Blood Clots ; and the Fear of Death ; Were Reported Among Participants With Comorbidities.
| Body pains and weakness | 6.383(p=0.172) | 10.042(p=0.040) | 5.340(p=0.254) | 5.998(p=0.199) | 6.898(p=0.440) | 8.933(p=0.112) | 0.291(p=0.589) | 6.842(p=0.077) | 0.307(p=0.579) | 0.974(p=0.324) |
| Getting the virus after vaccination | 0.880(p=0.927) | 18.387(p=0.001) | 3.361(p=0.499) | 4.538(p=0.503) | 11.458(p=0.120) | 5.611(p=0.346) | 1.001(p=0.317) | 0.034(p=0.998) | 0.022(p=0.881) | 0.038(p=0.846) |
| Fear of the COVID-19 vaccine | 3.636(p=0.458) | 0.321(p=0.988) | 0.793(p=0.939) | 10.482(p=0.033) | 2.563(p=0.922) | 0.876(p=0.972) | 0.037(p=0.848) | 0.013(p=0.998) | 0.008(p=0.927) | 1.176(p=0.278) |
| Heart complications | 7.793(p=0.099) | 5.193(p=0.268) | 4.412(p=0.353) | 2.369(p=0.668) | 7.936(p=0.922) | 2.683(p=0.749) | 0.348(p=0.998) | 0.042(p=0.998) | 0.028(p=0.867) | 2.413(p=0.120) |
| Excessive sweating | 10.163(p=0.038) | 0.693(p=0.952) | 0.793(p=0.939) | 10.158(p=0.038) | 24.316(p=0.001) | 2.730(p=0.742) | 0.037(p=0.848) | 0.013(p=1.000) | 0.008(p=0.927) | 1.176(P=0.278) |
| No Side-effects | 5.088(p=0.278) | 0.311(p=0.989) | 26.833(p=0.000) | 4.812(p=0.307) | 7.236(p=0.405) | 4.584(p=0.469) | 2.394(p=0.122) | 0.025(p=0.999) | 0.017(p=0.897) | 0.390(p=0.532) |
Table 5: The Preferred COVID-19 Vaccine Among Participants (N=723) at Bivariable Analysis Using Chi Square Test
| Variables | AZ | J&J | Moderna | Pfizer | Sinovac | Sputnik | None | Chi | df | p-value | |
| 1 | Sex | ||||||||||
| Female | 91(12.6%) | 109(15.1%) | 34(4.7%) | 6(0.8%) | 0(0.0%) | 1(0.1%) | 88(12.2%) | 22.362 | 6 | 0.001 | |
| Male | 115(15.9%) | 141(19.5%) | 26(3.6%) | 30(4.1%) | 3(0.4%) | 2(0.3%) | 77(10.7%) | ||||
| 2 | Age groups (years) | ||||||||||
| <20 | 21(2.9%) | 28(3.9%) | 8(1.1%) | 4(0.6%) | 0(0.0%) | 0(0.0%) | 19(2.6%) | 52.877 | 24 | 0.001 | |
| 20-29 | 77(10.7%) | 82(11.3%) | 25(3.5%) | 14(1.9%) | 1(0.1%) | 1(0.1%) | 78(10.84%) | ||||
| 30-39 | 73(10.19%) | 79(10.9%) | 12(1.7%) | 15(2.1%) | 0(0.0%) | 0(0.0%) | 45(6.2%) | ||||
| 40-49 | 21(2.9%) | 42(5.8%) | 15(2.1%) | 2(0.3%) | 0(0.0%) | 0(0.0%) | 15(2.1%) | ||||
| ≥50 | 14(1.9%) | 19(2.6%) | 0(0.0%) | 1(0.1%) | 2(0.3%) | 2(0.3%) | 8(1.1%) | ||||
| 3 | Marital status | ||||||||||
| Divorced | 4(0.6%) | 11(1.5%) | 1(0.1%) | 0(0.0%) | 0(0.0%) | 0(0.0%) | 7(1.0%) | 20.763 | 24 | 0.653 | |
| Married | 99(13.7%) | 141(19.5%) | 37(5.1%) | 16(2.2%) | 2(0.3%) | 3(0.4%) | 79(10.9%) | ||||
| Separated | 1(0.1%) | 0(0.0%) | 0(0.0%) | 0(0.0%) | 0(0.0%) | 0(0.0%) | 1(0.1%) | ||||
| Single | 100(13.8%) | 96(13.3%) | 21(2.9%) | 20(2.8%) | 1(0.1%) | 0(0.0%) | 1(0.1%) | ||||
| widowed | 2(0.3%) | 2(0.3%) | 1(0.1%) | 0(0.0%) | 0(0.0%) | 0(0.0%) | 78(10.8%) | ||||
| 4 | Religion | ||||||||||
| Born Again | 28(3.9%) | 31(4.3%) | 7(1.0%) | 9(1.2%) | 0(0.0%) | 1(0.1%) | 36(5.0%) | 36.56 | 24 | 0.048 | |
| Catholics | 98(13.6%) | 142(19.6%) | 21(2.9%) | 16(2.2%) | 2(0.3%) | 2(0.3%) | 73(10.1%) | ||||
| Muslims | 7(1.0%) | 8(1.1%) | 4(0.6%) | 1(0.1%) | 0(0.0%) | 0(0.0%) | 6(0.8%) | ||||
| Protestants | 69(9.5%) | 69(9.5%) | 28(3.9%) | 9(1.2%) | 1(0.1%) | 0(0.0%) | 50(6.9%) | ||||
| Others | 4(0.6%) | 0(0.0%) | 0(0.0%) | 1(0.1%) | 0(0.0%) | 0(0.0%) | 0(0.0%) | ||||
| 5 | Tribes | ||||||||||
| Acholi | 130(18.0%) | 163(22.3%) | 38(5.3%) | 10(1.4%) | 3(0.4%) | 3(0.4%) | 99(13.7%) | 43.666 | 24 | 0.008 | |
| Itesot | 7(1.0%) | 9(1.2%) | 1(0.1%) | 2(0.4%) | 0(0.0%) | 0(0.0%) | 3(0.4%) | ||||
| Lango | 25(3.5%) | 24(3.3%) | 9(1.2%) | 2(0.3%) | 0(0.0%) | 0(0.0%) | 0(0.0%) | ||||
| Baganda | 15(2.1%) | 16(2.2%) | 2(0.3%) | 8(1.1%) | 0(0.0%) | 0(0.0%) | 0(0.0%) | ||||
| Others | 29(4.0%) | 38(5.3%) | 10(1.4%) | 14(1.9%) | 0(0.0%) | 0(0.0%) | 33(4.6%) | ||||
| 6 | Districts | ||||||||||
| Agago | 28(3.8%) | 22(3.0%) | 8(1.1%) | 0(0.0%) | 1(0.1%) | 0(0.0%) | 24(3.3%) | 83.912 | 42 | 0.000 | |
| Amuru | 4(0.6%) | 1(0.1%) | 1(0.1%) | 1(0.1%) | 0(0.0%) | 0(0.0%) | 5(0.7%) | ||||
| Gulu | 105(14.5%) | 111(15.4%) | 19(2.6%) | 28(3.9%) | 2(0.3%) | 0(0.0%) | 99(13.7%) | ||||
| Kitgum | 20(2.8%) | 19(2.6%) | 8(1.1%) | 2(0.3%) | 0(0.0%) | 0(0.0%) | 8(1.1%) | ||||
| Lamwo | 17(2.4%) | 26(3.6%) | 10(1.4%) | 2(0.3%) | 0(0.0%) | 1(0.1%) | 6(0.8%) | ||||
| Nwoya | 1(0.1%) | 0(0.0%) | 0(0.0%) | 0(0.0%) | 0(0.0%) | 0(0.0%) | 3(0.4%) | ||||
| Omoro | 4(0.6%) | 5(0.7%) | 0(0.0%) | 0(0.0%) | 0(0.0%) | 0(0.0%) | 0(0.0%) | ||||
| Pader | 27(3.7%) | 66(9.1%) | 14(1.9%) | 3(0.4%) | 0(0.0%) | 2(0.3%) | 20(2.8%) | ||||
Table 5 Shows That There Was a Significant Difference in the Preferred COVID-19 Vaccine Jab Taken Between Males and Females ; ; Age-Groups ; ; Religious Groups ; ; Districts ; ; Tribal Groups ; ; Those With and Without Comorbidities ;
| 7 Level of education | ||||||||||
| No education | 3(04%) | 7(1.0%) | 2(0.3%) | 0(0.0%) | 0(0.0%) | 1(0.1%) | 5(0.7%) | 39.053 | 30 | 0.125 |
| Primary | 15(2.1%) | 22(3.0%) | 7(1.0%) | 3(0.4%) | 0(0.0%) | 0(0.0%) | 14(1.9%) | |||
| Secondary | 74(10.2%) | 77(10.7%) | 24(3.3%) | 10(1.4%) | 0(0.0%) | 2(0.3%) | 50(6.9%) | |||
| Diploma | 37(5.1%) | 58(8.0%) | 12(1.7%) | 10(1.4%) | 2(0.3%) | 0(0.0%) | 27(3.7%) | |||
| Degree | 61(8.4%) | 70(9.7%) | 11(1.5%) | 11(1.5%) | 1(0.1%) | 0(0.0%) | 46(6.4%) | |||
| Postgraduate | 16(2.2%) | 16(2.2%) | 4(0.6%) | 2(0.3%) | 0(0.0%) | 0(0.0%) | 23(3.2%) | |||
| 8 Occupations | ||||||||||
| Health workers | 60(8.3%) | 78(10.8%) | 13(1.8%) | 12(1.7%) | 0(0.0%) | 0(0.0%) | 42(5.8%) | |||
| Non-health workers | 146(20.2%) | 172(23.8%) | 47(6.5%) | 123(19.0%) | 24(3.3%) | 3(0.4%) | 3(0.4%) | 5.875 | 6 | 0.437 |
| 9 Health Insurance coverage | ||||||||||
| Yes | 20(2.8%) | 18(2.5%) | 3(0.4%) | 2(0.3%) | 0(0.0%) | 0(0.0%) | 14(1.4%) | 2.657 | 6 | 0.850 |
| No | 186(25.7%) | 232(32.1%) | 57(7.9%) | 34(4.7%) | 3(0.4%) | 3(0.4%) | 151(20.9%) | |||
| 10 Comorbidities | ||||||||||
| Yes | 46(6.4%) | 78(10.8%) | 27(3.7%) | 11(1.5%) | 1(0.1%) | 3(0.4%) | 37(5.1%) | 23.532 | 6 | 0.001 |
| No | 160(22.1%) | 172(23.8%) | 33(4.6%) | 25(3.5%) | 2(0.3%) | 0(0.0%) | 128(17.7%) | |||
Table 6: Bi-Variable and Multivariable Analysis of COVID-19 Vaccine Acceptance (N=723) Among Participants
| Variables | Vaccinated (N=580) (n,%) | Not Vaccinated (N=143) (n,%) | Unadjusted COR | 95% CI | p value | Adjusted OR | 95% CI | p value |
| Sex | ||||||||
| Male | 324 (82.2) | 70 (17.8) | Reference | Reference | ||||
| Female | 256 (77.8) | 73 (22.2) | 1.320 | (0.915- 1.904) | 0.138 | 1.587 | (1.042-2.418) | 0.032 |
| Age (years) | ||||||||
| 30-39 | 174 (77.3) | 51 (22.7) | Reference | Reference | ||||
| Less than 20 | 62 (77.5) | 18 (22.5) | 0.991 | (0.538-1.824) | 0.976 | 0.490 | (0.236-1.018) | 0.056 |
| 20-29 | 228 (81.7) | 51 (18.3) | 0.763 | (0.494-1.180) | 0.224 | 0.517 | (0.311-0.859) | 0.011 |
| 40-49 | 77 (81.1) | 18 (18.9) | 0.798 | (0.437-1.454) | 0.460 | 0.796 | (0.405-1.566) | 0.509 |
| 50 and above | 39 (88.6) | 5 (11.4) | 0.437 | (0.164-1.168) | 0.099 | 0.478 | (0.158-1.447) | 0.191 |
| Marital status | ||||||||
| Others | 24 (80.0) | 6 (20.0) | Reference | |||||
| Never married | 255 (80.7) | 61 (19.3) | 0.957 | (0.375-2.443) | 0.927 | |||
| Married | 301 (79.8) | 76 (20.2) | 1.010 | (0.399-2.558) | 0.983 | |||
| Religion | ||||||||
| Protestant | 176 (77.9) | 50 (22.1) | Reference | Reference | ||||
| Catholic | 295 (83.3) | 59 (16.7) | 0.704 | (0.704-1.072) | 0.102 | 0.653 | (0.409-1.044) | 0.075 |
| Others | 109 (76.2) | 34 (23.8) | 1.098 | (1.098-1.805) | 0.712 | 1.013 | (0.581-1.768) | 0.963 |
| Tribe | ||||||||
| Itesot | 19 (86.4) | 3 (13.6) | Reference | Reference | ||||
| Acholi | 353 (79.1) | 93 (20.9) | 1.669 | (0.483-5.760) | 0.418 | 1.292 | (0.337-4.959) | 0.709 |
| Lango | 69 (84.1) | 13 (15.9) | 1.193 | (0.308-4.622) | 0.798 | 2.921 | (0.613-13.922) | 0.179 |
| Muganda | 44 (89.8) | 5 (10.2) | 0.720 | (0.156-3.321) | 0.673 | 5.193 | (1.707-15.804) | 0.004 |
| Others | 95 (76.6) | 29 (23.4) | 1.933 | (0.534-7.000) | 0.315 | 6.046 | (1.758-20.801) | 0.004 |
| Districts | ||||||||
| Lamwo | 58 (93.5) | 4 (6.5) | Reference | Reference | ||||
| Agago | 76 (91.6) | 7 (8.4) | 1.336 | (0.373-4.780) | 0.657 | 1.292 | (0.337-4.959) | 0.709 |
| Amuru Nwoya and Omoro | 21 (84.0) | 4 (16.0) | 2.762 | (0.633-12.049) | 0.176 | 2.921 | (0.613-13.922) | 0.179 |
| Gulu | 276 (75.8) | 88 (24.2) | 4.623 | (1.632-13.096) | 0.004 | 5.193 | (1.707-15.804) | 0.004 |
| Kitgum | 41 (71.9) | 16 (28.1) | 5.659 | (1.763-18.165) | 0.004 | 6.046 | (1.758-20.801) | 0.004 |
| Pader | 108 (81.8) | 24 (18.2) | 3.222 | (1.067-9.734) | 0.038 | 3.450 | (1.068-11.144) | 0.038 |
| Level of education | ||||||||
| Primary | 49 (80.3) | 12 (19.7) | Reference | Reference | ||||
| No formal education | 14 (77.8) | 4 (22.2) | 1.167 | (0.325-4.188) | 0.813 | 0.697 | (0.163-2.976) | 0.626 |
| Secondary | 183 (77.2) | 54 (22.8) | 1.205 | (0.598-2.428) | 0.602 | 0.950 | (0.438-2.057) | 0.896 |
| Diploma | 118 (80.8) | 28 (19.2) | 0.969 | (0.456-2.059) | 0.935 | 0.669 | (0.277-1.614) | 0.371 |
| Graduate | 175 (87.5) | 25 (12.5) | 0.583 | (0.273-1.244) | 0.163 | 0.419 | (0.177-0.995) | 0.049 |
| Postgraduate | 41 (67.2) | 20 (32.8) | 1.992 | (0.871-4.555) | 0.103 | 1.278 | (0.486-3.360) | 0.619 |
| Occupations | ||||||||
| Health workers | 175 (85.4) | 30 (14.6) | Reference | Reference | ||||
| Non-health Workers | 405 (78.2) | 113 (21.8) | 1.628 | (1.048- 2.527) | 0.030 | 1.742 | (1.025-2.958) | 0.04 |
| Nationality | ||||||||
| Ugandan | 577 (80.1) | 143 (19.9) | Reference | |||||
| Others | 3 (100) | 0 (0.0) | 0 | 0 | 0.999 | |||
| Race | ||||||||
| African | 578 (80.2) | 143 (19.8) | Reference | |||||
| European | 2 (100) | 0 (0.0) | 0 | 0 | 0.999 | |||
| Health Insurance coverage | ||||||||
| No | 538 (80.8) | 128 (19.2) | Reference | Reference | ||||
| Yes | 42 (73.7) | 15 (26.3) | 1.501 | (0.807-0.791) | 0.199 | 1.278 | (0.636-2.568) | 0.49 |
| Smoking Status | ||||||||
| No | 564 (80.7) | 135 (19.3) | Reference | Reference | ||||
| Smoker | 6 (50.0) | 6 (50.0) | 4.178 | (1.327-13.156) | 0.015 | 7.754 | (2.057-29.232) | 0.002 |
| Ex-smoker | 10 (83.3) | 2 (16.7) | 0.836 | (0.181-3.858) | 0.818 | 1.215 | (0.210-7.020) | 0.828 |
| Alcohol drinking status | ||||||||
| Never drank | 425 (81.6) | 96 (18.4) | Reference | |||||
| Drinks | 98 (77.2) | 29 (22.8) | 1.310 | (0.819-2.096) | 0.260 | |||
| Quit drinking | 57 (76.0) | 18 (24.0) | 1.398 | (0.787-2.483) | 0.253 | |||
| Comorbidities | ||||||||
| No | 405 (77.9) | 115 (22.1) | Reference | Reference | ||||
| Yes | 175 (86.2) | 28 (13.8) | 0.563 | (0.359-0.883) | 0.012 | 0.419 | (0.248-0.708) | |
| Vaccines in our health facilities are safe | 0.001 | |||||||
Table 6 shows factors associated with COVID-19 vaccine acceptance among participants in northern Uganda. Participants who disagree that vaccines in health facilities in northern Uganda were safe, aOR=1.98,95% CI:1.01-3.89; p=0.046 and participants who strongly disagree that vaccines in health facilities in northern Uganda were safe aOR=3.31,95% CI:1.49-7.36; p=0.003 compared to those who strongly agree; participants from Gulu district aOR=5.19,95% CI:1.71-15.80; p=0.004; Kitgum district aOR=6.05,95% CI:1.76-20.80; p=0.004; Pader district aOR=3.45,95% CI:1.07-11.14; p=0.038 compared to Lamwo district, smokers aOR=7.75,95% CI:2.06-29.23; p=0.002 compared to non-smokers; females aOR=1.95,95% CI:1.04-2.42; p=0.032 compared to males; Baganda tribe aOR=5.19,95% CI:1.71-15.80; p=0.004; and Other tribes (Alur, Basoga, Banyoro) aOR=6.05,95% CI:1.76-20.80; p=0.004 compared to Itesot; and non-health-workers aOR=1.74,95% CI:1.03-2.96; p=0.040 compared to health workers. However, participants with comorbidities aOR=0.42,95% CI:0.24-0.71; p=0.001 were less likely to accept COVID-19 vaccines than those who did not have; Graduates were less likely to accept COVID-19 vaccines aOR=0.42,95% CI:0.18-0.99; p=0.049 than participants with primary education; and age-group of 20-29 years aOR=0.52,95% CI:0.31-0.86; p=0.011 than 30-39 year age-group.
| Strongly Agree | 108 (83.7) | 21 (16.3) | Reference | Reference | ||||
| Agree | 216 (86.4) | 34 (13.6) | 0.810 | (0.448-1.462) | 0.483 | 0.824 | (0.436-1.558) | 0.552 |
| Neutral | 146 (81.8) | 34 (18.9) | 1.198 | (.658-2.178) | 0.555 | 1.060 | (0.552-2.038) | 0.86 |
| Disagree | 77 (68.1) | 36 (31.9) | 2.404 | (1.303-4.436) | 0.005 | 1.984 | (1.011-3.894) | 0.046 |
| Strongly Disagree | 33 (64.7) | 18 (35.3) | 2.805 | (1.338-5.882) | 0.006 | 3.308 | (1.487-7.360) | 0.003 |
IV. DISCUSSION
The most significant finding from this study population (Table 1, Figure 1, Figure 2) was that COVID-19 vaccine acceptance in northern Uganda was high at 580/723 (80.2%, 95% CI:78.9%-83.4%). This finding contrasts with a study by Kabagenyi et al, in Uganda (2022) which observed a low COVID-19 vaccine acceptance at 41.4% [24]. However, that study noted substantial regional variations in vaccine hesitancy where a lower COVID-19 vaccine hesitancy was observed in participants from northern and eastern Uganda compared to western and central Uganda [24], a finding which is like our study findings (Table 2, Table 3, Table 4, Table 5). The authors argued that the lower vaccine hesitancy in northern Ugandan population compared to central and western Uganda was due to prior Ugandan Ministry of Health mobilization and roll out of information on COVID-19 vaccines, dispelling misconceptions, myths, and conspiracy theories about COVID-19 vaccines and thus the higher vaccine acceptance rate [24].
Thus, the high COVID-19 vaccine acceptance rate is likely because of the commendable work of health managers in northern Uganda for conducting consistent community sensitization, mobilization, and engagements using village health teams (VHTs), which helped turn a vaccine-hesitant/inquisitive population to the opposite. This finding is consistent with others that stakeholder engagement, social mobilization, and equitable distribution of vaccines increase vaccine acceptance in low-to-middle-income countries . Accordingly, we, the authors propose that the approach used to achieve this high COVID-19 vaccine acceptance rate in northern Uganda could be replicated in other parts of Uganda, especially using VHTs as agents of change.
The current study's finding that female gender was significantly associated with COVID-19 vaccine acceptance is not new (females 77.8% versus males 82.2%) (Table 6) but contrasts another observed in Kabagenyi, et al., (aOR=0.77,95% CI:0.58-1.02) in Uganda [24] but consistent with other studies elsewhere [28,29].
For example, high COVID-19 vaccine acceptance rates were recorded among pregnant women in northwestern Ethiopia [28] and Saudi Arabia [29].
Relatedly, many studies in Uganda show that females have better health-seeking behaviors than males . Females' better health-seeking behaviors than males have been similarly observed during implementation of many health activities among communities in northern Uganda . In addition, experience from Uganda shows that females are more receptive to health messages from Ugandan government and have always been at the forefront of fighting against many infectious diseases, including malaria . Thus, their compliance with health messages from the Ugandan Ministry of Health has always been positive. This experience includes reproductive health services, vaccination of children, voluntary counseling, and testing (VCT) for HIV and AIDs, cancer screening, and many health prevention and promotion activities .
However, a systematic review and meta-analysis by Stephanie showed that males had more likely intentions of getting vaccinated against COVID-19 than females . In contrast, our current study showed that it was more likely for females to accept COVID-19 vaccines than males (Table 6). This finding is likely because of disinformation, misinformation, and numerous conspiracy theories circulating in the community through social and other media sources about COVID-19 vaccines that may have affected males more than females but also highlights deeper problems on health seeking behaviors among males in northern Uganda. For similar reasons, non-health workers were more likely to accept COVID-19 vaccines compared to health workers and this is consistent with the findings from Amuru district in Uganda , sub-Saharan Africa and Kuwait and Jordan . Furthermore, the Baganda tribe who were resident in northern Uganda were more likely to accept COVID-19 vaccines (89.8% versus 10.2%) (Table 6) due to the fear of death, experience of suffering from the illness and caring for loved ones during the second wave of COVID-19 that was more severe in central Uganda where the majority tribe are
Baganda compared to the north (Table 2 and Table 3). It is also important to note that participants in our study raised many issues regarding the reasons for accepting COVID-19 vaccines ranging from the fear of death, the fear of contracting the virus and infecting family members. We, the authors argue that the fear factor and experience of COVID-19 during the second wave may have in many ways contributed to the vaccine acceptance among this sector of the study population (Table 2 and Table 3).
Also, our study found that participants with comorbidities were less likely to accept COVID-19 vaccines than those without (86.2% versus 77.9%, aOR=0.50, 95% CI:0.30-0.82; p=0.006); age-group of 20-29 years were less likely to accept COVID-19 vaccines (81.7% versus 18.3%, aOR=0.52, 95% CI:0.31-0.86; p=0.011) than 30-39 year age-group, and graduates were less likely to accept the vaccine (87.5% versus 12.5%, aOR=0.42,95% CI:0.18-0.99; p=0.049) than participants with primary level of education (Table 6). This finding among persons with comorbidities is inconsistent with many studies in Uganda, which showed participants with comorbidities, particularly diabetes, hyper tension, obesity, heart diseases, chronic obstructive pulmonary diseases (COPD), HIV, and AIDS, were more at risk of developing severe COVID-19 illness, and higher chances of hospitalization, and death [35-40].
Note that despite persistent messages on the increased risks and susceptibility to coronavirus, with higher chances of acquiring the more severe form of the disease, higher chances of hospitalization, and death among the most at-risk population which the mainstream and social media had widely covered and that most people had become aware, the COVID-19 vaccine acceptance was less likely in participants with comorbidity in our study population (Table 6). In addition, the Ugandan Ministry of Health had prioritized vaccination of the elderly and those with comorbidities in the early phases of COVID-19 vaccine roll-out in Uganda [36].
Of special interest was a finding in Kabagambe, et al., that a significant proportion of Ugandan population had misconceptions that COVID-19 vaccines could spread coronavirus in the body, that the virus kills people with underlying conditions, and that the COVID-19 vaccine could make them infertile . In addition, others doubted the existence of the virus and the safety of the vaccine itself . This information could have likely been responsible in part for the COVID-19 vaccine hesitancy among the comorbid population, age-group of 20-29 years, and graduates in our study (Table 6).
Meanwhile, in other participants in this study population, COVID-19 vaccine acceptance was high for many reasons, including the fear of getting infected, the fear of infecting family members, the fear of death, and worries that COVID-19 medications would be forced on them if they did not get vaccinated (Table 3 and Table 4).
Most notable was, however that the COVID-19 vaccine preferred by each participant in our study population was provided by the Government of Uganda through the Ministry of Health, and choices on the type of COVID-19 vaccine were participant's decision (Table 5).
Furthermore, some participants and their associates had tested positive for coronavirus and had experienced the disease, which perhaps impacted their decision to get vaccinated (Table 2, Table 3, and Table 4). So, we, the authors argue that whereas COVID-19 vaccination was a timely intervention by the Ugandan Ministry of Health, participants with comorbidities were less likely to accept COVID-19 vaccines (Table 6). Could they have been adversely affected by misinformation and disinformation on COVID-19 vaccines that hard-pressed them to refuse COVID-19 vaccines? The authors suggest that, in the future, a comprehensive study particularly a qualitative study should be conducted to assess in detail the reasons why participants with comorbidities, graduates, and age-group of 20-29 years hesitated to take COVID-19 vaccines.
Likewise, COVID-19 vaccine acceptance was more likely among participants from Gulu, Kitgum, and Pader districts, smokers, non-health workers, females, those who disagree and strongly disagree that vaccines in health facilities in northern Uganda were safe compared to participants who strongly agree (Table 6).
Participants from districts of Gulu 276/364 (75.8%), Kitgum 41/57 (71.9%), and Pader 108/132 (81.8%) were more likely to accept COVID-19 vaccines compared to Lamwo district (Table 6). On this finding, studies show that vaccine acceptance is linked to community's confidence in healthcare systems, health workers, cultural backgrounds, attitudes, beliefs, perceptions, political, environmental, personal factors, and compliance with face mask-wearing guidelines [11,41,42,43].
We, the authors, found that the three districts, just like others in Uganda, set up COVID-19 district task forces layered to the village health teams (VHTs) who promoted COVID-19 vaccinations at local levels . The village health teams are vital in connecting communities to the Ugandan healthcare system . We, the Authors, argue that VHTs' roles in disease prevention, promotion and control in Ugandan healthcare system need to be rated more by policymakers.
Nevertheless, VHTs are critical change agents, and their position in Ugandan health delivery system should be promoted to enhance their contributions to the healthcare system . This finding implies that for the Ugandan Ministry of Health to achieve higher COVID-19 vaccine acceptance rates, layered task forces up to the village level and using VHTs for campaigns could be adopted . The authors argue that VHTs played a considerable role in convincing the community to accept COVID-19 vaccines in the three districts .
Further, the finding that smokers in this study population were more likely to accept COVID-19 vaccines than non-smokers and ex-smokers have attracted much interest (Table 6). These participants could have been more confident in COVID-19 vaccines' ability to reduce the virus's chances of infecting them. More so, this virus being a respiratory disease could have swayed them by the fear factor and worries about getting infected or being forced to take medications if they missed out on their COVID-19 jabs (Table 3).
This finding is like one in a refugee camp in Bidibidi in Uganda where the authors found that COVID-19 vaccine acceptance rate among refugees was 78% and was associated with beliefs that COVID-19 vaccines could stop the spread of coronavirus [45] as similarly seen in these groups of smokers (Table 6). In addition, findings show that respondents who were uncertain whether COVID-19 vaccines would stop transmissions were less likely to get the vaccine (aOR=0.70; 95%CI=0.51-0.96) than confident respondents. In that study, respondents who did not want to go to health facilities (aOR=0.61;95%CI=0.44-0.84) were also less likely to accept COVID-19 vaccines than counterparts who wanted to go to health facilities [45].
Lastly, our finding that participants that strongly disagree and disagree on the safety of vaccines in health facilities in northern Uganda were three and two times more likely to accept COVID-19 vaccines compared to participants who strongly agree, respectively, raised our interests (Table 6). This finding is unique as most previous studies show that the confidence and trust in healthcare systems were among the most likely reasons for vaccine acceptance [6,14,15,41-43]. We, the authors, intend to explore these responses from our participants in a future qualitative study. Could it have been that this finding was an isolated response or specifically seen with COVID-19 vaccines in northern Uganda? We, the authors argue that it may be too early to determine what exactly it is until a comprehensive analysis has been completed in future studies.
In summary, our current study found a high COVID-19 vaccine acceptance rate of 580/723(80.2%) in an adult population in northern Uganda. This survey was conducted after the second wave of COVID-19 in Uganda when many high-profile persons had lost their lives compared to the first wave. In addition, this current acceptance rate in northern Uganda was lower than a South African study at 90% [15] but higher than a Somali study at 77% [16] and another Ugandan study at 60% [8]. Whether the high burden of COVID-19 in South Africa could have contributed to the substantially higher vaccine acceptance rate will be reviewed in future studies.
Therefore, we, the authors propose that the most effective strategy for reducing COVID-19 vaccine hesitancy in the Ugandan setting should include educating the population on COVID-19 and vaccines. The authors propose that educating people through a community engagement strategy is the most optimum way of dispelling myths, misconceptions, rumors, conspiracy theories, and fears about coronavirus. Thus, we propose that encouraging healthy behaviors towards coronavirus will keep Ugandans safe, a virus that has ravaged the world so much.
Finally, findings from other Ugandan studies indicate a high COVID-19 vaccine hesitancy in the general population. However, our findings are inconsistent with theirs and have a higher COVID-19 vaccine acceptance rate. Therefore, we, the authors, question and continue to ask more questions whether the suspected high COVID-19 vaccine hesitancy among the Ugandan population could have been a vaccine inquisitiveness rather than vaccine hesitancy. The higher COVID-19 vaccine acceptance among this study population in northern Uganda compared to others favors the understanding that the situation was more of COVID-19 vaccine inquisitiveness rather than COVID-19 vaccine hesitancy.
4.1 Strengths and Limitations of this Study
Our study has many strengths. First, this data is vital as it is one of the few well-documented and completed data on 723 participants from the Acholi sub-region regarding COVID-19 vaccine acceptance in the recent period. Second, findings from this study show a higher COVID-19 vaccine acceptance rate despite differing results from other parts of Uganda. Third, we used a systematic sampling method, a probability sampling method which is vital for the study's results. Finally, using a validated questionnaire helped us obtain this information which is generalizable in the context.
However, this study had limitations in the design, a cross-sectional study where one-time information from participants is gathered and analyzed. These have shortcomings in that, views and opinions of participants are dynamic; they vary according to prevailing environmental situations. In this, we suggest a need for future prospective or a longitudinal assessment of COVID-19 vaccine acceptance in future, ensuring that all data are measured and recorded accordingly.
4.2 Generalizability of Results
These findings should be cautiously interpreted and generalized to regions with low-resource settings in Uganda and other sub-Saharan African countries.
V. CONCLUSION
COVID-19 vaccine acceptance rate among the study population was encouragingly high despite misinformation and disinformation in Ugandan media. Participants were more likely to accept COVID-19 vaccines among those who strongly disagree and disagree that vaccines in northern Uganda's health facilities were safe than those who strongly agree; smokers compared to non-smokers, and participants from Gulu, Kitgum, and Pader districts compared to Lamwo district. However, it was less likely for participants with comorbidities to accept COVID-19 vaccines compared to participants without comorbidities. The fear of contracting coronavirus and death if not vaccinated contributed substantially to COVID-19 vaccine acceptance in northern Uganda. There is a need for health managers to engage, sensitize and mobilize the population on COVID-19 vaccines and vaccination using VHTs and other structures, which remain critically important if the high COVID-19 vaccine acceptance rate in the subregion is maintained or improved.
5.1 Statements and Declarations
Ethics approval and consent to participate
The St. Mary's Lacor Hospital Institutional, Review and Ethics Committee approved this study (LHIREC No. 0193/10/2021). In addition, the study was conducted following relevant institutional guidelines and regulations. Each study participant consented to the study.
Availability of data and materials
Competing interests: All authors declare no conflict of interest.
Funding: All funds for this study were contributions from individual research members of the Uganda Medical Association (UMA) Acholi branch.
Authors' contributions: This study was designed by DLK, JNO, JA, SB, PA, and FWDO. JA, JNO, PA, FWDO, and DLK supervised data collection. ENI and DLK conducted data analysis and interpretation. SB, CO, PA, NOA, DA, JNO, DO, POO, SGO, FPP, ENI, FWDO, JA, and DLK wrote and revised the manuscript. All Authors approved the manuscript and attested they met the ICMJE criteria for authorship.
ACKNOWLEDGMENT
We acknowledge with many thanks the assistance from the administration of health facilities for the information obtained. Financial support from UMA Acholi branch members, which enabled the team to conduct this study successfully, is most appreciated.
Conflict of Interest
The authors declare no conflict of interest.
Ethical Approval
Not applicable
Data Availability
The datasets used in this study are openly available at [repository link] and the source code is available on GitHub at [GitHub link].
Funding
This work did not receive any external funding.
References
Cite this article
Related Research


Special Issue
Launch a focused special issue to highlight research, emerging trends, and expert insights in your academic field.
