




IntelliPaper
Abstract
3-D seismic attribute analysis and reservoir pore-fill characterization was carried out in an X-field in the Niger Delta petroleum province Nigeria. The main objective of the study was to establish a relationship between selected seismic attributes and reservoir fluid types in the X-field, and then erect a model for reservoir pore-fill interpretation using the selected seismic attributes. To achieve the above objective, data which include: 3-D seismic sections, seismic attribute maps (amplitude, frequency, phase and polarity) of a selected horizon (M10) and digital well logs were compiled, and an integrated analysis finally performed on the data set. It was observed that seismic reflection polarity values above 4,574 were seen to be indicative of good reservoir sands while values less than -3,520 were seen to represent shale with good sealing capacity. Amplitudes less than 13,480 signified an unfavourable event while values between 13,840 and 17,789 were indicative of oil, and all true amplitude greater than 19,764 represented gas. Frequencies between 18.6 – 17.9 Hz were seen to represent oil and those below 17.0 Hz corresponded to gas. Finally, the reservoir pore-fills in the chosen horizon (M10) was interpreted to be gas around well (7) and the western limits of the horizon, and oil around well (4). In conclusion, the above results were integrated to erect a pre drilling guide for reservoir pore-fill interpretation from seismic attribute analysis of 3D seismic data volume in the X -field.
Explore Digital Article Text
I. INTRODUCTION
According to Kearey and Brooks (1991), "the ability to identify sedimentary environments and predict litho facies from analysis of seismic sections can be of great value to exploration programs, providing a pointer to potential source rocks". The above quote is of exploration significance in locating reservoir and seal rocks, but for the purpose of estimating the hydrocarbon in place and perhaps carrying out production optimization plans; not only will the reservoir engineer be interested in variables such as the reservoir structural/stratigraphic frameworks, petrophysical properties, temperature/pressure regimes but of major concern to him is the fluid type (oil and gas) in the pore spaces of the reservoir where production is intended. Looking at the reservoir without knowledge of the pore-fills is like viewing a container from the outside without knowledge of what is inside. Because wildcat drilling is capital intensive, a number of methods have been adopted with a view of providing a solution to the above problem, one of which is the 'bright spot' technology which allows hydrocarbon to be inferred directly from 'true amplitude seismic sections' by the use of Direct Hydrocarbon Indicators (DHI). These high amplitude events are attributable to the large reflection coefficient at the top and bottom of gas zones (typically gas filled sands) within a hydrocarbon reservoir (Sheriff, 1975; Sheriff, 1978). Since well-logs, which contain a whole lot of information, are considered one dimensional in comparison to the areal extent of a typical hydrocarbon field; 3-D seismic on the other hand provides information about the second and third dimensions of the subsurface lithology, structures and the associated fluids in a field (Sheriff & Geldart, 1995). Much valuable information is contained in the 'True' amplitude seismic section; any lateral change in reflection amplitude is due to lateral changes in the lithology of the rock unit or its fluid content. The same can be said of the other attributes (Meckel & Nath, 1977; Sheriff, 1980; Chao et al., 2009; Sheriff & Geldart 1995). Seismic attributes are characteristic parameters extracted from seismic traces through given mathematical methods, they have the ability to reflect intrinsic characteristic of seismic information from various angles depending on the type of attributes and the aim/manner in which they are computed (Chao, et al., 2009; Yao & Chopra, 2000). Seismic attribute studies have a theoretical foundation from complex trace analysis commonly used in electrical engineering and signal processing (Gabor, 1946; Bracewell, 1978; Cramer et al., 1967; Oppenheim & Schafer, 1975; Robertson et., al, 1988). In seismic data processing and interpretation; the term complex seismic trace was used to describe a seismic wave function made of a 'Real' and an 'Imaginary or complex' parts. The seismic trace from the surface seismic survey is treated as the 'real' part of the complex trace, while the 'imaginary' part is the Hilbert transform of the 'real' part. Such a representation allows for an easy and natural way of separating the seismic reflection amplitude (length of phasor) from the reflection 'angle' (which defines frequency and phase) making possible the computation of instantaneous attributes (Tarner et al., 1979; Barns, 1991; Bodine, 1984; Brown, 1996). "When evaluated and sampled using appropriate time windows, the envelope of instantaneous amplitude combined with instantaneous frequency and phase improves resolution, hence seismic events from reservoirs are more clearly defined" (Zang & Bentley, 2008). The following are some recent work in the study area: Obiekezie and Omoja (2019) used seismic attribute analysis to delineate hydrocarbon prospective zones in parts of the on-shore Niger delta "Uzot-Field" where the aim was to identify faults, seals and roll-over anticlines; Root Mean Square (RMS) amplitude was employed in the identification of targets. Also, reservoir prediction and prospect identification studies were carried out using seismic attribute analysis in 'OK-Field' of the Niger Delta. Instantaneous amplitude aided identification of fluid contacts by the application of 'bright' and 'dim' spots technology (Ologe & Olowokere, 2021). Again, Opara and Osaki (2018) exemplified the viability of integrating structural interpretations, petrophysical evaluation and seismic attribute analysis in evaluating the hydrocarbon potential of 'Opu-Field' in the coastal swamp Niger Delta depobelt. The major attributes considered were root mean square amplitude and instantaneous frequency. Augustine et., al (2021) has combined structural/stratigraphic interpretations and seismic attribute analysis to assess the sealing capacity of growth faults in a section of the Niger delta. Though the 'variance' attribute was used to infer structural zones from the seismic section, it was not directly employed as a quantitative fluid interpretation parameter. Also, in the Baris Oil and Gas field of the Niger delta, well-log derived estimates of porosity, permeability and fluid saturation from subsurface data were used for the petrophysical evaluation of reservoirs on one hand. On the other hand, information about the reservoir geometry, trends and extent of associated listric faults were derived from seismic data (Bate et al., 2023). Furthermore, in the reservoir characterization of the Otan-Ile section of the Niger delta oil field; qualitative use of seismic amplitude attribute was used to reconfirmed the presence of hydrocarbon by superimposing the former on a depth structure map (Tokunbo et., al, 2021). But the current study is focused on the use of seismic attribute analysis to discriminate among reservoir fluids (oil, water and gas) both qualitatively and quantitatively before drilling.
II. THEORETICAL BACKGROUND
The phasor representation of the complex seismic trace is given by the equation:
Where
: the complex seismic trace function
: the amplitude of the complex seismic trace (length of phasor)
: Stands for frequency and phase (angle of phasor).
From equation (1) above, the complex seismic trace is made up of real and imaginary parts; the real part is the actual surface seismic recorded signals obtained from geophones, and is given by:
Where and are the respective functions of the amplitude and phase of the complex seismic trace.
The complex seismic trace, otherwise called the 'quadrature' of the 'real trace' is the rotation of the real trace calculated using the Hilbert transform in a 3-D plot (Bentley et al., 1999; Bracewell, 1978; Taner et al., 1979)
Equation (2) is realizable from equation (1) by digitization using appropriate time window, and its Hilbert transform is derived according to the following steps:
1. phase shifting of the real component f(t)
2. performing an inverse Fourier transform on
The result from this process is the negative of the Hilbert transform and equation (1) can now be written as:
Where represents the Hilbert transform of and
: a helical function that spirals about the time axis.
The amplitude or 'true amplitude' is the maximum absolute amplitude for all 'phase' rotations at a given time sample, it corresponds to the envelope of the complex seismic trace mathematically given by;
Where;
/C(t)/: is the true amplitude
and : are the amplitudes of the real and imaginary traces of at time 't' respectively.
The instantaneous phase is the time-by-time sample phase value of the complex seismic trace envelope given by;
θ: is the instantaneous phase;
: are the amplitudes of the real and imaginary traces
We define instantaneous frequency as the time derivative of instantaneous phase or a measure of how quickly or slowly phase changes as a function of time, which is not to be confused with Fourier transform frequencies (the bandwidth of the inherent wave form). Therefore;
When phase is given by , representing a combination of angle and frequency, then the frequency is found by evaluating the time derivative of .
represents angular frequency while is a phase determining constant.
Equation (7) is the normal definition of frequency.
Polarity on the other hand, is identified as the sign (whether positive or negative) of the seismic trace amplitude which is determined by the directional variation of acoustic impedance in sedimentary strata.
III. MATERIAL AND METHOD
The following data sets were used:
-
A 3-D polarity display seismic section of an X- field in the Niger Delta oil province complimented with wire-line log data from three Wells.
-
Point shot (T-Z) data for the 3 Wells.
-
Base maps.
-
Digital well-logs comprising of gamma-ray, resistivity, sonic and density logs enhanced with porosity and water/hydrocarbon saturations information
-
Seismic reflection amplitude, frequency and phase data for the chosen horizon.
-
Attribute maps and sections (amplitude, frequency and phase).
-
Reflection time data for the chosen horizon pseudo named M10.
The method adopted involved the use of in-lines and cross-lines (bines and stacks) to map the horizon of interest across the field, and posting reflection times at the top and bottom of the reservoir (horizon M10) to their corresponding seismic grids. Using the t-z function, time-depth conversions were done and the resulting depth tied to bore-hole data at the various Wells. On the base map/ seismic reflection data, the positions of the 3 Wells were identified and a vertical slice/section was cut through the wells to enhance display of field data at the various Well locations on a single time axis. The four seismic attributes considered in this study were amplitude, frequency, phase and polarity. A quantitative and qualitative analysis of each seismic attribute was done in the presence of the associated reservoir fluid to reveal its responses/changes as influenced by the three different reservoir fluids (oil, water or gas). The observed seismic attribute responses at the horizon of interest (M10) were displayed as tables and maps.
IV. RESULTS
Interpretation of abbreviations as used in the result tables: CALP: Calliper log FDC: Compensated density log RT: Resistivity log GR: Gamma ray log POR: Porosity SH: Hydrocarbon saturation SW: Water saturation
Table 1: Digital Well-Log Extracts and Fluid Interpretation of Horizon M10 Well-7
| Depth (ft) | CALP | FDC (g/cc) | RT (Ωm) | GR (API) | POR | SH | SW | REMARKS |
| 5.174.5 | 11.91 | 2.250 | 1.976 | 85.20 | 0.207 | 0.154 | 0.947 | shaly sst/HC |
| 5.176.5 | 11.91 | 2.210 | 1.930 | 92.39 | 0.194 | 0.118 | 0.882 | Shaly sst/HC |
| 5.180.5 | 11.56 | 2.290 | 2.506 | 89.99 | 0.199 | 0.180 | 0.820 | Shaly sst/HC |
| 5.182 | 11.77 | 2.250 | 2.146 | 91.08 | 0.197 | 0.188 | 0.812 | Shaly sst/HC |
| 5.184 | 11.76 | 2.250 | 2.159 | 86.08 | 0.206 | 0.205 | 0.795 | Shaly sst/HC |
| 5.186.5 | 11.72 | 2.240 | 2.172 | 87.72 | 0.203 | 0.204 | 0.796 | Shaly sst/HC |
| 5.190 | 11.96 | 2.270 | 2.028 | 90.27 | 0.198 | 0.156 | 0.844 | Shaly sst/HC |
| 5.192.5 | 11.62 | 2.340 | 2.834 | 74.94 | 0.225 | 0.364 | 0.636 | Shaly sst/HC |
| 5.194 | 11.12 | 2.090 | 5.089 | 50.757 | 0.268 | 0.570 | 0.430 | ? |
| 5.195.5 | 12.28 | 2.090 | 27.280 | 29.262 | 0.307 | 0.807 | 0.193 | ? |
| 5.197.5 | 12.26 | 2.110 | 153.66 | 27.57 | 0.310 | 0.926 | 0.074 | sst/GAS |
| 5.230.5 | 12.54 | 2.160 | 286.52 | 30.95 | 0.304 | 0.963 | 0.037 | sst/GAS |
| 5.240.5 | 14.18 | 2.080 | 105.12 | 31.49 | 0.302 | 0.927 | 0.073 | sst/GAS |
| 5.247 | 16.98 | 1.900 | 499.66 | 22.32 | 0.319 | 0.964 | 0.036 | sst/GAS |
| 5.260.5 | 15.86 | 1.930 | 980.48 | 26.37 | 0.312 | 0.974 | 0.026 | sst/GAS |
| 5.263.5 | 11.05 | 2.090 | 1959.6 | 23.29 | 0.318 | 0.983 | 0.017 | sst/GAS |
| 5.270 | 10.67 | 2.080 | 2276.8 | 19.37 | 0.324 | 0.986 | 0.014 | sst/GAS |
| 5.329.5 | 11.87 | 2.290 | 1.589 | 88.22 | 0.200 | 0.000 | 1.000 | Shale/water |
Note: In the above interpretation; "shale/water" is used to denote a water-filled porosity while "shaly sst/HC" stands for shaly sandstone having porosity filled with both hydrocarbon and water.?? Stands for undefined fluid interpretation
Table 2: Digital Well-Log and Fluid Interpretation for Horizon M10 Well-4
| DEPTH (ft) | SONIC (Δt) | CAL P | G.R (API) | SH | POR | SW | BLK.D g/cc | RT (Ωm) | REMARK |
| 5,099 | 136 | 11.6 | 100 | 0.000 | 0.21 | 1.000 | 2.398 | 1.439 | Shale/w |
| 5,100 | 130 | 11.0 | 111 | 0.000 | 0.15 | 1.000 | 2.449 | 1.378 | Shale/w |
| 5,109.5 | 111 | 10.1 | 42 | 0.000 | 0.26 | 1.000 | 2.149 | 1.628 | Shale/w |
| 5,113 | 119.2 | 9.2 | 38 | 0.658 | 0.24 | 0.342 | 2.132 | 10.56 | Oil |
| 5,116.0 | 119.9 | 9.2 | 37 | 0.908 | 0.23 | 0.092 | 2.129 | 49.89 | Oil |
| 5,129.5 | 120.8 | 9.2 | 39 | 0.954 | 0.22 | 0.046 | 2.136 | 93.82 | Oil |
| 5,130 | 121.2 | 9.0 | 44 | 0.956 | 0.29 | 0.044 | 2.161 | 305.8 | Oil |
| 5,162 | 120.9 | 9.0 | 42 | 0.905 | 0.26 | 0.095 | 2.152 | 121.5 | Oil |
| 5,166.5 | 120.9 | 9.0 | 42 | 0.855 | 0.25 | 0.145 | 2.152 | 62.88 | Oil |
| 5,173 | 124.5 | 9.1 | 44 | 0.922 | 0.23 | 0.078 | 2.161 | 64.80 | Oil |
| 5,180 | 124.9 | 9.2 | 48 | 0.987 | 0.24 | 0.013 | 2.177 | 98.6 | Oil |
| 5,190 | 124.4 | 9.2 | 47 | 0.897 | 0.25 | 0.013 | 2.174 | 90.8 | Oil |
| 5,197.5 | 121.2 | 9.2 | 49 | 0.907 | 0.24 | 0.093 | 2.197 | 77.11 | Oil |
| 5,227.5 | 115.7 | 9.2 | 57 | 0.673 | 0.21 | 0.327 | 2.216 | 9.73 | H.C silt |
| 5,390 | 115.7 | 9.5 | 87 | 0.694 | 0.15 | 0.306 | 2.345 | 9.77 | H.C silt |
Table 3: Summarized Attribute Logs for Wells-7 and 4
| WELL-7 | WELL-4 | |||||||
| Amplt. | Freq(Hz) | Phas/am plt | Depth(ft) | Amplt. | Freq(Hz) | Phas/amplt | ||
| 19,764 | 15.7 | 0.19 | 1,540 | 15,841 | 17.8 | -0.07 | ||
| 19,764 | 15.7 | 0.21 | 1,550 | 17,789 | 23.8 | -0.07 | ||
| 20,751 | 16.5 | 0.22 | 1,560 | 17,789 | 17.9 | -0.09 | ||
| 22,726 | 16.8 | 0.21 | 1,570 | 16,802 | 18.1 | -0.07 | ||
| 19,764 | 17.0 | 0.20 | 1,580 | 14,827 | 18.9 | -0.05 | ||
| 11,865 | 23.8 | 0.07 | 1,590 | 13,840 | 18.6 | -0.07 | ||
| 1,600 | - | 23.0 | -0.34 | |||||
| 1,620 | 7,916 | -0.34 | ||||||
Table 4: Seismic Attributes and Fluid Interpretation Correlation Table for Well-7
| DEPTH (ft) | DEPTH (m) | SEISMIC ATTRIBUTES | FLUID TYPE | ||
| AMPLT | FREQ | PHASE/AMPLT | |||
| 5,164.5 | 1,570 | 19,764 | 15.7 | 0.19 | GAS |
| 5,197.0 | 1,580 | 19,764 | 15.7 | 0.21 | GAS |
| 5,230.0 | 1,590 | 20,751 | 16.5 | 0.22 | GAS |
| 5,247.0 | 1,595 | 22,726 | 16.8 | 0.21 | GAS |
| 5,263.0 | 1,600 | 19,764 | 17.0 | 0.20 | GAS |
| 5,329.0 | 1,620 | 11,865 | 23.8 | 0.77 | UN |
Table 5: Seismic Attributes and Fluid Interpretation Table for Well-4
| DEPTH (ft) | DEPTH (m) | SEISMIC ATTRIBUTES | FLUID TYPE | ||
| AMPLT | FREQ | PHASE/AMPLT. | |||
| 5,066 | 1,540 | 15,814 | 17.8 | 0.07 | - |
| 5,098 | 1,550 | 17,789 | 23.8 | -0.06 | UN |
| 5,131.5 | 1,560 | 17,789 | 17.9 | -0.09 | OIL |
| 5,164.5 | 1,570 | 16,802 | 18.1 | -0.07 | OIL |
| 5,197.0 | 1,580 | 14,827 | 18.9 | -0.05 | OIL |
| 5,230 | 1,590 | 13,840 | 18.6 | -0.07 | OIL |
| 5,263 | 1,600 | - | 23.0 | -0.34 | UN |
| 5,329 | 1,620 | 7,916 | - | -0.34 | UN |
V. DISCUSSION
Analysis of the seismic attributes/Well data tie (Table 3) showed that; in the vicinity of Well-7, 'true amplitude' values of 19,764 and 20,751 were observed at depths 5,164.5 ft (1,570 m) and 5,230 ft (1,590 m) respectively. The well-log interpretations confirmed this depth range of the reservoir to have a gas-filled porosity (Table 1). At depths 5,247 ft (1,595 m) and 5,263 ft (1,600 m), the observed amplitudes were 22,726 and 19,764 respectively; this depth range has also been interpreted to have a gas-filled porosity (Table 4). At a depth of 5,329 ft (1,620 m), an amplitude value of 11,865 was observed, but the well log interpretation sees this depth as unfavorable (neither oil nor gas). Frequency values of 15.7 Hz, 16.5 Hz, 16.8 Hz and 17.0 Hz were observed at depths of 5,197 ft (1,580 m), 5,230 ft (1,590 m), 5,247 ft (1,595 m) and 5,263 ft (1,600m) respectively; the quoted depth ranges yet again fell into a gas zone according to the well-log interpretations. Within the same depth range, phase amplitude values of between 0.9 and 0.22 were observed.
At Well-4, slightly different results were observed; a depth range of about 5,066 ft (1,540 m) to 5,098 ft (1,550 m) was interpreted as unfavorable (Table 2) with observed 'true amplitude' readings between 15,814 and 17,789 (Tables 3 and 5). The corresponding frequency values were found to be 17.8Hz and 23.8Hz respectively. Between depths 5,151.5 ft and 5,230 ft; the 'true amplitude' attribute values fell between 17,789 and 13,840 and the corresponding digitized frequency values were between (17.9 and 18.6) Hz. The reservoir pore-fill in this depth range was interpreted to be oil, whereas a 'true' seismic amplitude value of 7,916 was registered at depth 1,620 m, which was correlated to be unfavorable (Tables 3 and 5). A quantitative/qualitative comparison of the gamma-ray log/seismic attribute tie showed that events with very high positive polarity coincided with low gamma-ray signatures, depicting sand bodies (Table 1, 2 and 3). The positivity of the polarity is a function of the cleanness of the sand body, which was found to be in agreement with the well-log derived porosity estimates. On the other hand, negative polarities were seen to be associated with shale, the negativity of the polarity values indicated the degree of 'shaliness', and all high negative polarities were seen to be associated with good sealing shale at the top and bottom of reservoirs (Tables 1 and 3). Polarity values between (4,575–11,263) have been interpreted to represent sandstone while the value for shale stood between (-3,520—-11,264). Polarity values within the ranges quoted above were interpreted to be indicative of lithologic boundaries and fault zones. Figure (1) is a structural map showing the posted reservoir pore-fill interpretations derived from the integrated seismic attributes and well-log analysis; it could be seen that Well-7 is predominantly gas and Well-4 was found to be associated with oil, while Well-21 was interpreted to be unfavorable.
VI. CONCLUSION
It was concluded that the reservoir pore-fill of the X-field, with particular reference to horizon M10, could be interpreted from 3-D seismic data according to the model presented in Table (6), and the fluid interpretation is as shown in figure (1).
Table 6: 3-D Seismic Attribute Reservoir Pore-fill Interpretation Model for the X-Field
| SEISMIC ATTRIBUTES | RANGE OF VALUES | INFERENCE |
| Polarity | 4,575 – 11,263-3,520 – -11,264 | Sand stone shale |
| True amplitude | >19,76413,840 – 17,789<13,840 | GasOilunfavorable |
| Frequency | >20.018.6 – 17.9<17.0 | UnfavorableOilgas |
| Phase amplitude | continuity | continuity |
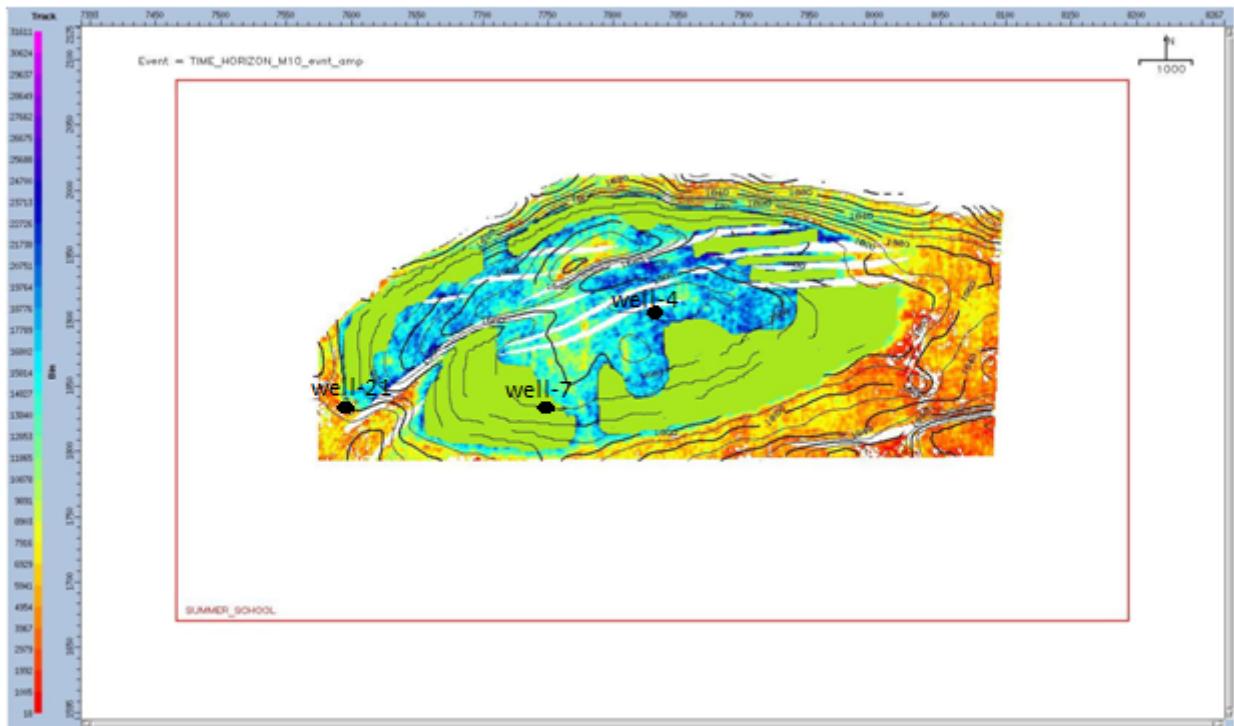 Figure 1: Structural Map Showing Integrated Well Log/Seismic Attribute Reservoir Pore-fill Interpretation of Horizon M10
 Legend
APPENDIX
Interpretation Workflow From Results
1. Start = input/load data
2. Display conventional seismic section
3. Display polarity seismic section
4. Pick event with polarity range (4,575–11,263)
5. Define event top and bottom using velocity information
6. Evaluate thickness of event by subtraction
7. Blow event to a workable size to enhance details
8. Compute and display true seismic amplitudes of events
9. Digitize true amplitudes of event
-
If true amplitude is greater than 19,764 then infer gas
-
If amplitude is less than 13,840 then output result as unfavorable
10. Compute and display frequency section of event
11. Digitize frequency of event
-
If digital frequency is greater than 2.0 then output result as unfavorable
-
If frequency is between 18.6 – 15.0Hz then infer oil
-
If frequency is less than 15.0Hz then infer gas
12. Integrate results and make final interpretation/ recommendation
- Tie result to spatial coordinates, post to seismic grids and save
14. End
Conflict of Interest
The authors declare no conflict of interest.
Ethical Approval
Not applicable
Data Availability
The datasets used in this study are openly available at [repository link] and the source code is available on GitHub at [GitHub link].
Funding
This work did not receive any external funding.
References
Cite this article
Related Research


Special Issue
Launch a focused special issue to highlight research, emerging trends, and expert insights in your academic field.
