


Abstract
Research Aims: This study examines the relationship between Zambia's national debt and its economic expansion. Specifically, it investigates how central government debt, foreign direct investment (FDI), total debt service, and gross capital formation influence real GDP per capita over the period 1990 to 2020.
Design/Methodology/Approach: An Autoregressive Distributed Lag (ARDL) model estimated using EViews statistical software was employed. Annual time series data spanning 1990–2020 were sourced from the World Development Indicators (WDI) database maintained by the World Bank. The model examines both short-run and long-run associations between the independent variables’ central government debt, FDI, total debt service, and gross capital formation and real GDP per capita.
Research Findings: In the short run, all four independent variables exert a statistically significant influence on real GDP per capita. A 1% increase in total debt service corresponds to a 0.33% rise in real GDP per capita; an increase in central government debt results in a slight decrease of 0.001%; FDI exhibits a positive impact with a 1% increase leading to a 0.02% increase; while gross capital formation has a negative effect, causing a 0.004% decline. In the long run, FDI and gross capital formation have a positive effect on economic growth, whereas total debt service and central government debt negatively impact growth—a 1% increase in central government debt corresponds to a 0.002% decrease in real GDP per capita.
Theoretical Contribution/Originality: This study contributes to the growing body of literature on sovereign debt and economic growth in Sub-Saharan Africa by applying an ARDL framework to three decades of Zambian data. The findings highlight the importance of cautious debt management and promotion of FDI for long-term economic development, providing policymakers with empirical evidence to inform sustainable fiscal strategies. The study provides original insights into the differential short-run and long-run effects of public debt components on economic performance in a heavily indebted developing country context.
Explore Digital Article Text
Introduction
The utilization of sovereign debt has become a crucial means of augmenting government expenditures. In situations where a government’s spending surpasses its revenue, borrowing is commonly employed to bridge the gap. Government borrowing can be employed to facilitate critical development projects necessary for attaining economic expansion. This type of debt is categorized as either domestic pertaining to loans provided within a nation or external, pertaining to loans granted by foreign nations. Although public debt is recognized as a catalyst for economic advancement, critical issues remain, including determining the safe level to which national debt can be permitted to increase and devising plans for repayment.
Recent data indicate that the accumulation of governmental debt has risen in both less developed countries (LDCs) and advanced economies over the last few decades (Yusuf & Mohd, 2021). Rising debt levels can be attributed to an uptick in government expenditures, escalation in public investments, or a decline in tax revenue. A moderate amount of debt can expedite economic growth when employed to aid the development of public infrastructure (Yusuf & Mohd, 2021). However, some governments resort to unrestrained credit uptake since it is difficult to identify an optimal debt threshold, resulting in substantial interest payments and a significant debt load that could adversely affect the economy, triggering excessive indebtedness (Joy & Panda, 2020).
Emerging economies can suffer severe ramifications from exorbitant debt volumes. Excessive debt not only hampers fiscal progress but also fuels uncertainty. The IMF emphasized the significance of keeping the debt-to-GDP ratio below 60% for both LDCs and developed economies. When this ratio reaches excessive levels, it can negatively affect stock markets, ultimately reducing enduring investment opportunities and prospects (Saungweme & Odhiambo, 2019).
Although borrowing can act as a catalyst for economic advancement, it can impede growth when it reaches excessive levels, as governments are obligated to make regular payments to service and settle obligations. These financial commitments reduce revenue and foreign reserves that could otherwise be utilized for alternative investment objectives. Public borrowing can generate enduring consequences throughout successive generations given the substantial tax responsibility needed to handle and resolve debt (Celestin, 2016). Consequently, using annual sequence data spanning 1990 to 2020, this research concentrates on how sovereign borrowing affects economic expansion in Zambia.
The issue of government borrowing is not a recent problem in Zambia and has persisted for several decades. In the 1980s, the country faced significant debt expenses, leading to economic sluggishness and widespread impoverishment (Debt Justice, 2022). Zambia’s debt burden began to decrease after 2005, when it attained Highly Indebted Poor Country (HIPC) criteria eligibility, which required a US$7 billion debt liability; the nation was able to eliminate US$4 billion of debt through HIPC (Debt Justice, 2022).
Although Zambia made progress in reducing its debt burden, the nation has experienced an increase in debt levels over the last 12 years. According to the World Development Indicators (WDI), public debt increased from ZMW16.84 billion to ZMW344.51 billion between 2010 and 2020, while debt service increased from 0.8% to 23.1% (World Bank Open Data, 2026). With a peak of USD 2.1 billion in 2013, FDI inflows declined from US$1.73 billion to US$172 million from 2010 to 2020 respectively (World Bank Open Data, 2026). This deterioration can be partly attributed to concerns about the country’s increasing debt burden and its ability to manage it effectively.
The impact of Zambia’s increasing debt burden extends beyond the economy alone. The country’s debt issues have also had social and political consequences, including widespread poverty and social unrest (Phiri et al., 2024). Furthermore, the increasing debt burden has led to concerns about the government’s capacity to allocate resources to essential areas like health and education, which are essential for sustainable development.
In the period under review, significant external factors that impacted Zambia’s economy were the 2008 economic downturn and the 2019 COVID-19 pandemic. The severe impact of COVID-19 resulted in a struggling Zambian economy and caused the country to become the first in Africa to default on amortization payments, leading to a downgrade in Fitch’s credit rating from CC to restricted default (RD) (Fitch, 2022). The default was specifically on three Eurobonds issued by the central government in 2012, 2014, and 2015, with valuations of US$750 million, US$1 billion, and US$1.25 billion respectively (Kalikeka et al., 2019).
Figure 1 illustrates a growing propensity of sovereign borrowing as a proportion of GDP from 2010 to 2020, exhibiting a continuous debt-to-GDP upsurge from 17.3% in 2010 to a ten-year high of 103.7% in 2020. According to Bank of Zambia (2021), in 2020, foreign debt amounted to 82.3% of GDP, up from 50.2% in the preceding year. The majority of debt was provided by international organizations, commercial banks, and export creditors (Bank of Zambia, 2020).
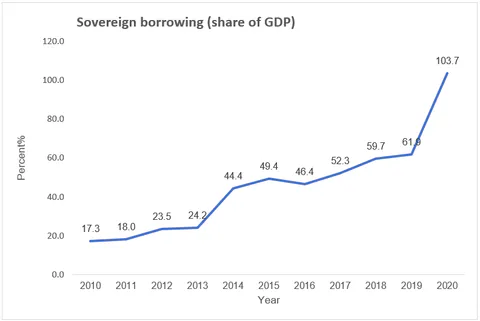
Zambia’s Sovereign Borrowing (2010–2020)
The Zambian government must take appropriate measures to manage its debt effectively. One approach would be to prioritize investment in sectors with the potential to generate significant economic benefits, such as agriculture, mining, and tourism. Additionally, the government should implement effective debt management policies, negotiate favorable terms with creditors, and work closely with global organizations such as the IMF and World Bank to develop sustainable debt management strategies. The previous government failed in its attempts to secure a debt bailout deal with the IMF. However, the current administration eventually secured the IMF Extended Credit Facility (ECF) deal following diligent efforts (IMF, 2022).
Literature Review
The studies by Thao (2018), Yusuf and Mohd (2021), Hilton (2021), and Chongo (2013) provide valuable insights exploring the influence of governmental borrowing on economic expansion and development. Utilization of different econometric models and data sources enhances the credibility of their findings and highlights the universality of the results.
Thao (2018) undertook an inquiry examining the affiliation between public debt and economic growth in six ASEAN countries (Indonesia, Malaysia, Philippines, Singapore, Thailand, and Vietnam) over the period 1995–2015. The analysis incorporated control variables including FDI, gross fixed capital formation, and the real effective exchange rate, employing General Method of Moments (GMM) estimation. The findings demonstrated a noteworthy and favorable influence of government debt on real GDP per capita growth in the ASEAN nations under study, with no detrimental effects of increased indebtedness on economic expansion discovered, challenging the conventional discourse regarding the negative consequences of government borrowing (Thao, 2018). The study proposes that the utilization of public debt to fund efficient public investments in the present phase of development facilitated long-term economic growth.
The research conducted by Yusuf and Mohd (2021) investigated the influence of government borrowing on Nigeria’s economic growth over the period 1980–2018, utilizing the Autoregressive Distributed Lag (ARDL) procedure. The outcomes suggest that although external debt acted as an obstacle to long-standing growth, its immediate impact enhances growth. Conversely, domestic debt exhibited a substantial constructive effect on long-standing growth, whereas its short-term effect was negative. Debt service payments in both immediate and extended timeframes resulted in a slowdown in growth, affirming the presence of the debt overhang phenomenon. The results suggest that authorities must redirect borrowed funds towards strengthening the productive economic base to enhance development, diversify the income base, and increase capacity to meet loan repayment obligations (Yusuf & Mohd, 2021).
Hilton’s (2021) investigation conducted in Ghana employed an ARDL Granger-causality model using yearly data from 1978 to 2018 to examine the causal connections between public debt and economic growth. The findings propose that in the short term, there is no causal relationship between public debt and GDP; however, in the long run, there is a unidirectional Granger causality from public debt to GDP (Hilton, 2021). Hilton’s (2021) study further reveals a negative bidirectional causal association between investment spending and GDP in the short term, while in the long term they exhibit a positive bidirectional causal relationship.
Using the Vector Error Correction Model (VECM), Chongo (2013) studied the effect of rising sovereign debt on economic development from 1980 to 2008 in Zambia. A long-term inverse correlation between government borrowing and economic growth was identified. Furthermore, the presence of crowding-out and debt overhang effects is suggested by the influence of private investments and domestic savings, attributable to an increasing debt burden measured by both the ratio of public debt to GDP and public debt service to revenues (Chongo, 2013). These findings justify concerns about debt sustainability in Zambia and suggest that the government should be cautious in its borrowing practices to avoid further constraints on private investment and economic advancement.
Conceptual Framework
Economic development is very broad and is affected by several interrelated aspects including inflation, unemployment, trade policies, and government regulations, among others. Therefore, the study’s concentration on a limited number of variables might not offer a comprehensive comprehension of all elements propelling economic growth. The study focused on public debt, debt service, FDI, and capital formation due to the limited amount of time available and insufficiency of data on omitted variables. While the study anticipates a constructive effect of capital formation and FDI on economic development, it is essential to note that additional influences such as the quality of institutions, technological advancements, and human capital play significant roles in determining economic growth. The conceptual framework (Figure 2) illustrates the relationship between the independent variables (central government debt, FDI, total debt service, and gross capital formation) and the dependent variable (real GDP per capita).
Methodology
Research Approach
A quantitative research approach was implemented to attain the predetermined objectives of this inquiry. The approach exclusively depends on numerical data to analyze the association between variables. A quantitative research approach is a scientific method used to measure and quantify variables using statistical analysis (Bell et al., 2022). This approach assumes that the world can be objectively observed and measured, and that numerical data can be used to identify patterns, trends, and relationships between variables (Creswell & Creswell, 2017). One of the advantages is that it allows for the objective measurement of variables, which can increase the reliability and validity of the data (Creswell & Creswell, 2017).
Research Design
The research relied exclusively on quantitative analysis techniques to investigate the particular phenomenon. A correlational analysis was utilized to assess the relationship that exists among variables and to establish the strength and direction of this relationship. In this study, correlational analysis was used to determine the relationship between central government debt and real GDP per capita, using statistical software such as EViews and Excel to calculate correlation coefficients.
Target Population
The target population consisted of time series data aggregated from 1990 to 2020, sourced from institutions such as the World Development Index (WDI), Central Statistics Office (CSO) of Zambia, Common Market for East and Southern Africa (COMESA), African Development Bank (AFDB) Socio Economic Database, and the Ministry of Finance. These institutions provide annual observations for all variables: Real GDP per capita, Public Debt, Total Debt Service, Gross Capital Formation, and FDI. The study thus aimed to investigate the relationship between the variables of interest over a period of 31 years.
Sample Size
The sample size consisted of 31 annual time series observations for all targeted variables gathered from 1990 to 2020, derived from the CSO and WDI by the World Bank. Missing observations were addressed using data portals of the Ministry of Finance and COMESA. The researcher also employed interpolation and extrapolation methods to fill in some missing observations. The use of a large sample size is important for ensuring the reliability and validity of the results, as it allows for greater statistical power and reduces the likelihood of sampling errors (Bryman & Bell, 2015).
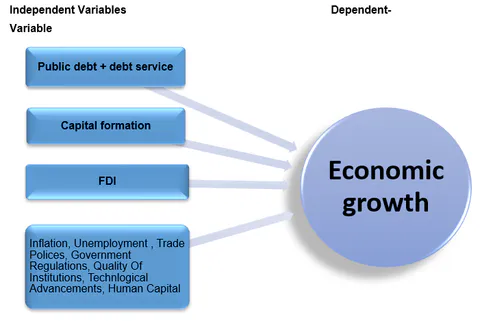
Conceptual Framework
Data Collection
This study relied on a combination of secondary data sources. The researcher used the CSO and the World Bank’s WDI as core data sources, with any missing data supplemented using COMSTAT and the Ministry of Finance. The World Development Indicators is a comprehensive database providing access to a wide range of socioeconomic indicators for nations worldwide, including Zambia. Data collection involved selecting specific indicators-Central Government Debt, Real GDP per capita, FDI, Total Debt Service, and Gross Capital Formation-for Zambia over the period 1990-2020. After downloading data in Excel format, necessary cleaning and pre-processing steps were completed to verify data quality, including reducing outliers, filling in missing values, and standardizing the data structure. The study also incorporated secondary sources such as journal papers, published textbooks, and national reports to supplement the core data analysis.
Model Specification
The research aimed at evaluating how government borrowing influences economic progress by expanding the economic growth function. The base model is specified as:
The ARDL model with error correction term is specified as:
The dependent variable is real GDP per capita (lnRGDPPC), serving as a proxy for economic expansion. The independent variables are: GCFGDP (gross capital formation as a proportion of GDP, indicating new capital investment internally), lnFDI (logarithm of FDI, indicating external capital influx), CGDGDP (central government debt as a proportion of GDP), and TDS (total debt service). The model was adopted because variables exhibit a combination of different orders of integration I(0) and I(1) series.
Data Analysis
To estimate the model accurately, the researcher employed inferential analysis through the OLS technique, implemented with the aid of EViews statistical software. Before estimation, the Augmented Dickey-Fuller (ADF) test for stationarity was conducted to prevent the possibility of nonsensical estimation outcomes arising from non-stationary data (Gujarati, 2004). Post-estimation tests including normality, autocorrelation, and heteroscedasticity tests were performed to test the reliability of the estimated model (Gujarati, 2004).
Results
Descriptive Statistics
Table [tab:descriptive-statistics] presents descriptive statistics for the variables included in this study, generated by EViews using data collected from WDI. The logarithm of real GDP per capita (lnRGDPPC) is the dependent variable. The independent variables are: TDS (total debt service), CGDGDP (central government debt as a proportion of GDP), LNFDI (logarithm of FDI), and GCFGDP (gross capital formation as a proportion of GDP).
| LNGDPPC | TDS | CGDGDP | LNFDI | GCFGDP | |
|---|---|---|---|---|---|
| Mean | 7.586391 | 15.93984 | 106.9725 | 19.71894 | 26.10022 |
| Median | 8.075804 | 14.82415 | 103.6982 | 19.69308 | 24.90835 |
| Maximum | 9.772935 | 46.87526 | 277.5303 | 21.46511 | 45.39847 |
| Minimum | 2.690939 | 1.858138 | 17.32151 | 17.35066 | 10.96267 |
| Std. Dev. | 1.912723 | 12.18957 | 64.53635 | 1.151400 | 11.03113 |
| Skewness | -0.942451 | 0.741789 | 0.639702 | -0.325581 | 0.389297 |
| Kurtosis | 3.131720 | 3.016794 | 3.097277 | 2.309829 | 1.858517 |
| Jarque-Bera | 4.611516 | 2.843327 | 2.126518 | 1.162948 | 2.466040 |
| Probability | 0.099683 | 0.241312 | 0.345329 | 0.559074 | 0.291411 |
| Observations | 31 | 31 | 31 | 31 | 31 |
Descriptive Statistics
Source: Generated by the researcher using EViews (2023).
The mean and median values of the dependent variable, lnRGDPPC, are 7.586391 and 8.075804, respectively, suggesting that the average and median values of real GDP per capita during the study period fall within a similar range. The maximum value of 9.772935 and minimum of 2.690939 indicate considerable disparity in real GDP per capita levels in Zambia throughout the study timeframe. The high standard deviations for TDS (12.19) and CGDGDP (64.54) suggest large variation in total debt service and central government debt during the period. The Jarque-Bera probability values ranging from 0.099 to 0.559 suggest that the null hypothesis of normality cannot be rejected for any variable at the 5% significance level.
Unit Root Tests
Table [tab:adf-unit-root-tests] presents unit root test results for all five variables, generated by EViews using the Augmented Dickey-Fuller (ADF) test. The ADF test is employed to determine the stationarity of time series variables. Stationary data exhibits consistent statistical characteristics over time, while non-stationary data displays changing statistical properties as time progresses (Gujarati, 2004).
| Variable | Level t-Stat | 5% Critical | P-Value | 1st Diff t-Stat | 5% Critical | P-Value | Conclusion |
|---|---|---|---|---|---|---|---|
| lnRGDPPC | -4.424 | -2.981 | 0.0018 | — | — | — | I(0) |
| TDS | -2.533 | -2.964 | 0.1182 | -8.672 | -2.968 | 0.0000 | I(1) |
| CGDGDP | -2.276 | -2.964 | 0.1859 | -6.377 | -2.968 | 0.0000 | I(1) |
| LnFDI | -1.942 | -2.964 | 0.3100 | -9.160 | -2.968 | 0.0000 | I(1) |
| GCFGDP | -0.110 | -2.964 | 0.9390 | -8.788 | -2.968 | 0.0000 | I(1) |
ADF Unit Root Tests
Source: Generated by the researcher using EViews (2023).
Based on the ADF test results, lnRGDPPC demonstrates stationarity at the 5% significance level, with a t-statistic of -4.424 falling below the 5% critical value of -2.981. Conversely, the variables TDS, CGDGDP, lnFDI, and GCFGDP exhibit non-stationarity at level but are stationary after taking their first differences, indicating first-order integration I(1). The combination of I(0) and I(1) variables justifies the use of the ARDL bounds testing approach.
ARDL Short-Run Estimation
Table [tab:short-run-ardl-estimation-results] presents the short-run ARDL estimation results. The coefficient section presents the estimated coefficients for each explanatory variable. A p-value below 0.05 is deemed statistically significant, signifying a significant impact of the corresponding variable on the dependent variable.
| Variable | Coefficient | Std. Error | T-Statistic | P-Value |
|---|---|---|---|---|
| TDS | 0.330683 | 0.056056 | 5.899173 | 0.0002 |
| CGDGDP | -0.001045 | 0.000250 | -4.176411 | 0.0009 |
| lnFDI | 0.021414 | 0.006579 | 3.254777 | 0.0058 |
| GCFGDP | -0.003829 | 0.000698 | -5.488638 | 0.0001 |
| CointEq(-1) | -0.533300 | 0.042032 | -12.68792 | 0.0000 |
| R² | 0.930405 | |||
| Adj. R² | 0.901102 | |||
| F-Prob | 0.000000 |
Short-Run ARDL Estimation Results
Source: Generated by the researcher using EViews (2023).
Cointegration Test
The ARDL bounds test was employed to assess whether a durable correlation exists between the predicted variable and the set of predictors over the long term. The F-statistic obtained is 19.76987, which exceeds all critical values presented in Table [tab:ardl-bounds-test-critical-value-bounds], suggesting compelling evidence of a long-term relationship between the dependent variable and the independent variable set.
| Significance | I(0) Lower Bound | I(1) Upper Bound |
|---|---|---|
| 10% | 2.20 | 3.09 |
| 5% | 2.56 | 3.49 |
| 2.5% | 2.88 | 3.87 |
| 1% | 3.29 | 4.37 |
| F-Statistic | 19.76987 |
ARDL Bounds Test Critical Value Bounds
Source: Generated by the researcher using EViews (2023).
| Variable | Coefficient | Std. Error | t-Statistic | Prob. |
|---|---|---|---|---|
| TDS | -0.002862 | 0.001164 | -2.458797 | 0.0276 |
| CGDGDP | -0.001960 | 0.000389 | -5.037816 | 0.0002 |
| LNFDI | 0.040153 | 0.013981 | 2.871900 | 0.0123 |
| GCFGDP | 0.008484 | 0.001095 | 7.751442 | 0.0000 |
| C | 7.949829 | 0.294387 | 27.00471 | 0.0000 |
Long-Run ARDL Estimation Results
Source: Generated by the researcher using EViews (2023).
Discussion
Short-Run Results
The short-run ARDL estimation results indicate a significant influence of all predictors on real GDP per capita at the 5% significance level. A 1% increase in total debt service (TDS) corresponds to a 0.33% increase in real GDP per capita, holding other variables constant. This observed association between an increase in TDS and a rise in real GDP per capita finds support in the Debt Overhang Hypothesis, which posits that in the short run, increased borrowing can boost economic activity by increasing aggregate demand through increased spending (Dawood et al., 2024). When borrowed funds are channeled into productive assets or infrastructure, they can create jobs, increase demand for goods and services, and generate long-term economic benefits.
In contrast to TDS, a 1% increase in central government debt (CGDGDP) is associated with a 0.001% decrease in real GDP per capita. This finding is consistent with the Debt Crowding-out Theory, wherein an increase in government borrowing can lead to higher interest rates, crowding out private investment and reducing economic growth. However, this finding is not consistent with empirical evidence by Yusuf and Mohd (2021), who found a positive relationship between public debt and economic growth in the short run.
A 1% increase in FDI (lnFDI) is associated with a 0.02% increase in real GDP per capita. The neoclassical theory suggests that FDI can boost economic growth through the transfer of technology, knowledge, and management skills, leading to increased productivity and efficiency (Hayat, 2018). This positive short-run relationship is attributable to the spill-over effect of FDI on host country productivity. These theoretical arguments are consistent with empirical studies by (Borensztein et al., 1998; Thao, 2018; Xu & Wang, 2000) who found FDI to have a positive impact on economic growth.
A 1% increase in gross capital formation (GCFGDP) is associated with a 0.004% decrease in real GDP per capita. The negative short-run relationship may be explained by the crowding-out effect, wherein an increase in GCF could lead to higher interest rates, discouraging private investment and reducing aggregate demand (Eisner, 1971). This is consistent with findings by (Calderón & Liu, 2003; Devarajan et al., 1996) who found evidence of the crowding-out effect of GCF on economic growth.
The R-squared value of 0.93 indicates that the explanatory variables account for a considerable portion of the variation in real GDP per capita, and the adjusted R-squared of 0.90 confirms statistical significance. The coefficient for the error correction term CointEq(-1) is negative, significant, and less than one (-0.533), implying that approximately 53.33% of any deviations from equilibrium are adjusted for within one period.
Long-Run Results
The long-run ARDL estimation results suggest that independent variables have a significant impact on real GDP per capita. A 1% increase in TDS is associated with a 0.29% decrease in real GDP per capita in the long run. This result supports the debt overhang hypothesis, which suggests that excessive debt can have negative effects on economic growth in the long run (Krugman, 1988), and is supported by empirical evidence from (Yusuf & Mohd, 2021).
A 1% increase in central government debt (CGDGDP) is associated with a 0.002% decrease in real GDP per capita in the long run. This finding is consistent with the debt overhang hypothesis, as excessive government debt can lead to higher interest rates and lower private investment, hampering economic growth (Reinhart & Rogoff, 2010). This result is also corroborated by (Hilton, 2021; Yusuf & Mohd, 2021).
A 1% increase in FDI is associated with a 0.04% increase in real GDP per capita in the long run, consistent with the theory that foreign direct investment can stimulate economic growth through the transfer of technology, skills, and knowledge (Borensztein et al., 1998), and supported by (Thao, 2018). Finally, a 1% increase in gross capital formation is associated with a 0.008% increase in real GDP per capita in the long run, consistent with the theory that investment in physical capital leads to increased productivity and economic growth (Solow, 1956), and supported by (Thao, 2018).
Conclusion
The primary aim of this research was to evaluate how central government debt affects economic growth in Zambia, while also examining the roles of FDI, capital formation, and debt service. The ARDL estimation results confirm that all four independent variables (TDS, CGDGDP, lnFDI, and GCFGDP) had a significant impact on real GDP per capita at the 5% significance level. In the short run, a 1% increase in TDS corresponds to a 0.33% increase in real GDP per capita; a 1% increase in CGDGDP corresponds to a 0.001% decrease; a 1% increase in lnFDI corresponds to a 0.02% increase; and a 1% increase in GCFGDP corresponds to a 0.004% decrease. In the long run, the effects of TDS and central government debt become negative, while FDI and gross capital formation maintain positive effects on economic growth. All four null hypotheses that there was no statistically significant correlation between each independent variable and economic growth were rejected in favor of the respective alternative hypotheses, confirming the statistical significance of these relationships in both short-run and long-run timeframes.
These findings carry significant implications for policymakers in Zambia. The results demonstrate that an escalation in total debt service may be associated with short-term growth benefits but corresponds to long-run decline in real GDP per capita. Central government debt has a negative impact on economic growth due to the crowding-out phenomenon. Foreign direct investment consistently displays a positive association with economic growth, while gross capital formation exhibits a positive long-run relationship with economic growth.
Recommendations
Drawing upon the outcomes of this investigation, several recommendations can be put forth to ensure that each factor contributes favorably to the economic growth of Zambia.
Debt Management: The Zambian government needs to manage its debt levels carefully to ensure that the debt burden does not become unsustainable. The government could consider debt restructuring, debt forgiveness, or renegotiation of loan terms with creditors to reduce the burden of debt.
Encouraging Foreign Direct Investment: The government should create a favorable business environment through policies that promote transparency, stability, and predictability, and could provide incentives such as tax breaks, subsidies, or grants to attract foreign investors.
Encouraging Domestic Capital Formation: The Zambian government should encourage domestic capital formation through policies that promote savings, investment, and entrepreneurship, including tax breaks, subsidies, or grants for domestic investment.
Enhancing Debt Service Capacity: The government should take measures to enhance its debt service capacity by increasing revenue through taxation, diversifying the economy, and improving efficiency in public expenditure management.
Promoting Economic Diversification: The Zambian economy has been heavily reliant on copper exports, making it vulnerable to external shocks. The government should promote economic diversification in sectors such as agriculture, tourism, manufacturing, and services.
Improving Governance and Transparency: The government should strengthen institutions, promote accountability, and combat corruption through measures such as reforming public procurement processes, promoting freedom of the press, and strengthening the judiciary.
Conflict of Interest
The authors declare no conflict of interest.
Ethical Approval
Not applicable
Data Availability
The datasets used in this study are openly available at [repository link] and the source code is available on GitHub at [GitHub link].
Funding
This work did not receive any external funding.
References
Cite this article
Related Research

Special Issue
Launch a focused special issue to highlight research, emerging trends, and expert insights in your academic field.