

IntelliPaper
Abstract
Introduction. In the world, practice of soil research there is ASTM Standard Test Method for Measurement of Soil Potential (Suction) Using Filter Paper D 5298-16. However, unfortunately, in Russia there are no defining documents related to negative pore pressure, or matrix suction, or SWCC, yet.
Materials and methods. In this study, as a practical example of the effect of suction pressure on slope stability, the authors considered an object located in Zelenograd. Because of the experiment, SWCC was obtained and a geomechanical model was created.
Results. Thus, for cover loams, the value of the initial suction pressure is 17 kPa. The value of matrix suction is 199 kPa. For fluvioglacial loams, the value of the initial suction pressure is 14 kPa. The value of matrix suction according to the graph is 207 kPa.
Discussion and conclusion. Subsequently, calculations were performed in the Plaxis software without taking into account the suction pressure and with taking into account the suction pressure, while all other model parameters remained unchanged.
Explore Digital Article Text
I. FOR CITATION
In Russian engineering practice, the classical concept of soil mechanics assumes solving problems involving either fully saturated or fully dry soil, which are actually two limiting states of soil. In most cases, soils used as foundations for buildings and structures are in an unsaturated state and their degree of water saturation can vary from 0% to 100%. In this case, designers use the Van Genuchten-Mualem equation in their models, which is intended for unsaturated soils. Unsaturated soils are commonly found in many parts of the world, at a shallow depth (from 2-3 m to 10-15 m) from the surface, as well as in arid regions, where the natural groundwater level is usually at a greater depth. Common to all these soils is their negative pore water pressure, which plays an important role in assessing mechanical properties and also complicates their studies in the laboratory. The presence of air and water in the pore spaces between soil particles causes capillary action, which creates suction.
The relationship between soil suction pressure and water content is determined by SWCC and is an important tool for predicting and interpreting the behavior of unsaturated soils, including under load. SWCC is the relationship between matric suction (chemical potential) and water content (gravimetric or volumetric) or degree of saturation. As the soil passes from a saturated state to an unsaturated state, the distribution of mineral, water and air phases changes as the stress state changes. The relationships between these phases take different forms and affect the engineering properties of unsaturated soils.
In the world practice of soil research, there is ASTM Standard Test Method for Measurement of Soil Potential (Suction) Using Filter Paper D 5298-16. But, unfortunately, in Russia there are no defining documents related to negative pore pressure, or matrix suction, or SWCC.
The advantages of the filter paper method are the ability to measure total suction, which is the sum of osmotic and structural suction, as well as technical simplicity, low cost and sufficient accuracy.
Based on ASTM D 5298, we conducted experimental studies to determine the characteristic curve. The tests were carried out using the filter paper method with the Whatman No.
As a practical example of the effect of suction pressure on slope stability, we will consider an object located in Zelenograd.
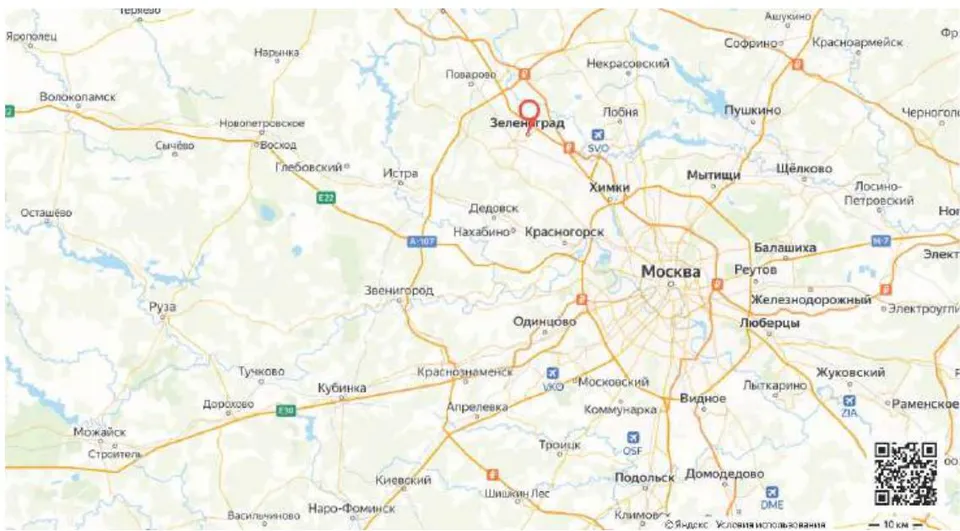
The engineering-geological section is represented by:
Modern technogenic (fill) accumulations (tQIV), represented by refractory loams; fine sands of medium density;
Upper Quaternary cover deposits (prQIII) represented by gray-brown, heavy, semi-hard loams with ferrugination interlayers;
Middle Quaternary fluvioglacial water-glacial and lacustrine-glacial deposits of the Moscow horizon (f, lgQIIms), represented by soft- and refractory loams, rarely peaty.
As a result of the experiment, the characteristic soil-water curves presented in Figures 2 and 3 were obtained. Thus, for the mantle loams, the value of the initial suction pressure, or air entry value (AEV), is 17 kPa. Before this point, there is a boundary effect zone. The value of matrix suction according to the graph is 199 kPa, and after it, there is a residual zone. Between the points of air entry and matrix suction values, there is a transition zone. For fluvioglacial deposits, the value of the initial suction pressure, or air entry value (AEV), is 14 kPa. Before this point, there is a boundary effect zone. The value of matrix suction according to the graph is 207 kPa, and after it, there is a residual zone.
{"image_source":{"path":"images/a9140426f2208dde7900bba066f960bc16dbced980d6a42d73a80cc68c6c015f.jpg"},"content":"","chart_caption":[],"chart_footnote":[]} {"image_source":{"path":"images/e59c7c178f5fe4227f65cdaab347b96e57371a405c09e42f7a88a4f1b35bf562.jpg"},"content":"","chart_caption":[{"type":"text","content":"Figure 2: Results of constructing SWCC for cover loams"},{"type":"text","content":"Figure 3: Results of SWCC construction for fluvioglacial loams"}],"chart_footnote":[]}
In addition, X-ray diffraction quantitative analysis was performed for qualitative assessment. The results of mineral analysis are presented in Table 2:
*smectite and mixed-layer illite-smectite minerals
| Sample | smectite * | illite | chlorite | kaolinite | palygorskite | quartz | calcite | Actinolite | Aragonite | dolomite | potassiumfeldspar(микроклин) | plagioclase(альбит) | Gypsum | Pyrite | Anatase |
| Sheet | 8,7 | 23,8 | 10,7 | 4,0 | - | 17,2 | 2,2 | - | - | 20,1 | 8,7 | 4,6 | - | - | - |
| Glacial | 13,6 | 5,1 | 2,1 | 3,3 | 2,0 | 45,2 | 11,6 | - | - | 7,5 | 7,6 | 2,0 | - | - | - |
{"image_source":{"path":"images/46c521084d05ff88eaa43df70e5cacc0265bec0422d0cff8d4f444ab0478a7c1.jpg"},"content":"","chart_caption":[{"type":"text","content":"Figure 4: Results of mineral analysis for cover loams"}],"chart_footnote":[]} {"image_source":{"path":"images/5ad67151d4aca1588efc256c5c6c4f3c7746ff005580f977dc11ab99d975975c.jpg"},"content":"","chart_caption":[{"type":"text","content":"Figure 5: Results of mineral analysis for fluvioglacial loams"}],"chart_footnote":[]}
As mentioned above, suction pressure and capillarity can affect the physical and mechanical properties of soils, which in turn affect the value of the slope stability coefficient.
The solution of the Mualem-Van Genuchten model is presented in the Plaxis software for geotechnical calculations, but it is necessary to use the SWCC soil-water characteristic curve, constructed on the basis of laboratory tests or adopted according to recommendations for different types of soils.
Subsequently, calculations were performed in the Plaxis software without taking into account the suction pressure and with it, while all other parameters of the model remained unchanged.
The modeling results are presented in Figures 6-10.
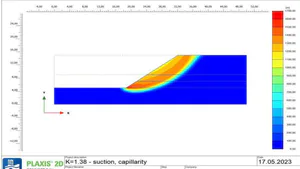
The first calculation was performed for a preliminary assessment of the effect of suction pressure. For this purpose, a stability calculation was performed for a slope composed of one type of soil. The calculation results are shown in Figures 6 and 7. The modeling analysis showed that even if the slope is formed by one type of soil, there is a difference between the values of the stability coefficient without taking into account suction and with it. Without suction and capillarity, the stability coefficient was 1.21. With suction and capillarity, the stability coefficient was 1.38.
The analysis of the figures showed that the slope stability coefficient without taking into account suction and capillarity of the soil is 1.46 (Figure 8). With suction and capillarity, the stability coefficient increases to 1.67 (Figure 9). If only the suction pressure is taken into account in the modeling process without taking capillarity into account (Figure 10), the stability coefficient is 1.66.
In addition, the pore pressure was calculated, including the negative one. The maximum value was 39.94 kPa, and the negative value was -50 kPa according to the boundary condition. The maximum suction pressure was also 39.94 kPa.
{"image_source":{"path":"images/b1a71aaa6b98f7a55054af0fdaf9ceed3ed547d2f5871a0dbaf42e339999559c.jpg"},"content":"","chart_caption":[],"chart_footnote":[]} {"image_source":{"path":"images/4ddb5cdb8ff01d7ba46c716c114f6bf6f0ced2e02f26bdf91c00799c3ea06552.jpg"},"content":"","chart_caption":[{"type":"text","content":"Figure 6"},{"type":"text","content":"Figure 7"}],"chart_footnote":[]}
{"image_source":{"path":"images/f3c89659e8153830e8a6cc9e6cb3e1365a76c7b209c264f970d272bfcda5e270.jpg"},"content":"","chart_caption":[{"type":"text","content":"Figure 8"}],"chart_footnote":[]} {"image_source":{"path":"images/6bf8c8f30a3e6aba1427ab5afca12f53998f1709eafb2cb1f67a753d22a85bae.jpg"},"content":"","chart_caption":[{"type":"text","content":"Figure 9"}],"chart_footnote":[]}
{"image_source":{"path":"images/24438a9db469b55f1b4e5daeb2f832eed2c8ca54e732731d506328bc01c7465b.jpg"},"content":"","chart_caption":[{"type":"text","content":"Figure 10"}],"chart_footnote":[]}
Conflict of Interest
The authors declare no conflict of interest.
Ethical Approval
Not applicable
Data Availability
The datasets used in this study are openly available at [repository link] and the source code is available on GitHub at [GitHub link].
Funding
This work did not receive any external funding.
References
Cite this article
Related Research


Special Issue
Launch a focused special issue to highlight research, emerging trends, and expert insights in your academic field.