

IntelliPaper
Abstract
A new method of approximation by linear functions of random points specified in the Cartesian coordinate system is proposed and tested. The coefficients of the equation are determined from the condition of the minimum sum of the squares of the distances to the given points.
In contrast to the classical method of approximation by linear functions, the proposed method does not lead to the uniqueness of the solution.
A brief summary of the theory of the new method and its application is given. In particular, the following problems are considered: approximation of a random numerical field; interpolation of experimental data; analysis of the variance of the results of experiments; optimal placement of machine-building equipment; forecast of the number of products. The results of the calculations showed the high efficiency of the proposed method for solving practical problems.
Explore Digital Article Text
Introduction
Numerous studies have been devoted to linear and nonlinear regression analysis for solving various applied problems, for example [1 - 14]. It is almost impossible to give a complete overview of these works. Nevertheless, we would like to mention some studies that we believe are relevant to the issues discussed in this article. References [4, 5, 7 – 12, 14] discuss various aspects of linear and nonlinear regression methods. These papers analyze the problems of finding optimal functions using the least squares method and its modifications. These works provide general information and the ability to build various mathematical models for analyzing statistical data.
The tasks of optimal tracing and predictive analytics are solved, as a rule, by minimizing the sum of the squares of the deviations of the straight line from the points set by their coordinates on the plane. This approach has its advantages and disadvantages. From the point of view of mathematical analysis, it should be noted that it is not difficult to find the minimum of the sum of the squares of the deviations: it is enough to calculate the derivatives with respect to the parameters of a straight line and solve a system of two linear algebraic equations. This is an advantage of the classical approach, because in order to minimize, for example, the sum of absolute values of deviations, it is necessary to develop special algorithms. The disadvantages of the classical algorithm include the fact that in the case of large values of the angular coefficient of the regression line, a large sum of squared deviations (variance) is obtained.
For this case, the proposed method of choosing a regression line based on the sum of the squares of the distances gives a lower variance value and leads to a duality in choosing the optimal line. This property of the new approach is more attractive for engineering when solving problems of optimal tracing and forecasting.
The new method
According to the classical version of the least squares method [1 - 3], it is necessary to find the parameters of the line from the minimum sum condition
(1)
After calculating the derivatives (1) with respect to the parameters k and b, we obtain the system
(2)
The solution of system (2) has a view
The new approach to statistical information analysis is to minimize the sum of the squares of the distances
(3)
Calculating the derivatives (3) with respect to the parameters k, b leads to a quadratic equation of the form
(4)
If we give two solution of equation (4)
(5)
The lines , (5) are mutually perpendicular () and these lines pass through the point with coordinates .
For tracing problems, when it is necessary to continue a straight line passing through a point with coordinates x0, y0, an equation of the form (4) is solved, where the coordinates xi, yi are replaced by . This approach solves the problem of optimal direction by piecewise linear functions and finds many practical applications.
For the multidimensional case, similar problems of regression analysis are discussed in the paper [13].
Applications of methods
Test 1: conditions for effective use
The analysis of the conditions for the effective use of the new method was applied in the field of uniformly distributed random X-Y coordinates (n = 500). A special computer program has been developed for calculating the parameters of regression equations and classical variances, for classical calculation (Table. 1) and the new one (Table. 2) methods. In addition, the linear trend method implemented in MS Excel was also used (Table 3). The calculation results are shown in Fig. 1.
A comparison of the calculation results showed that the variance of the classical method in the field of uniformly distributed random coordinates is 72.2% and 27.8%, and the variance of classical method linear trend is less than 1% of the variance of the new method (Fig. 1a), but if most of the numbers are grouped at the top of the numerical field (Fig.1b), the variances calculated by according to the classical method, they become 12.6 times more, and according to the linear trend method, they are 35.3 times more than the variances calculated using the new method. Therefore, in order to reduce the interpolation error, it is rational to perform calculations together using new and classical methods, and use the parameters of the linear regression equation for lower variance.
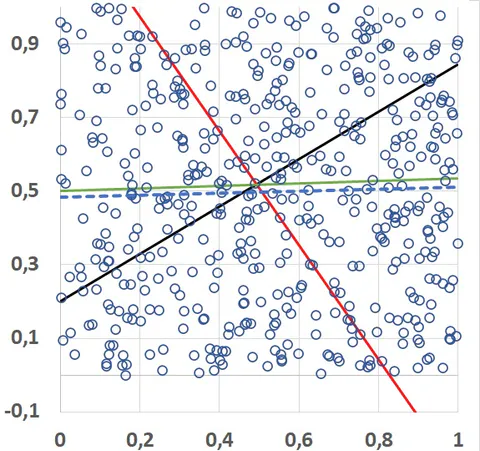
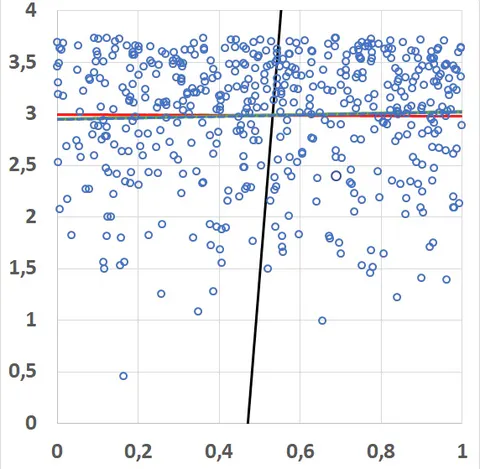
Table 1. Variances (D) of the classical method
| Fig. 1 | k | b | D |
|---|---|---|---|
| a | 0,0344 | 0,50140 | 0,08232 |
| b | 0,0732 | 2,9455 | 0,0004 |
Table 2. Variances (D1 and D2) of the new method
| Fig. 1 | k1 | k2 | b1 | b2 | D1 | D2 |
|---|---|---|---|---|---|---|
| a | 0,64 | -1,550 | 0,2005 | 1,283 | 0,114 | 0,2961 |
| b | 48,7 | -0,020 | -22,95 | 2,995 | 194,1 | 3,4∙10-5 |
Table 3. Variance (D) of the linear trend of classical method (used by MS Excel)
| Fig. 1 | k | b | D |
|---|---|---|---|
| a | 0,0267 | 0,4837 | 0,0007 |
| b | 0,0732 | 2,9456 | 0,0012 |
Test 2: Interpolating tabular data
Interpolation, or approximate calculation based on individual values, is performed for tabulating tables of experimental data (determining values between experimental data), error control when analyzing experimental results in physics and engineering, numerical integration of tabular data (quadrature integration) and when solving other similar problems.
The effectiveness of the new method is equal to the error of the results calculated from the test functions, replaced by approximate linear equations of the form (5):
(6)
where δ(x) – is a function consisting of random numeric values ranging from −0,2∙y to +0,2∙y with a uniform probability distribution, n =1000.
The interpolation error was calculated using the formula
where yт и yи - The calculation results are based on formulas (6) and linear regression equation (5).
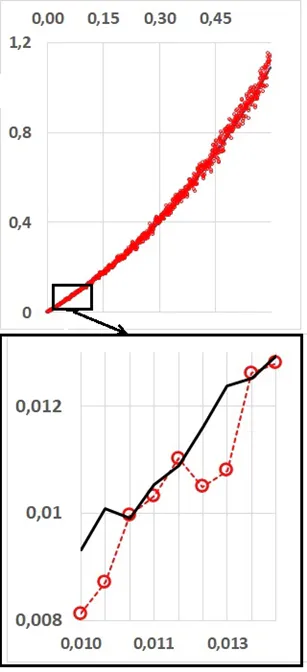
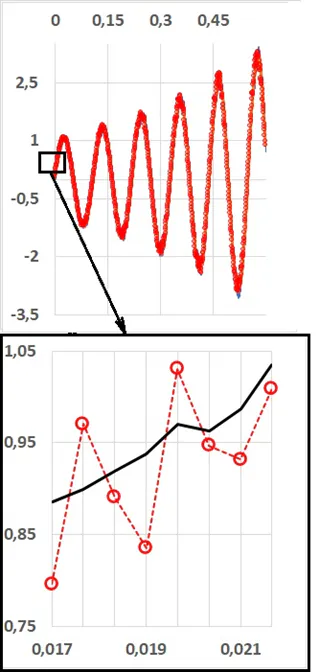
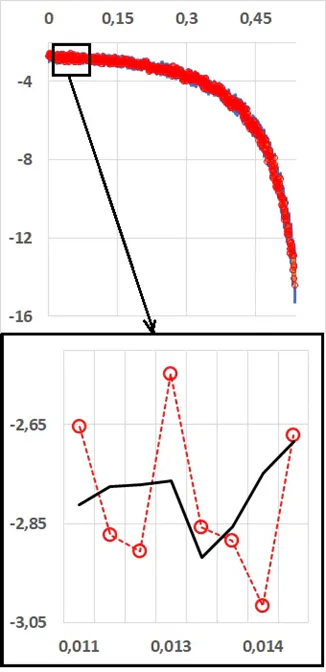
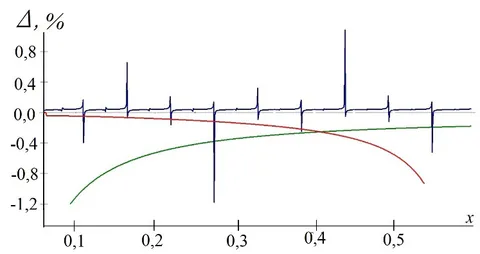
The test showed that the error of interpolation of various functions: monotonically increasing, decreasing or alternating, with random deviations, under test conditions is ±1.2%
The data for Test 3 and Test 4 are provided by real mechanical productions.
Test 3: Optimal location of metalworking equipment
The transportation of workpieces, parts and tools from the automatic warehouse to the equipment and back should be carried out on a conveyor (Fig. 4). It is required to find the direction of the conveyor that will ensure its minimum length.
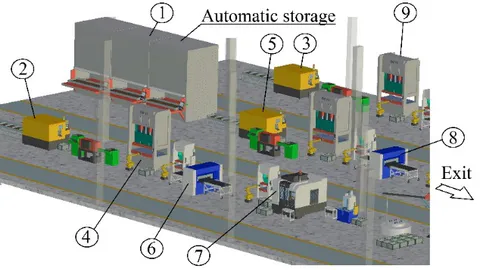
Assume that the “X” and “Y” axes, the zero point, and the coordinates of the equipment centers are known (Fig. 5, Table 4 and Table. 5).
Table 4. Coordinates of equipment centers, m
| № | 1 | 2 | 3 | 4 | 5 |
|---|---|---|---|---|---|
| X | 11,6 | 6,8 | 26,7 | 23,4 | 33,3 |
| Y | 18,8 | 5,0 | 27,0 | 7,0 | 17,0 |
Table 5. Coordinates of equipment centers (continuation), m
| № | 6 | 7 | 8 | 9 |
|---|---|---|---|---|
| X | 34,0 | 41,3 | 47,3 | 47,6 |
| Y | 6,2 | 4,6 | 14,3 | 26,0 |
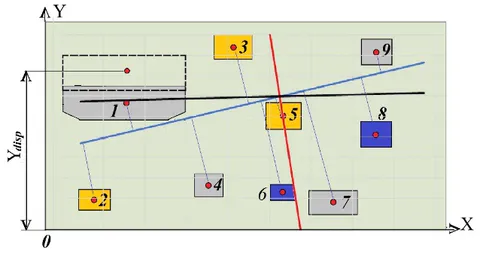
As can be seen from Table 6, the average square deviations calculated from the classical (S) and new (S1) versions of regression analysis do not differ by much. However, in the case of laying the conveyor along the line calculated according to the classical version, it is necessary to move the automatic storage to the Y*disp* = 22,5 m position. The variance will be greater and equal to S = 9,14 m.
Solving the optimal placement problem using the equations of the classical and new versions of regression analysis has shown that the new approach can be more effective. In addition to the optimal placement of metal-cutting equipment, new methods can be used for laying linear sections of highways, pipelines, and connections on an electronic circuit board.
Table 6. Numerical characteristics of regression equations and average square deviations
| k | b | S | k1 | k2 | b1 | b2 | S1 | S2 |
|---|---|---|---|---|---|---|---|---|
| 0,02 | 13,3 | 8,7 | 0,19 | -5,2 | 8,2 | 171,8 | 8,7 | 78,3 |
Test 4: Product quantity forecast
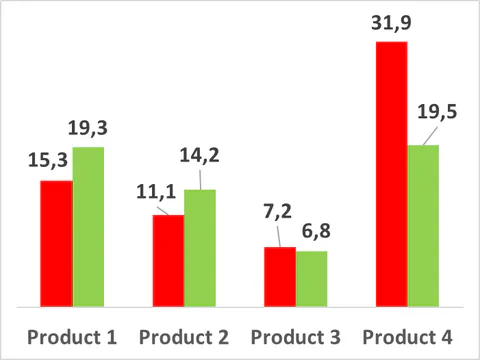
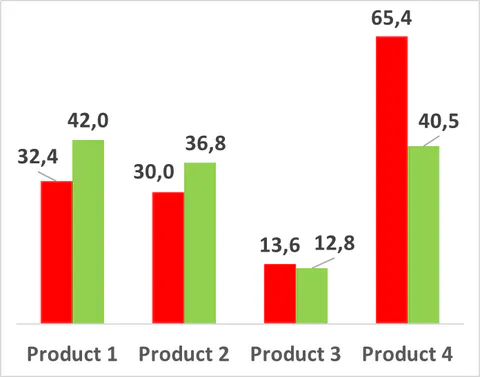
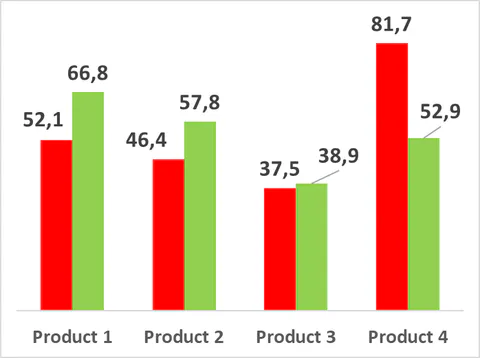
To test the linear models of the new and classical versions of regression analysis, the machine–building plant provided the actual number of four products that it manufactured in 2010 - 2015 (Fig. 6).
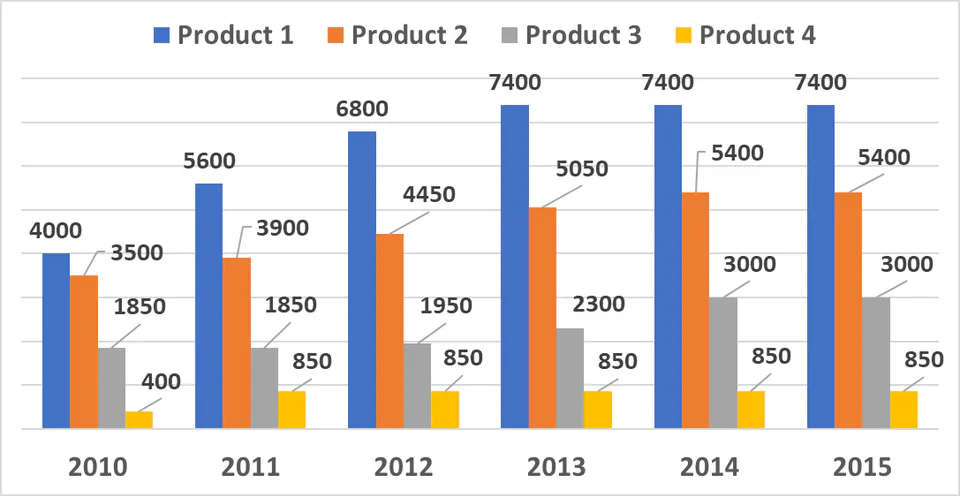
For testing purposes, let's assume that the number of products for the first two years is known. It is required to make a forecast of the possible number of products for 2012 – 2015.
Based on these data for 2010 and 2011, the parameters of linear equations for the classical and new versions were calculated. The forecast of the number of products for 2012 is performed using regression equations, in which the argument is equal to the number of products produced in 2011. The forecast for the remaining years is carried out using the predicted values for previous years.
The forecast error is calculated using the formula
where Y*forecast* is the number of products calculated as a result of the forecast, and Y*fact* is the actual quantity according to the factory data.
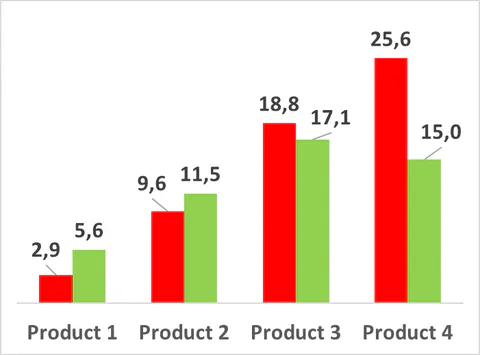
Under the conditions of the test under consideration, the prediction error for the linear equations of the new version is close to or less than that calculated according to the classical version (Fig. 7). To solve the problems of predictive analytics, it is possible to increase accuracy if the new version of the analysis uses nonlinear functions instead of linear ones [6].
Conclusion
A new variant of regression analysis for statistical points on a plane is proposed by minimizing the sum of squared distances. It is shown that this approach provides less error in data analysis and has the property of non-uniqueness in the selection of piecewise linear functions.
The testing and examples of using the proposed method for solving real-world problems have shown the limits of its effective application.
Conflict of Interest
The authors declare no conflict of interest.
Ethical Approval
Not applicable
Data Availability
The datasets used in this study are openly available at [repository link] and the source code is available on GitHub at [GitHub link].
Funding
This work did not receive any external funding.
References
Cite this article
Related Research

Special Issue
Launch a focused special issue to highlight research, emerging trends, and expert insights in your academic field.