

IntelliPaper
Abstract
Our earth about 71% percent is covered with water. Out of 71% of water, only 3.5% of water is fresh water and the remaining is saline water. Among the fresh water, only 1.2% of fresh water is under usage. Remaining fresh water is in the forms of glaciers & ice caps. Water is a natural resource. It exists in both the forms of surface water & ground water.
In our daily life water plays a vital role, as we are using it for drinking, domestic, agriculture, industry etc. Water quality is one of the most severe concerns around the globe. It is a major factor affecting the human health as well as ecological systems. The drinking water should be free from harmful chemicals and micro-organisms. The quality of drinking water and for various purposes is defined by different quality parameters.
In this study, to assess the quality of water in pulivendula urban, Kadapa district, Andhra Pradesh (AP), the water samples are collected, tested and analysed for different quality parameters viz pH, Electrical Conductivity (EC), Total Hardness (TH), Cl-, Total Dissolved Solids (TDS), Alkalinity & Fluorides in our laboratory of department of chemistry, JNTUACE Pulivendula.
Then the results of each sample’s quality parameters are analysed, and compared with standard values as per BIS (Bureau of Indian Standards) and Water Quality Index standards regarding drinking. Finally, these results and comparisons are reported.
Explore Digital Article Text
I. INTRODUCTION
Water is an essential component of the environment and it sustains life on the earth. Even though water is one of the renewable resources, the growing human population is further increasing the demand of this renewable resources. Ground water exhaustion is faster than its percolation back into the ground. Ground water is preferred than surface water for drinking. Mostly, it is free from pollution when compared with surface water, there is no evaporation loss and it is the main source of water supply in the regions where there are no perennial rivers.
Water is essential for domestic purposes, including drinking, cooking, cleaning, bathing, sanitation, laundry, dishwashing and gardening. As well as, Water is crucial for irrigation purposes in agriculture, as it helps in crop growth, soil fertility maintenance, temperature regulation, pest and weed control and enhancing yield. Efficient water management and recycling in industries help conserve resources and reduce environmental impact. And also, water plays vital role in various industrial processes, including manufacturing of products, regulation of machinery's temperature, power generation in hydroelectric plants and cooling systems of thermal and nuclear power stations, acts as a solvent, carrier, and medium in various industries.
The main objective of this study is "Assessment of quality of ground water by conducting tests by collected water samples of ground water from different locations of pulivendula urban, Kadapa (dist.), A.P., as water quality possess a very important and key role in our daily life and also to compare the results with Water Quality Index standards."
1.1 Source of water
Rain is the source of ground water as well as surface water. Rain is the liquid water in the form of droplets that have condensed from atmospheric water vapour and then becomes heavy enough to fall down. It provides water for many types of ecosystems, as well as water for domestic, irrigation & industrial purposes.
In all these usages water quality is very important, the water with fair & poor quality will affect the human health and cause diseases such as typhoid, cholera and various seasonal diseases. And also, it leads to disturbance in ecosystems, and imbalance in climate.
1.2 Ground water
Ground water is the water present beneath the earth's surface in soil pores and rock formations. It is stored in underground layers called aquifers and is a major source of fresh water for drinking, irrigation, and industrial use.
Ground water is replenished through infiltration from rain water and surface water bodies like rivers and lakes. It can be extracted using wells and boreholes. Over-extraction can lead to depletion and environmental issues like land subsidence and reduced water availability.
Generally, ground water has very good quality because it undergoes natural filtration as it percolates through soil, sand and rock layers. These layers remove impurities, sediments, and harmful micro-organisms making ground water cleaner than surface water. And also, the lack of direct exposure to pollutants like industrial waste and sewage, helps to maintain its purity. Now a days due to rapid industrialization, water resources are getting lowered. In fact, industrial waste and municipal solid waste management has emerged as one of the leading causes of pollution of ground water.
However, quality of ground water can be affected by overuse, contamination from chemicals and improper waste disposal. Regular monitoring and sustainable usage are essential ways to preserve its high quality.
1.3 Description of the study area
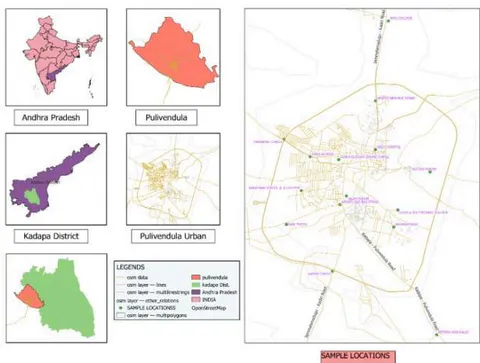
The study area in the pulivendula, is located on the north-west region of the district of Y.S.R Kadapa district, A.P. 14 25' 19" North (Latitude) and 78 13' 32" East (Longitude) are passing through this particular study area and its open series map is D44G3. According to Kadapa Urban Development Authority, the area is 87.17 sq.km.
The study area, pulivendula is surrounded by Lingala, Thondur, Simhadripuram, Vemula, Veeranayunipalli mandals. Pulivendula was established as grade municipality in 2005. As per records the elevation of the area is 892 ft.
1.4 Geological data
1.4.1 Rivers
The important rivers in the pulivendula region are papagni river, Chitrvathi river and Penna river. Many of the isolated blocks of rocky hills which are scattered throughout the district and occur frequently in western taluks of Pulivendula, Proddutur and Rayachoty.
1.4.2 Soils
Red and black soils are the two main soil types in the pulivendula region having poor good fertility. Red soils occupy 53% of the cultivated area and have low nutrient status. Black soils covered nearly 47% of the cultivated area and are generally associated with clay content. The black soils in Kadapa district is extend in two disconnected belts.
1.4.3 Minerals
Asbestos of chrysotile variety occurs at the contact of vempalle. Chrysotile asbestos is the most important commercial variety of asbestos for spinning into yarn and woven into fabrics. Barytes occurs in vempalli dolomite and associated basic igneous rocks as veins in Pulivendula, Kadapa, and Kamalapuram taluks.
1.5 Geographical Data
1.5.1 Forests
The forests of Kadapa district are mainly situated on the principal hill ranges, namely, Seshachalam, Nallamalai, Veligonda, palkonda, and Lankamalai. The forests of the district are of dry deciduous type. Red sanders or Pterocarpus are the famous and most important species which distinct the forest of the district as this is the only district of the country India in which the species occurs.
1.5.2 Rainfall
Pulivendula is part of the Rayalaseema plateau, a region with semi-arid climate, diverse terrain and with an average annual rainfall if 564 mm and 43 rainy days (day with rainfall 2.5 mm or more -on an average). Pulivendula receives scanty rainfall both from south-west and north-east monsoons.
1.5.3 Wind
Winds are generally light to moderate in spread with some strengthening during summer and early part of the southwest monsoon seasons. In the summer season and southwest monsoon season, winds are mostly from directions between south and west.
II. LITERATURE REVIEWS
2.1. Mahammad Rafi et al., (2018)
"Quality assessment of drinking water: YSR Kadapa district (A.P)" study investigates the quality of drinking water in YSR Kadapa dist., Andhra Pradesh, due to contamination from human, industrial and agricultural activities. Water samples are collected from various locations, including pulivendula, badvel, rajampet and Proddutur focusing on both surface and ground water sources. The samples were compared against Indian water quality standards to assess their safety for drinking. The study found that some water samples exceeded safe limits for turbidity, fluoride, dissolved oxygen, copper, iron, and aluminium. Overall, the research calls for immediate action to treat contaminated water sources to safeguard the health of the local population.
2.2. Amatasani Kalpana et al., (2023)
"Assessment of ground water quality in around RTPP, Muddanur, Kadapa District, Andhra Pradesh, India using multi analytical and stastical techniques" study evaluates groundwater quality around RTPP focusing on various hydro chemical parameters such as pH, electrical conductivity, and total dissolved solids. The findings suggest that while the ground water is suitable for domestic use, it is not safe for drinking due to high total dissolved solids and hardness levels.
2.3. Dr. Kondaiah et al., (2024)
"Assessment of Water quality parameters in around Proddutur city" study assess water quality parameters in around Proddutur city focusing on the impact of industrialization and agricultural practices on water sources. The findings highlight the need for regular monitoring and treatment of water sources to ensure safety for drinking and agriculture use Overall, the study emphasizes the importance of assessing water quality to mitigate the effects of pollution and safeguard public health.
III. METHODOLOGY
This study is particularly aimed to assess the quality of ground water in pulivendula urban. So, at first the Locations of Water samples were identified and marked in the map. About 15he sample stations are as follows locations of samples were identified and water samples were collected from the sample stations. The sample stations are as follows:
The results of these water quality parameters were noted down. The results were tabulated and compared with standard drinking values as per Water Quality Index (WQI).
3.1 Experimental procedures of parameters
These are the experimental procedures that we had followed are as follows:
a. Procedure for pH
Standard pH meter is used to determine the Ph of water samples. Firstly, it is calibrated with known pH and then pH of the water samples is measured directly.
Sample calculation: It is measured directly from the instrument pH meter.
b. Procedure for Dissolved Oxygen (DO)
The sample is taken full in 300ml BOD bottle and 1ml of manganese sulphate solution is added by dipping the end of the pipette just below the surface of water. The 1 ml of alkaline potassium iodide is added and is mixed thoroughly, and the precipitate so formed is allowed to settle down. Then 2ml of is added and the precipitate is made to dissolve by shaking 20ml of sample is taken into conical flask. Add 1to 2drops of starch indicator and titrate against until disappearance of blue colour which is the point.
Formula: Dissolved oxygen = k * 0.025 * 8 * 0.698 * 1000 x vol. Of hypo used/vol. of sample (20 ml)
c. Procedure for Total Dissolved Solids (TDS)
The dissolved solids consist of inorganic salts by carbonates, bi carbonates, chlorides, sulphates etc. Together with small amount of organic matter and dissolved gases. It is expressed in mg/lit or ppm. It can be determined by water analyser.
d. Procedure for Chlorides
Take appropriate quantity of sample (20 ml) in a conical flask. If the sample is highly coloured, add 3 ml Al(OH) , suspension mix. Adjust the pH value of sample in the range of 7-10 with or NaOH solution. Add 1.0 ml (20 drops) K CrO indicator solution to this sample (100 ml). Titrate the sample with standard AgNO solution to a pinkish yellow end point in general, the colour changes from yellow to brick reddish. Record the volume of AgNO used. Repeat the procedure at least three times in which two readings are same.
Chemical reaction is
Calculations: Chlorides concentration, Cl-in mg/lit = ((A-B) ×35.46×0.0156 ×1000)/volume of sample taken; where A= ml of titrant used for sample, B= ml of titrant used for blank, N= normality of AgNO3 & V= volume of sample.
e. Procedure for Fluorides
Take 5ml water sample into the beaker and fluoride reagent to the sample. Thus, formed solution is taken into the quvites and the quvite is placed into the slot provided in the Spectro quant Pharos 300 and it gives the fluoride content in the water sample.
f. Procedure for Electric Conductivity
By using conductivity meter, the electric conductivity of the water samples is determined. After the calibration of conductivity meter conductivity of samples is measured directly. Calibration is carried out by using standard solution (0.7456 g of anhydrous KCl in 1 litre of deionized water = 1408 micro siemens/cm).
g.Procedure for alkalinity
Pipette out 20 ml of the water sample in a conical flask. Add 2-3 drops of phenolphthalein indicator. Titrate the sample against standard acid solution (N/50 ) until pink color disappears. Note the volume of titrant used P ml. Now add 2-3 drops of methyl orange solution to the sample of water. Titrate the sample with N/50 , solution in the change of color from yellow to red. Again note the volume of titrant used including two previous one. This corresponds to 'm' ml. Repeat the procedure for at least concurrent readings.
h. Procedure for hardness
Take appropriate volume of sample in a conical flask (20 ml). Add 1 to 2 ml of buffer solution and 2 to 3 drops of Eriochrome black T indicator to it. Titrate it with standard EDTA solution till the end point i.e.; the color changes from wine red to blue.
Record the burrete readings and calculate the total hardness. Repeat the procedure from step 1 to 4 till the conformation. Take another appropriate volume of sample.
Calculations: Total hardness as mg/lit CaCO3 = V; {V = B * 1000}
Where; A=ml of EDTA used for total hardness.
3.2 Locations of samples
Table-1: Locations of water sample stations
| s.no. | Sample Locations |
| 1. | Location-1: JNTU college of Engineering |
| 2. | Location-2: New RTC Bus stand |
| 3. | Location-3: Area hospital |
| 4. | Location-4: Islam puram |
| 5. | Location-5: Parnapalle circle |
| 6. | Location-6: Rishi school |
| 7. | Location-7: Narayana school & Jr. college |
| 8. | Location-8: Rani thopu |
| 9. | Location-9: Old RTC Bus stand |
| 10. | Location-10: Kadiri circle |
| 11. | Location-11: Loyola polytechnic college |
| 12. | Location-12: Bestha vari palle |
| 13. | Location-13: Venkateshwara swami temple |
| 14. | Location-14: Rotary puram |
| 15. | Location-15: Bakara puram |
IV. FINDINGS AND RESULTS
After completion of conducting tests we had noted the results of experiments as follows: V. ANALYSIS
| S.No. | location | pH | Alkalinity | EC | hardness | chlorides | TDS | DO | Fluorides |
| 1. | JNTU college of Engineering | 8.16 | 736 | 2.2 | 1540 | 1320 | 1120 | 3.2 | 1.8 |
| 2. | New RTC Bus stand | 8.32 | 778 | 4.2 | 2845 | 2520 | 2270 | 3.6 | 1.6 |
| 3. | Area Hospital | 7.80 | 754 | 2.6 | 1820 | 1560 | 1405 | 4.0 | 1.8 |
| 4. | Islam Puram | 7.42 | 712 | 2.2 | 1540 | 1320 | 1190 | 4.2 | 2.0 |
| 5. | Parnapalle circle | 6.94 | 496 | 1.1 | 770 | 660 | 595 | 2.4 | 1.2 |
| 6. | Rishi School | 6.90 | 538 | 1.3 | 910 | 780 | 700 | 2.6 | 1.3 |
| 7. | Narayana school & Jr. college | 6.88 | 556 | 1.4 | 985 | 840 | 760 | 3.0 | 1.1 |
| 8. | Rani Thopu | 6.90 | 592 | 1.9 | 1330 | 1140 | 1030 | 4.0 | 1.0 |
| 9. | Old RTC Bus stand | 7.18 | 706 | 2.1 | 1470 | 1260 | 1135 | 5.0 | 1.6 |
| 10. | Kadiri Circle | 6.98 | 646 | 2.0 | 1400 | 1200 | 1080 | 4.4 | 1.8 |
| 11. | Loyola polytechnic college | 7.40 | 700 | 2.0 | 1465 | 1210 | 1085 | 4.8 | 1.48 |
| 12. | Bestha vari Palle | 7.08 | 620 | 1.8 | 1280 | 1080 | 975 | 3.8 | 1.5 |
| 13. | Venkateshwara Swami Temple | 7.26 | 724 | 1.7 | 1190 | 1025 | 920 | 5.6 | 1.58 |
| 14. | Rotary Puram | 6.96 | 598 | 1.8 | 1260 | 1095 | 975 | 4.4 | 1.62 |
| 15. | Bakara Puram | 7.12 | 682 | 2.1 | 1480 | 1260 | 1135 | 4.6 | 1.42 |
5.1 Analysis as per BIS
i. pH
As per BIS standards, the drinking water's pH should range in between 6.5-8.5. pH has no units. Here in this study, pH of all samples lie within the limits. It indicates that, it is safe to drink the water.
{"image_source":{"path":"images/a49eea9b2539b2ed015f973006fccd47d5656a0fb8e0750634d1d9c490a6fc58.jpg"},"content":"","chart_caption":[],"chart_footnote":[]}
ii. Alkalinity
As per BIS standards, Alkalinity always should be less than 500 ppm for drinking water. Here, for all samples collected, the alkalinity value is more than the limit except the Parnapalle location. In Parnapalle location alkalinity is 496 ppm. Usually, alkalinity is measured in mg/l or ppm.
{"image_source":{"path":"images/46420935e546c3bd508e87ea353402fdce520cc59207679ed6a0012e9b51ecc4.jpg"},"content":"","chart_caption":[],"chart_footnote":[]}
iii. Electric Conductivity (EC)
Electric conductivity is expressed in the terms of micro siemens. Drinking water's electric conductivity standard range is . Here, all samples are out of the range.
{"image_source":{"path":"images/73d196030b31bc66cec409cd9ce8987142832aadf54e9f671522d59f390e37bc.jpg"},"content":"","chart_caption":[],"chart_footnote":[]}
iv. Total Hardness
Total hardness refers to concentration of calcium and magnesium salts in water. It is usually expressed in milligram per litre (mg/l) as calcium carbonate. As per BIS standards, total hardness should be less than 200 mg/l. Here, all sample's total hardness is out of the range.
{"image_source":{"path":"images/8b5bf0d4ad25d64b355425748910ae722ed736251bd8d0b9d5f885d52c64e7cf.jpg"},"content":"","chart_caption":[],"chart_footnote":[]}
v. Chlorides
The range of chlorides for safe drinking water is 250-1000mg/l. here, maximum chloride content is 2520 mg/l and the minimum chloride content is 660 mg/l at New RTC Bus stand and Parnapalle circle respectively. Chlorides content in water can be expressed in terms of mg/l.
{"image_source":{"path":"images/dfe10358ec3cd7c07a8b40135b19de5947c1b4dfef93cfdb043491407b91ec86.jpg"},"content":"","chart_caption":[],"chart_footnote":[]}
vi. Total Dissolved Solids
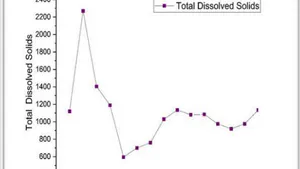
According to BIS standards the maximum limit for drinking water is 500 mg/l. It measured in terms of mg/l. TDS content of all samples are not within the limits. All are out of the limits.
{"image_source":{"path":"images/881f7257818796a9058f8c094e2a9e6794b73c4c3f226cc7155392754bc07a62.jpg"},"content":"","chart_caption":[],"chart_footnote":[]}
vii. Dissolved Oxygen (DO)
As per BIS standards, the DO content should not more than 5 mg/l. But the water with 6-8 mg/l can be treated as well oxygenated water and fresh water. Here, the DO content is within limit for all sample stations except the location – Venkateshwara swami temple. It's DO content is 5.6 mg/l. Dissolved oxygen is expressed in the terms of mg/l.
{"image_source":{"path":"images/76f3d05040677b369e507add0a792c749ebd495fce1bd0e5b392a15b846c39e1.jpg"},"content":"","chart_caption":[],"chart_footnote":[]}
viii. Fluorides
Fluorides is one of the parameters used to assess the overall quality of water. The standard value of fluoride is 1.5 mg/l. Some locations exceeded the limit and some locations are within the range.
{"image_source":{"path":"images/9c560ec1c7df7e3d2d4d5940b6115fab6270454ed868b38a0b45a853e154fcfe.jpg"},"content":"","chart_caption":[],"chart_footnote":[]}
5.2 Water Quality Index (WQI):
The Water Quality Index (WQI) is a numerical tool that combines multiple water quality parameters into a single number to show how suitable water is for drinking. It helps easily access and communicate the overall quality of water based on standards like those from BIS.
Mainly there are five methods. They are:
National Sanitation Foundation Water Quality Index (NSF-WQI)
Oregon Water Quality Index (OWQI)
Weighted Arithmetic Water Quality Index (WAWQI)
Canadian Council of Ministers of the Environment Water Quality Index (CCME-WQI)
Bhargava Water Quality Index (BWQI)
We had used Weighted Arithmetic Water Quality Index (WAWQI) – Key Points
1. Selection of Parameters
2. Assigning Weights (Wn)
Weight (Wn) = K/Sn
Where: K = proportionality constant
Sn = standard permissible value of parameter
3. Calculating Quality Rating (Qn)
Where: Vn = observed value
Vo = ideal value (usually o for most parameters)
standard permissible value
4. Computing Sub-Indices
5. Aggregating the WQI
WQI = Σ(SI) / Σ(Wn)
VI. CONCLUSION
The Water Quality Index (WQI) scale is used to indicate the overall quality of water. It ranges from very poor to excellent based on a single score. It simplifies complex water test results into an easy-to-understand number. Thus, WQI helps quickly assess if water is safe for drinking.
| WQI | Water Quality |
| 0-25 | Excellent |
| 26-50 | Good |
| 51-75 | Poor |
| 76-100 | Very poor |
| 100 | Unfit for drinking |
Water quality of sample stations according to WQI is as follows:
| S.No. | Location | WQI | Quality |
| 1. | JNTU college of Engineering | 130.47 | Unfit for consumption |
| 2. | New RTC Bus stand | 185.24 | Unfit for consumption |
| 3. | Area Hospital | 119.19 | Unfit for consumption |
| 4. | Islam Puram | 87.34 | Very poor |
| 5. | Parnapalle circle | 37.56 | Good |
| 6. | Rishi School | 45.18 | Good |
| 7. | Narayana school & Jr. college | 49 | Good |
| 8. | Rani Thopu | 59.78 | Poor |
| 9. | Old RTC Bus stand | 71.05 | Poor |
| 10. | Kadiri Circle | 58.39 | Poor |
| 11. | Loyola polytechnic college | 82.09 | Very Poor |
| 12. | Bestha vari Palle | 57.04 | Poor |
| 13. | Venkateshwara Swami Temple | 67.02 | Poor |
| 14. | Rotary Puram | 54.32 | Poor |
| 15. | Bakara Puram | 67.21 | Poor |
Quality of water is good enough at all locations except JNTU college, New RTC bus stand and Area hospital other than these 3 locations water is suitable for drinking. For irrigation purposes all water sample's quality is suitable.
As per BIS standards
➢ Ph of all samples are within limits.
➢ Alkalinity of all samples are not within the limits exceeded the limit it causes digestion issues
- Electric conductivity, Hardness, Chlorides content TDS are not within the limits.
➢ Dissolved oxygen content is more than the limit 5 mg/l at Venkateshwara swami temple. Except this samples DO; all are within limits.
Except Parnapalle circle, Rishi school, Narayana school & Junior college, Rani thopu and Bakarapuram are out of the limits. Fluoride content of these 5 locations are within the limits.
ACKNOWLEDGMENTS
The authors sincerely thank the The Department of Civil Engineering and Chemistry utilizing labs which made this research possible. We express our gratitude to the commissioner, Pulivendula Municipality for providing all the necessary facilities and support for this research.
Conflict of Interest
The authors declare no conflict of interest.
Ethical Approval
Not applicable
Data Availability
The datasets used in this study are openly available at [repository link] and the source code is available on GitHub at [GitHub link].
Funding
This work did not receive any external funding.
References
Cite this article
Related Research

Special Issue
Launch a focused special issue to highlight research, emerging trends, and expert insights in your academic field.