

IntelliPaper
Abstract
This study investigates the biodiversity of urban flora in the arid zone of Bukhara, Republic of Uzbekistan. The research is based on newly proposed methods—examining the complexity and potential of flora biodiversity. Additionally, the study employs the biodiversity index, which includes species abundance equalization (the probability of species occurrence) and the Shannon index. This work represents the first attempt to calculate biodiversity complexity and potential indicators for real ecological systems.
The findings indicate that the biodiversity of Bukhara's urban flora is characterized by uneven species abundance. A few tree species (Pinus brutia var. eldarica (Medw.) Silba; Ulmus parvifolia L.; Platycladus orientalis (L.) Franco), shrub species (Rosa chinensis Jacq.; Yucca filamentosa L.), and herbaceous species (Cynodon dactylon L.; Salsola sp.; Coreopsis lanceolata L.; Lolium perenne L.; Setaria viridis (L.) P. Beauv) exhibit significant dominance. The study reveals a high level of complexity but a low potential in the structure of urban flora biodiversity, indicating weak resilience, adaptation, and regeneration capability.
These results suggest that the fundamental principles governing natural biodiversity transformations—lack of identity, unified logic, harmony, purpose, and order—are disrupted within urban ecosystems due to the introduction of subjective logic, harmony, goal orientation, and order.
Explore Digital Article Text
I. INTRODUCTION
This paper summarizes the results of our previous studies on the biodiversity of urban flora in the arid zone of Central Asia, using the city of Bukhara as a case study. These studies employed the floristic systematic grid method. The primary objectives of this research were:
a. Based on scientific data and personal observations, study the modern physical-geographical and ecological characteristics of the city of Bukhara (Republic of Uzbekistan). The territory of Bukhara covers an area of 143 km . The climate is sharply continental and desert-like: winters are very harsh, while summers are hot and dry. The average January temperature is minus 2 degrees Celsius, and in July, it exceeds 40 degrees. The annual precipitation in the Bukhara region ranges from 90–150 mm, mostly in the form of rain. Therefore, Bukhara's territory is classified as an arid zone (Gafarova S.M., Gulamov M.I., 2021).
b. Conduct research and analysis of floral diversity in urban conditions based on field observations and literary data using the city of Bukhara, Republic of Uzbekistan, as a case study. The collected materials were used to systematize the floral diversity of Bukhara, and standard statistical data processing was performed (Gafarova et al., 2024).
Currently, the global discussion on the significance of plant biodiversity for human society is highly pertinent. Life on Earth directly depends on plant biodiversity, which serves as the foundation of existence. Considering the current pace of urbanization worldwide, any research aimed at preserving floral biodiversity is exceedingly necessary. Contemporary ecological situations on the planet confirm this necessity (A Global Standard 2016; Kate 2022; Alves 2024).
Currently, urban areas occupy a small fraction of Earth's surface; some estimates suggest less than 0.1% of the total land area. However, their impact extends over significant distances. It has been calculated that of urban system consumes 70 times more energy than the corresponding area of a natural ecosystem. To provide food for an urban population of 1 million people, approximately 0.8 million hectares of arable land are required. Cities affect the environment not only as consumers of energy, organic matter, and oxygen but also as powerful sources of pollution (Conservation and Restoration of Biodiversity, 2002).
Vegetation is a fundamental component of urban ecosystems, playing a crucial role in the lives of city residents. The functions of plants in urban areas are diverse and include: Improving the urban microclimate, Food production, Regulating air composition, Absorbing dust and toxic substances, Reducing noise levels, Enhancing the aesthetic appearance of the city and Providing spaces for recreation. In ecosystems, plants play a leading role as sources of food and oxygen, creating conditions for life and shelter for other organisms (Conservation and Restoration of Biodiversity, 2002; Ceplová et al. 2017 a,b; Tretyakova et al. 2018; Jovanović, Glišić, 2021).
One of the pressing issues in this field is the development of methods to study the biodiversity of urban flora in arid zones under urban conditions, aiming to preserve and enhance its floristic structure. The biodiversity of urban flora serves as the foundation that shapes the landscape of urban planning (Christenhusz et al., 2011). Investigating the biodiversity of urban flora requires examining its elementary floristic unit at the regional level (minimum range), species composition, species density (Gafarova et al., 2024), and levels of complexity and capacity. Assessing the complexity and capacity of floristic diversity in urban zones will help determine whether the current levels and rates of urbanization are safe for the ecosystems in question. The concepts of complexity and capacity indicators in biodiversity studies were first introduced by M.I. Gulamov (2017b, 2023).
Biodiversity is a fundamental property of ecosystems, reflecting their complexity and structure. Species diversity determines the complexity of structure and the power of ecosystems (Brodsky, 2002; Lebedeva, Krivolutsky, 2002).
In natural conditions, any ecosystem strives for balance and stability. Moreover, the more complex the ecosystem—i.e., the higher its level of diversity—the more likely it is to maintain stability over time and space (Nikolaikin et al., 2003).
The level of complexity implies the presence of multiple forces in equilibrium. If there is only one force, it is meaningless to talk about its balancing. In this context, complexity is a balanced diversity or a hierarchically complex structure.
The natural increase in species diversity leads to intensified competition among species, reducing the distance between them and increasing mutual pressure. As a result, specialization occurs in biomes, ecosystems, and communities, leading to the differentiation of ecological niches.
Complexity (trade-off) is meaningful only in the presence of diversity. Without diversity, trade-offs are impossible.
Capacity refers to the rate at which work is performed, energy is transferred, or a response is made. In mathematics, the capacity of a set is a characteristic that generalizes the concept of the number of elements in a finite set. This concept is based on natural ideas about comparing sets. If we replace the set of biological species in a specific ecosystem with the concept of biodiversity in that ecosystem, it becomes quite natural to talk about the capacity of biodiversity.
Based on these concepts, the phrase "capacity of diversity (biodiversity)" can be defined as a magnitude characterizing the potential response of diversity (biodiversity) to external forces.
In the context of this work, it is appropriate to consider the capacity of biodiversity as a measure characterizing the potential response of an ecosystem to external factors. To better understand this indicator, an analogy can be drawn with the capacity of a plant.
A plant's capacity is determined by the rate at which it produces oxygen, absorbs carbon dioxide, or purifies the surrounding environment. In this context, the capacity of a tree surpasses that of a shrub or herbaceous cover.
However, when discussing the capacity of biodiversity in the plant world of a specific ecosystem, we are referring not to the capacity of an individual plant species, but rather to the indicator of the overall viability potential of the entire ecosystem. The capacity of plant biodiversity is not simply the sum of the capacities of individual species, but the ability of the ecosystem to sustain functioning, adapt, and recover.
The question of the equivalence of the capacity of biodiversity in trees, shrubs, and grasses is important and requires careful consideration. From the perspectives of physics and biology, the capacity of biodiversity in these plant groups is not equivalent, as their ecological roles and adaptation abilities differ.
Trees, shrubs, and grasses occupy different vegetation layers and perform various ecological functions. Trees form the upper layer, shrubs the middle layer, and herbaceous plants the lower layer. These differences affect their ability to perform photosynthesis, absorb carbon dioxide, and produce oxygen. For example, trees, due to their height and structure, can absorb more carbon dioxide and produce more oxygen compared to shrubs and grasses. Additionally, trees play a key role in climate formation, soil erosion protection, and creating conditions for the habitat of other organisms. Shrubs and grasses also perform important functions, but their impact on the ecosystem differs.
Thus, calculating the capacity of biodiversity for these groups of plants separately is plausible and justified, as their ecological roles and adaptation abilities differ.
The calculation of complexity and capacity indicators for biodiversity is an important tool for assessing and monitoring biodiversity in natural ecosystems. It allows for the determination of the state of the ecosystem, the exploration of its structure, and aids in the development of strategies for conserving species diversity.
This issue is of great significance, as without studying the capacity of biodiversity in the researched geographical landscape (regardless of the scale of the territory), any planning of economic activities can lead to irreversible ecological consequences. All existing ecological disasters on a global scale today are the result of such thoughtless approaches (Brodsky, 2002; Conservation and Restoration of Biodiversity, 2002).
Any activities conducted must take into account the complexity and capacity of the biodiversity of the studied landscape to avoid the emergence of new, more global ecological problems.
The goal of this work is to study the evenness of species abundance, the Shannon index, the complexity, and the capacity of biodiversity in the urban flora of the city of Bukhara, Republic of Uzbekistan, as well as to analyze the results obtained. In the course of the study, we rely on species biodiversity data presented in the work of S.M. Gafarova et al., 2024.
Species abundance evenness is an important tool for assessing the structure of communities in different ecosystems. This method allows for identifying patterns in the distribution of species, determining key species that play an important role in the ecosystem, and tracking changes in the community over time.
1.1 Community structure assessment
Comparing species abundance across different locations or time periods helps identify changes in community composition. This is useful for monitoring the impact of anthropogenic factors, such as climate change or urbanization, on biodiversity.
1.2 Identifying keystone species:
Keystone species have a significant impact on the structure and functioning of an ecosystem. They can regulate the population sizes of other species, influence the physical habitat, and contribute to species diversity. Their removal can lead to substantial changes within the ecosystem.
1.3 Analyzing ecological trends
Species abundance evenness allows for tracking community changes, identifying trends, and predicting potential ecological consequences. This is particularly important for developing biodiversity conservation strategies and the sustainable use of natural resources.
Thus, species abundance evenness is a powerful tool for understanding ecosystem dynamics, identifying keystone species, and assessing the impact of various factors on biodiversity.
II. MATERIALS AND METHODS
From 2021 to 2024, a study was conducted to investigate the biodiversity of the urban flora in the arid zone of Bukhara city, Republic of Uzbekistan. The results of this research were published in 2021 and 2024 (Gafarova, Gulamov, 2021; Gafarova et al., 2024). This was the first such detailed study of the urban flora biodiversity of Bukhara city.
The aim of these works was to utilize the minimal area method, which involves a sample plot that allows for a general characterization of a specific flora. The study relied on data from personal observations, the cadastral map of Bukhara city (Gafarova, Gulamov, 2021), the Bukhara city beautification department, as well as data from H.K. Esanov (Esanov, 2016a,b; Esanov, Sharipova, 2020).
During the study, an area of was surveyed, representing approximately 1.5% of the total vegetative cover of Bukhara city, which, according to cadastral data, amounts to . For a more detailed understanding, the vegetative cover of Bukhara city comprises , including (Gafarova, Gulamov, 2021):
Green plantation areas: 954,500 m
Annual plantings: 1,034,000 m
Perennial plantings: 126,000 m
Other types of green spaces: 835,600 m
The total number of trees in Bukhara city is 2,536,500, according to the city's cadastral data.
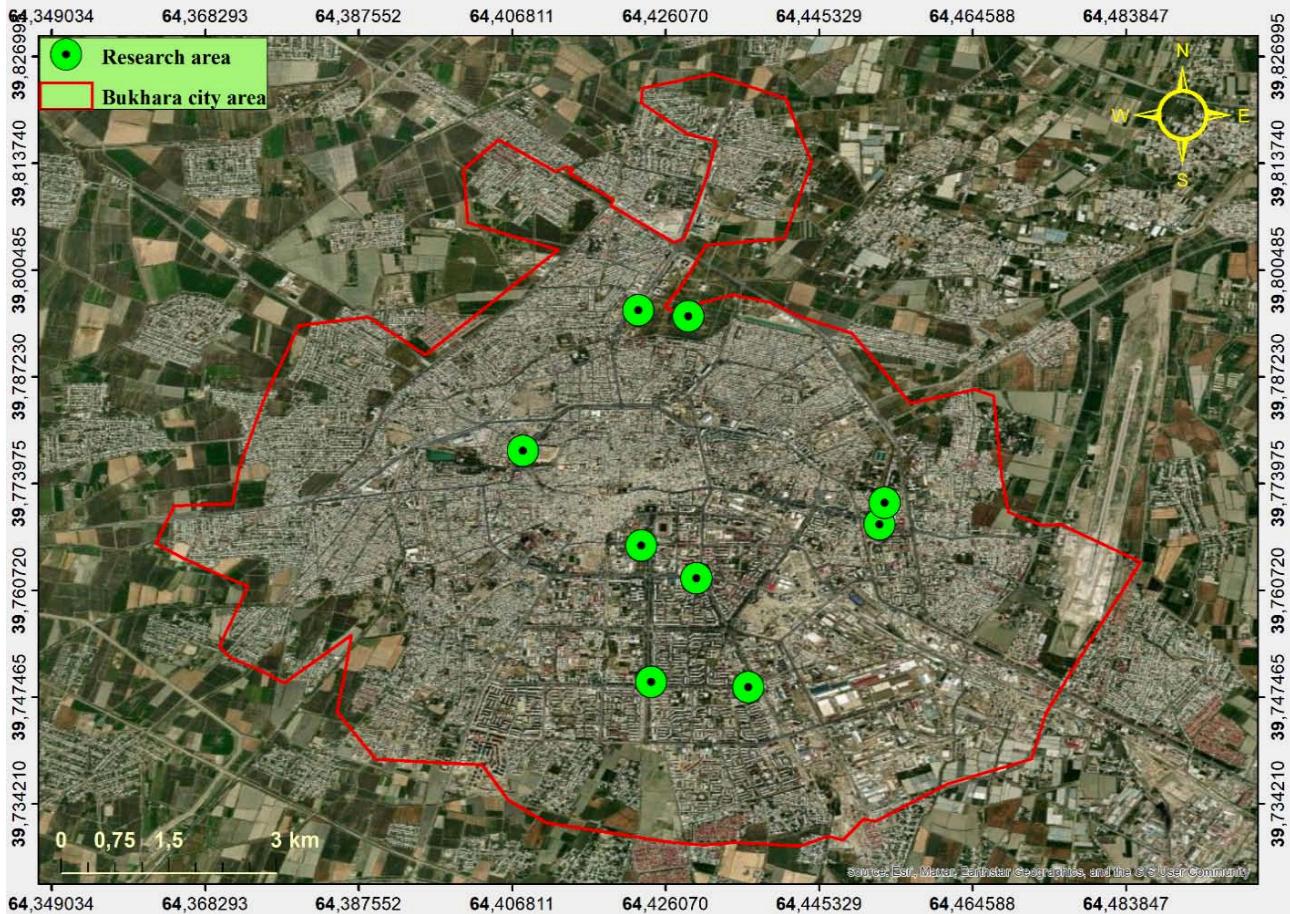
The study encompassed a significant portion of the city's vegetative cover, providing representative data on the urban flora biodiversity of Bukhara. Assessments were conducted across 45 sample plots situated in various parts of Bukhara city—including the northern area (Gijduvan Street), southern area (Navoi Avenue and Piridastgir Street), western area (Khavzi Bodom Street), eastern area (B. Naqshband Street), and central areas (I. Muminov Street, Mustaqillik Street, and M. Iqbol Street)—to ensure maximum representativeness of the urban flora (Gafarova et al., 2024) (Figure 1).
During the study of the urban flora biodiversity in Bukhara city, sample plots measuring 1,000 m (35×30 m or 50×20 m) were selected for field research. This plot size was chosen to facilitate the analysis of species biodiversity data across the entire city.
The minimal area method, where the study area represents a sample plot that characterizes a specific flora, is an effective tool for assessing biodiversity. It provides representative data on the composition and structure of vegetation within a limited area, which is particularly useful in urbanized landscapes.
The choice of sample plot size depends on the research objectives, characteristics of the study area, and available resources. In some cases, smaller plots, such as , may be used for detailed biodiversity analysis. However, to obtain more comprehensive data on vegetation over larger areas, using plots of may be more appropriate.
It is important to note that selecting the size of sample plots should consider the specific characteristics of the ecosystem under study, resource availability, and research objectives. In urbanized areas like
Bukhara city, utilizing 1,000 m plots enables effective characterization of the flora and provides data that can be used to assess the state and dynamics of vegetation at the city level.
During the study of the urban flora biodiversity in Bukhara city, detailed floristic descriptions of the surveyed plots were conducted, quantifying the presence of species across different life forms using standard methodologies. Additionally, for each tree, morphometric parameters of the trunk and crown were measured, and their vitality was assessed.
A biodiversity index is a quantitative measure that reflects the variety of species in a specific area or ecosystem. Several methods exist for calculating biodiversity indices, such as the Shannon index, Simpson's index, Pielou's index, and others. These indices can account for various parameters, including species richness, evenness, and relative abundances (Magurran, 1992; Odum, 1986; Geography and Monitoring of Biodiversity, 2002; Gulamov, 2017 b; Gulamov, 2022 a, b).
The Shannon index is a quantitative measure that characterizes the diversity of species in a specific area or ecosystem. A higher value of the index indicates a more diverse and evenly distributed species composition within the ecosystem. This index allows for comparisons of biodiversity across different ecosystems or for tracking changes in biodiversity within the same ecosystem over time.
The formula for calculating the Shannon index includes the frequency of occurrence of each species in the ecosystem. A more even distribution of species leads to a higher Shannon index value, while the dominance of one or a few species results in a lower value.
Calculating the complexity indicator, aligning species abundance (probabilities of species occurrence) and the Shannon index for the biodiversity of the urban flora in the arid zone of Bukhara city, Uzbekistan, will be conducted following the methodology presented in the work of M.I. Gulamov (2017b, 2022a, 2023).
The values of the complexity indicator and the capacity (M) of biodiversity for the study of real ecological systems are calculated for the first time. The complexity indicator serves a theoretical purpose for assessing the complexity level of an ecological system. In contrast, the capacity (M) of biodiversity has a practical application and evaluates the potential viability of the ecosystem.
Since the and M indicators are being calculated for the first time based on real data, it is challenging to assess them accurately. To evaluate the M indicator, we will use the "first approximation" table provided by M.I. Gulamov (2023).
| 0-0.25 | Low Capacity of Biodiversity |
| 0,25-0,5 | Approaching the Average Capacity of Biodiversity |
| 0,5-0,75 | Above Average Capacity of Biodiversity |
| 0,75-1,0 | High Capacity of Biodiversity |
Complexity Indicator (Gulamov, 2017):
, where number of species of urban flora in the studied area. Maximum value .
Species Occurrence Frequency Probability and Shannon Index (Magurran, 1992; Gulamov, 2022):
, where number of individuals (Ni) of the ith species, S-total number of individuals of all species ( ).
Shannon Index ( ):
, where - probability of occurrence of the - th species ( ).
Capacity of Biodiversity (M) (Gulamov, 2023)
, where N-number of species of urban flora, S-total number of individuals of all species
Based on the data on the biodiversity of the urban flora of Bukhara city presented in our previous work (Gafarova et al., 2024), we will calculate, using the aforementioned methodology, the frequency of species occurrence , the complexity indicator , the Shannon index , and the capacity of biodiversity.
The results of our calculations for the biodiversity of trees, shrubs, and herbs (species occurrence probability , complexity indicator , Shannon index , and capacity of biodiversity) are presented in Tables 2, 3, and 4.
| No | Plant Name | ||
| 1 | Albizia julibrissin Durazz. | 46 | 0,0101 |
| 2 | Ailanthus altissima (Mill.) Swingle | 82 | 0,0180 |
| 3 | Acer negundo L. | 14 | 0,0031 |
| 4 | Aesculus hippocastanum L. | 17 | 0,0037 |
| 5 | Catalpa bignonioides Walter | 107 | 0,0235 |
| 6 | Cydonia oblonga Mill. | 38 | 0,0084 |
| 7 | Cupressus arizonica Greene | 41 | 0,0090 |
| 8 | Elaeagnus angustifólia L. | 18 | 0,0040 |
| 9 | Fagus orientalis Lipsky | 3 | 0,0007 |
| 10 | Fraxinus lanceolata Borkh. | 171 | 0,0376 |
| 11 | Gleditsia triacanthos L. | 41 | 0,0090 |
| 12 | Juniperus virginiana L. | 114 | 0,0251 |
| 13 | Juglans regia L. | 1 | 0,0002 |
| 14 | Morus alba L. | 215 | 0,0473 |
| 15 | Morus rubra L. | 265 | 0,0583 |
| 16 | Morus nigra L. | 45 | 0,0099 |
| 17 | Malus domestica Borkh. | 30 | 0,0066 |
| 18 | Maclura pomifera (Raf) C.K.Schneid | 25 | 0,0055 |
| 19 | Paulownia tomentosa (Thunb.) Steud. | 42 | 0,0092 |
| 20 | Pinus brutia var. eldarica (Medw.) Silba | 886 | 0,1948 |
| 21 | Pinus nigra J.F.Arnold | 10 | 0,0022 |
| 22 | Pinus nigra subsp. Pallasiana (Lamb.) Holmboe | 238 | 0,0523 |
| 23 | Picea pungens Engelm. | 3 | 0,0007 |
| 24 | Populus alba L. | 39 | 0,0086 |
| 25 | Populus bachofenii Wierzb. Ex Rochel | 104 | 0,0229 |
| 26 | Platanus orientalis L. | 54 | 0,0119 |
| 27 | Platycladus orientalis (L.) Franco | 557 | 0,1225 |
| 28 | Prunus avium L. | 52 | 0,0114 |
| 29 | Prunus persica (L.) Batsch | 8 | 0,0018 |
| 30 | Prunus cerasus L. | 49 | 0,0108 |
| 31 | Prunus armeníaca L. | 68 | 0,0150 |
| 32 | Prunus domestica L. | 3 | 0,0007 |
| 33 | Prunus communis L. | 5 | 0,0011 |
| 34 | Robinia pseudoacacia L. | 5 | 0,0011 |
| 35 | Quercus robur L. | 54 | 0,0119 |
| 36 | Salix alba L. | 22 | 0,0048 |
| 37 | Salix excelsa S.G. Gmel | 8 | 0,0018 |
| 38 | Salix babylonica var.tortuosa x alba var.recticapus (S.X` Sverdlovskaja Isvilistaja 2` V.Schaburov et l. Beljaeva) | 4 | 0,0009 |
| 39 | Styphnolobium japonicum (L.) Schott | 68 | 0,0150 |
| 40 | Tilia cordata Mill. | 22 | 0,0048 |
| 41 | Thuja occidentalis L. | 50 | 0,0110 |
| 42 | Ulmus parvifolia L. | 824 | 0,1812 |
| 43 | Ulmus densa Litv. | 100 | 0,0220 |
| Total (S) | 4548 | ||
| Value of the Complexity Coefficient Function ( ) | 0,9767 | ||
| Value of the Shannon Index ( ) | 2,8267 | ||
| Value of the Capacity of Biodiversity (M) | 0,0095 | ||
| Level of Capacity of Biodiversity according to Table 1: | Low Level of Capacity of Biodiversity | ||
| No | Plant Name | ni | Pi |
| 1 | Tamarix ramosissima Ledeb. | 5 | 0,0039 |
| 2 | Caesalpinia gilliesii (Wall. Ex Hook.) D.Dietr. | 5 | 0,0039 |
| 3 | Catharanthus roseus (L.) G.Don | 12 | 0,0093 |
| 4 | Euonymus japonicas Thunb. | 36 | 0,0280 |
| 5 | Ficus carica L. | 22 | 0,0171 |
| 6 | Hibiscus syriacus L. | 2 | 0,0016 |
| 7 | Jacobaea maritima (L.) Pelser & Meijden | 35 | 0,0272 |
| 8 | Ligustrum vulgare L. | 152 | 0,1181 |
| 9 | Lagerstroemia indica L. | 3 | 0,0023 |
| 10 | Lonicera japonica Thunb. | 2 | 0,0016 |
| 11 | Lycium ruthenicum Murray | 3 | 0,0023 |
| 12 | Mahonia aquifolium (Pursh) Nutt. | 3 | 0,0023 |
| 13 | Parthenocissus quinquefolia (L.) | 20 | 0,0155 |
| 14 | Punica granatum L. | 5 | 0,0039 |
| 15 | Rosa chinensis Jacq. | 409 | 0,3178 |
| 16 | Rosa canina L. | 86 | 0,0668 |
| 17 | Ribes nigrum L. | 23 | 0,0179 |
| 18 | Spartium junceum L. | 7 | 0,0054 |
| 19 | Vitex agnus-castus L. | 3 | 0,0023 |
| 20 | Vitis vinifera L. | 49 | 0,0381 |
| 21 | Yucca filamentosa L. | 405 | 0,3147 |
| Total (S) | 1287 | ||
| Value of the Complexity Coefficient Function (Cd) | 0,9524 | ||
| Value of the Shannon Index (H) | 1,9031 | ||
| Value of the Capacity of Biodiversity (M) | 0,0163 | ||
| Level of Capacity of Biodiversity according to Table 1: | Low Level of Capacity of Biodiversity | ||
| No | Название растений | на м2 | ni | Pi |
| 1 | Alhagi kirghisorum Schrenk | 1-2 | 67499 | 0,0023 |
| 2 | Achillea millefolium L. | 2-3 | 112498 | 0,0037 |
| 3 | Aconogonon divaricatum (L.) Nakai ex Mori | 2-3 | 112498 | 0,0037 |
| 4 | Alcea rosea L. | 1-2 | 67499 | 0,0023 |
| 5 | Althaea officinalis L. | 2-3 | 112498 | 0,0037 |
| 6 | Amaranthus tuberculatus (Moq.) Sauer | 4-5 | 202496 | 0,0067 |
| 7 | Amaranthus viridis L. | 18-20 | 854981 | 0,0284 |
| 8 | Amaranthus retroflexus L. | 5-6 | 247495 | 0,0082 |
| 9 | Anagallis arvensis L. | 16 | 0.0000 | |
| 10 | Anchusa azurea Mill. | 2-3 | 112498 | 0,0037 |
| 11 | Arctium leiospermum Juz. et Ye. |
V. Serg. 1-2 67499 0,0023 12 Artemisia absinthium L. 3-4 157497 0,0052 13 Artemisia annua L. 12 539988 0,0179 14 Artemisia vulgaris L. 4-5 202496 0,0067 15 Aster amellus L. 5-6 247495 0,0082 16 Asperugo procumbens L. 18-20 854981 0,0284 17 Atriplex micrantha C.A. Mey. 17-18 787483 0,0261 18 Atriplex tatarica L. 13 584987 0,0194 19 Bromus tectorim L. sümupbou 6-7 292494 0,0097 20 Bassia hyssopifolia (Pall.) Kuntze 4-5 202496 0,0067 21 Bassia scoparia f. Trichophylla (hort. ex Voss) S. L. Welsh) 2-3 112498 0,0037 22 Calendula officinalis L. 3-4 157497 0,0052 23 Camelina microcarpa Andrz. ex DC. 1-2 67499 0,0023 24 Canna generalis L.H. Bailey & E.Z. Bailey 98 0.0000 25 Capsella bursa-pastoris subsp. thracicus ( ) & 19-20 877481 0,0293 26 Cardaria repens (Schrenk) Jarm. 13-14 607487 0,0210 27 Centaurea solstitialis L. 1-2 67499 0,0023 28 Cirsium vulgare (Savi) Ten. 2-3 112498 0,0037 29 Chenopodium album L. 18 809082 0,0268 30 Convonvulus arvensis L. 7-8 337493 0,0112 31 Coreopsis lanceolata L. 21-22 967479 0,0321 32 Cuscuta Lehmanniana L. 4-5 202496 0,0067 33 Cynodon dactylon L. 22 989978 0,0329 34 Cyperus rotundus L. 10-11 472490 0,0157 35 Cynanchum acutum L. 3-4 157497 0,0052 36 Cynanchum sibiricum Willd. 2-3 112498 0,0037 37 Cichorium intybus L. 1-2 67499 0,0023 38 Chrysanthemum x koreanum Hort. 5-6 247495 0,0082 39 Cucurbita pepo L. 2-3 112498 0,0037 40 Datura innoxia Mill. 5 0.0000 41 Descurainia Sophia L. 25 1124975 0,0374 42 Echinochloa crus-galli (L.) P.Beauv. 5-6 247495 0,0082 43 Eregeron bonariensis L. 2-3 112498 0,0037 44 Erigeron canadensis L. 1-2 67499 0,0023 45 Gelosia cristata L. 2-3 112498 0,0037 46 Geranium pusillum L. 1-2 67499 0,0023 47 Helianthus annuus L. 30 0.0000 48 Heliopsis helianthoides Summer Night 12-13 562488 0,0187 49 Hordeum bulbosum L. 30 1349970 0,0449 50 Lactuca serriola L. 5-6 247495 0,0082 51 Lactuca tatarica (L.) C.A. Mey. 10 449990 0,0150 52 Lathyrus aphaca L. 1 44999 0,0015 53 Lamium amplexicaule L. 5 224995 0,0075 54 Lepidium latifolium L. 2-3 112498 0,0037 55 Lepidium ruderale L. 3-4 157497 0,0052 56 Leuzea repens (L.) D.J.N.Hind. 3-4 157497 0,0052 57 Lolium perenne L. 21 944979 0,0314 58 Malva neglecta Wallr. 5-6 247495 0,0082 59 Medicago sativa L. 8-10 404991 0,0134 60 Melilotus officinalis (L.) Mill. 12-13 562488 0,0187 61 Melilotus albus Medik. 1-2 67499 0,0022 62 Mentha asiatica Boriss. 7-8 337493 0,0112 63 Mirabilis jalapa L. 5-6 247495 0,0082 64 Ocimum basilicum L. 15-16 697485 0,0232 65 Peganum harmala L. 1 44999 0,0015 66 Portulaca oleracea L. 7-8 337493 0,0112 67 Portulaca grandiflora Hook. 1-2 67499 0,0022 68 Panicum miliaceum L. 7-8 337493 0,0112 69 Phaseolus vulgaris L. 3-4 157497 0,0052 70 Phragmites australis (Cav.) Trin. ex Steud. 5-6 247495 0,0082 71 Plantago lanceolata L. 7-8 337493 0,0112 72 Plantago major L. 5-6 247495 0,0082 73 Poligonum argurocoleon Steud. ex G. Kuntze 2-3 112498 0,0037 74 Polygonum aviculare L. 16-17 742484 0,0247 75 Potentilla supine L. 2-3 112498 0,0037 76 Ricinus communis L. 1 44999 0,0015 77 Rorippa sylvestris (L.) Bess. 1-2 67499 0,0023 78 Symphyotrichum graminifolium (Spreng.) G.L.Nesom 5-6 247495 0,0082 79 Symphyotrichum novi-belgii (L.) G.L. Nesom 4-5 202496 0,0067 80 Schoenoplectiella mucronata (L.) J. Jung 2-3 112498 0,0037 81 Stelarria media (L.) Vill. 11-12 517489 0,0172 82 Seteria viridis (L.) P.Beauv 20-21 922480 0,0307 83 Sisymbrium irio L. 15 674985 0,0224 84 Sonchus arvensis L. 2-3 112498 0,0037 85 Tagetes patula L. 19-20 877481 0,0292 86 Taraxacum bicorne Dahlst 8-9 382492 0,0127 87 Tribulus terrestris L. 3-4 157497 0,0052 88 Trifolium pratense L. 10-11 472490 0,0157 89 Trifolium repens L. 10-15 562488 0,0186 90 Veronica polita Fr. 7-8 337493 0,0112 91 Xanthium albinum (Widd.) Scholz-Sukopp 1-2 67499 0,0023 92 Zínnia elegans Jacq. 13-14 607487 0,0202 93 Zygophyllum oxianum Boriss. 2-3 112498 0,0037 Total (S) 30081117 Value of the Complexity Coefficient Function ( ) 0.9892 Value of the Shannon Index ( ) 4,1348 Value of the Capacity of Biodiversity (M) 0,0000 Level of Capacity of Biodiversity according to Table 1: Low Level of Capacity of Biodiversity
{"image_source":{"path":"images/e375fdd6f9b72ae54dd17a9c93c891f0d5e828b3f8176e63735a6973b7afda88.jpg"},"content":"","chart_caption":[{"type":"text","content":"Fig. 2: Graphical representation of the frequency of occurrence of tree species in the urban flora of Bukhara city, RUz. The evenness of species abundance is absent."}],"chart_footnote":[]} {"image_source":{"path":"images/fc1bf27a45f7f991cb407c295e229149c159be06ff2e35d522a49b1540bca015.jpg"},"content":"","chart_caption":[],"chart_footnote":[]}
{"image_source":{"path":"images/5c973b373b2c961b66f53b1c73ca29ecfecc8c8f86963f3faad50993e0ed3957.jpg"},"content":"","chart_caption":[{"type":"text","content":"Fig. 3: Graphical representation of the frequency of occurrence of shrub species in the urban flora of Bukhara city, RUz. The evenness of species abundance is absent."}],"chart_footnote":[]}
III. DISCUSSION OF RESULTS
Our analysis of the biodiversity of Bukhara city's urban flora reveals:
Uneven distribution of species abundance: Dominance of several tree species (Pinus brutia var. eldarica, Ulmus parvifolia, Platycladus orientalis), shrub species (Rosa chinensis, Yucca filamentosa), and herb species (Hordeum bulbosum L.; Descurainia Sophia L.; Seteria viridis (L.) P.Beauv; Coreopsis lanceolata L).
Relatively high complexity index : Indicating diversity of life forms within the community.
Low Shannon index : Suggesting a low level of biodiversity.
Low capacity (M) of biodiversity: Indicating the ecosystem's limited ability to support species diversity.
These results are presented in Tables 2, 3, 4 and Figures 2, 3, 4.
If we perceive the complexity index as a compromise between species, then its relatively high level indicates a balanced coexistence of species in the community (Gulamov, 2017 b). This means that species are in a state of dynamic equilibrium, where each species occupies its ecological niche, minimizing competition and contributing to the stability of the ecosystem.
In addition, a high level of the complexity index indicates a low level of combination of environment-forming ecological factors. Environment-forming factors, such as various types of flora, form non-stationary scalar ecological survival fields that determine the conditions for the existence and development of species (Gulamov, 2021). In urban ecosystems, where environmental conditions are often variable and subject to anthropogenic influences, such survival fields can be unstable, which affects the structure and dynamics of vegetation.
Thus, at a low level of capacity (M) of biodiversity and relatively high values of the complexity index , an ecological tolerance zone is created. This means that there is an acceptable combination of species in this community that are able to survive and coexist in urbanized environments. However, such a situation may also indicate a decrease in the ecosystem's resistance to external influences and the need to take measures to maintain and restore it.
| N | S | M | |||
| Shrubs | 22 | 1287 | 0,9524 | 1,9031 | 0,0163 |
| Trees | 43 | 4548 | 0,9767 | 2,8267 | 0,0095 |
| Herbs | 93 | 30081117 | 0,9892 | 4,1348 | 0,0000 |
From the data in Table 5, it is evident that the tendency of the value of the indicator M to a minimum relative to the values of and is explained by the fact that in these life forms of plants, the tendency of the ratio N/S to a minimum, that is, the tendency of the value of N to a minimum and the value of S to a maximum. This condition is especially characteristic of herbs (the value of S is too high). The convergence of the values of N and S can lead to an increase in the value of M and to the equalization of the abundance of species in all life forms of plants.
Since is the number of individuals of the i-th species, and is the probability (frequency of occurrence) of the i-th species, which is a discrete random variable, the Shannon index can be taken as the entropy defined by the Boltzmann formula (Stratonovich, 1975):
With this approach, the increase in the number of species (N) and the total number of individuals of all species (S), respectively, leads to an increase in the values of the complexity index and entropy (a measure of disorder) , while the value of their capacity (M) decreases accordingly. A consequence of complication is an increase in entropy, which, in turn, after a certain time, leads to structural disintegration, that is, the potential (capacity) of the ecosystem to resist external influences is minimized. This scenario of events is natural.
The advantage of complexity and capacity indicators of biodiversity compared to the Shannon index is that, for calculating complexity and capacity indicators of biodiversity, unlike the Shannon index, only the number of species (N) and the sum of individuals of all species (S) of biodiversity are needed. At the same time, for the Shannon index, in addition to the number of species (N) and the sum of individuals of all species (S) of biodiversity, an additional calculation of the probability of occurrence frequency
for each species of biodiversity is required, which requires significant time and labor costs. Nevertheless, each of the indicators we consider only complements each other when analyzing the species biodiversity of the flora.
If the tree, shrub, and herb species under consideration (listed in Tables 2, 3, and 4) were in natural conditions, there would be a high probability of their extinction. However, since they are part of the urban flora, their artificial support ensures their existence. All urban floras are artificially maintained, similar to agriculture.
In the city of Bukhara, as in other cities, urban services are engaged in maintaining and renewing vegetation, including trees, shrubs, and herbs. These plants beautify the urban landscape until they require replacement or renewal. This practice is part of the city's policy on landscaping and maintaining public amenities.
Based on the results we obtained, it can be asserted that further development of the city's construction without a significant improvement in the biodiversity of Bukhara's urban flora is practically impossible. Currently, life in Bukhara during the summer becomes unbearable. It is necessary to create green corridors between buildings with diverse plant species.
A characteristic principle for natural ecosystems is the absence of identity, a unified logic, harmony, purpose, and order (Gulamov, 2016). In urban ecosystems, this principle is violated, since a subjective logic, harmony, purpose, and order are introduced into them. This is the main reason for the above-mentioned results for the indicators: , , and M.
The low level of biodiversity capacity observed in all studied objects is characteristic of any urban flora. Given that the number of species in urban ecosystems is often determined by subjective factors, the results we obtained are quite plausible.
To achieve optimal values of indicators , , and M, which increase the resilience and capacity of urban flora biodiversity in resisting external environmental impacts, it is necessary to strive for a convergence of the number of species (N) and the sum of individuals of all species (S). In other words, increasing the number of species and reducing the number of individuals of each species contributes to increasing the stability of the ecosystem. This approach is supported by research, for example, the work of Galina Yu. Morozova (2024), which notes that the use of population research methods makes it possible to select species adapted to the stresses of urbanization and create ecologically stable plantings.
IV. CONCLUSION
From a botanical point of view, the biodiversity capacity of trees, shrubs, and herbs is different, so they should be evaluated separately for more accurate analysis. This approach allows taking into account the characteristics of each group of plants and their contribution to the ecosystem.
The calculation of complexity and capacity indicators of flora biodiversity is an important tool for assessing and monitoring biodiversity in natural ecosystems. These indicators help to determine the degree of species diversity, their evenness, and the overall condition of the ecosystem, which is important for developing effective measures for the conservation and restoration of natural communities.
Equalizing the abundance of species is an important tool for assessing the structure of a community in different ecosystems. This indicator allows determining the degree of uniformity in the distribution of individuals among species, which helps to identify key species that play an important role in ecosystems. In addition, the analysis of the equalization of species abundance contributes to the identification of ecological trends or changes over time, which is important for monitoring the state of ecosystems and developing effective measures for their conservation and restoration.
The analysis of urban flora biodiversity in the arid zone of Bukhara city revealed the following features:
a. Uneven abundance of species : The dominance of several species of trees, shrubs, and herbs is observed, which indicates a low level of evenness in the distribution of species in the community.
b. High level of complexity : The presence of a significant number of species and their interactions indicates a complex structure of the community, which indicates a balance in the coexistence of species.
c. Shannon Index : The biodiversity of herbs is twice as high as that of trees and three times higher than that of shrubs, which reflects the higher diversity of the herbaceous layer compared to the tree and shrub layers.
d. Capacity indicator (M): A low level of capacity indicates a limited stability of functioning, adaptation, and recovery of the urban flora of Bukhara city.
To increase the resilience and adaptability of urban flora, the following is recommended: Increasing species diversity: The introduction of additional plant species can contribute to increasing the stability of the ecosystem. Creation of green corridors: The development of green spaces between buildings helps to improve the microclimate and increase biodiversity. Monitoring and management of vegetation health: Regular checks on plant health and timely intervention to prevent diseases and pests help maintain a balance between the number and area of species. The application of these measures will help achieve a more balanced distribution of species and increase the biodiversity of the urban flora of Bukhara city.
A characteristic principle for natural ecosystems is the absence of identity, a unified logic, harmony, purpose, and order. In urban ecosystems, this principle is violated, since a subjective logic, harmony, purpose, and order are introduced into them.
ACKNOWLEDGMENTS
Conflict of Interest
The authors declare no conflict of interest.
Ethical Approval
Not applicable
Data Availability
The datasets used in this study are openly available at [repository link] and the source code is available on GitHub at [GitHub link].
Funding
This work did not receive any external funding.
References
Cite this article
Related Research


Special Issue
Launch a focused special issue to highlight research, emerging trends, and expert insights in your academic field.