


Abstract
Insulin glargine and degludec represent the second-generation basal insulins invented to fill in a clinical need for the insulin which matches the normal pattern of insulin secretion as closely as possible. Both insulins showed reduced rates of hypoglycaemia in real-world patients compared to the first-generation basal insulins. However, according to several studies, decludec demonstrated superiority in reaching optimal fasting plasma glucose targets without increasing risk of nocturnal hypoglycaemia. The aim of this study is to compare the efficacy and safety parameters of insulin degludec versus insulin degludec.
Explore Digital Article Text
Objectives
Assess which of the two basalinsulins (IDeg and IGlar) is associated with less glycaemic variability (less overall and nocturnal hypoglycaemia episodes).
Compare the hypoglycaemic effect of IDeg and IGlar through the reduction of fasting plasma glucose (FPG) levels and HbA1c.
Compare the extent of body weight gain observed during the treatment with IDeg versus IGlar.
Evaluate and compare the levels of antibodies cross-reacting with human insulin after the treatment with IDeg versus IGlar.
The research question and objectives will be tested through the critical literature review, quantitative analysis of secondary data. With the purpose of analyzing the existing knowledge on the research topic, the dissertation will conduct the search through Medline, Embase, Clinicaltrials.gov, Clinicaltrialsregister.eu, Google Scholar databases in the Literature Review Chapter. The Methodology chapter includes research design and strategy, research philosophy, ontology and epistemology, data collection and analysis, critical quality and ethical appraisal of the validity and reliability of the resourced studies.
The Discussion Chapter includes discussion of the main findings, analysis and interpretation of the results obtained through the statistical analysis. In addition to this, strengths and limitations of the conducted meta-analysis will be examined and discussed. Conclusion summarizes the main stages of the dissertation, its limitations and provides the final answer to the research question.
CHAPTER 2: LITERATURE REVIEW
Basal insulins glargine and degludec are the most advanced analogues of human insulin demonstrating profiles close to the normal physiological profile of endogenous insulin output. Although both insulins are claimed to produce a stable ahypoglycaemic effect during a 24-hour period, according to some studies insulin degludec is reported (Gough, 2013; Ratner, 2015; Zang, 2018; Zhou, 2019) to produce less glycaemic variability. Insulin degludec is related to the most novel basal insulins generation with a half-life of >25 h. Degludec is the only basal insulin that has a half-life that exceeds the dosing interval (Woo,2020).
As insulin degludec is a more expensive analogue than insulin glargine, there is a need for more evidence to demonstrate its higher levels of efficacy.
There are several safety and efficacy parameters that indicates superiority of one basal insulin upon other such as: body weight gain, change in fasting plasma glucose (FPG), overall and nocturnal episodes of hypoglycaemia, change in HbA1c, cross-reacting with human insulin antibodies. The most relevant and valid information on existed research comprises of two randomized controlled trials, two retrospective cohort studies and eight systematic reviews and meta-analyses including a large number of high- and medium quality randomized controlled trials(RCTs). The results were generated from large multi-national samples which increases a statistical power and validity (Saks, 2019).
Historically, a randomized controlled trial was designed to find an answer to a very specific question. The main purpose of this trial design is to examine the effects of a particular treatment in the population where this treatment will be introduced. The inferences are based on a comparative analysis of outcomes observed in experimental and control groups (control group does not receive the intervention). A randomized controlled trial design mitigates biases that come from experimental environment and controls confounding factors by matching process. The main purpose of RCT is to minimize "confounding by indication", the phenomenon defined by the fact that clinicians choose treatments based on the particular characteristics of patients (Saks, 2019).
Randomization in RCTs promotes comparability and similarity of the intervention and control groups. Moreover, it serves as a basis for quantitative evaluation of the treatment effect and valid statistical inferences. The similarity of participants in both groups is essential because it ensures that other factors do not interfere with the treatment effect and influence on outcome. In addition to this, the random allocation of subjects to control and treatment groups increases generalizability and validity of the trial's results and substantially improves the quality of evidence-based studies by minimizing a selection bias (Lim, 2019).
The six variables of interest are discussed below in a separate section. The critical analysis of the literature discussed, however, will be presented separately because most reviews examined three or more variables in one review.
2.1 Body Weight Gain
Insulin therapy includes not only benefits, but several negative side effects as well, among which weight gain and hypoglycaemia are the most important ones. The issue of weight gain is particularly relevant in case of Diabetes Type 2 (T2D) which is usually observed among people who have already had excessive weight (overweight, obese). Therefore, in T2D patients, the prescription of a basal insulin demonstrating less weight gain during a long -term use will be a preferable and reasonable treatment choice.
The research examining this variable is presented by a systematic review including 15 studies with 7075 patients in the insulin glargine group (control) and 9619 patients in the insulin degludec group (experimental) (Zhou et al,2019). The review examined four main endpoints which included weight gain. The results did not identify a statistically significant difference in body weight gain between the degludec and glargine arms (WMD 0,12 [0,19 to 0,43] p = 0,46).
Another review Liu et al, (2018) including 15 high-quality RCTs revealed similar changes in body weight gain in both T1D and T2D IDeg vs IGlar groups with statistically insignificant difference (MD=0,03 [0,11 to 0,18] p=0,67).
The cohort study of Laviola, (2021) also reported that no statistically significant difference was observed in body weight gain between IDeg and IGlar groups of 1070 participants. This study represents a retrospective, multicentered comparative cohort study based on electronic medical records. The study involved a network of diabetes centers located in different areas of Italy. Study sample include patients with Diabetes Type 1 (T1D), aged 18+, both genders switching to either Insulin Glargine -300 or Insulin Degludec -100 from first generation basal insulins. Each cohort included 585 patients.
Although the findings of reviews on the topic reported no significant changes in body weight, the results of DUAL V randomized controlled trial (Lingvay et al,2016) revealed that insulin degludec was associated with less weight gain (1,4 kg compared to insulin glargine 1,8 kg).
In contrast to DUAL V trial's findings, the review (Madenidou, 2018) of 34 low and medium quality studies reported that weight loss was associated with basal insulin analogues detemir and glargine, and glargine demonstrated a more favourable weight profile than insulin degludec.
2.2 Episodes of hypoglycaemia (overall, nocturnal)
Episodes of hypoglycaemia is an essential safety parameter of a basal insulin relating to the overall level of glycaemic variability. The less hypoglycaemia a basal insulin produces, the better daily glycaemic control can be achieved. Hypoglycaemia influences substantially on the quality of glycaemic control, worsens an individual's productivity at school and work, increases health costs. Also, the fear and anxiety of developing hypoglycaemia negatively impacts a quality of life. The overall episodes include mild, severe and nocturnal hypoglycaemia, however nocturnal one is divided into the separate variable due to its importance (Edelman, 2014).
Nocturnal hypoglycaemia is a dangerous side effect of insulin therapy because it happens during a sleep and can persist a long time causing severe decrease of a blood glucose <3,1. The persisted level of blood glucose lower than 3,1 can lead to convulsions, coma and death. Moreover, frequent nocturnal hypoglycaemia worsens contrregulatory mechanisms which maintain blood glucose levels, impairs cognitive functions and awareness of hypoglycaemia (Edelman, 2014). According to several studies spontaneous nocturnal hypoglycaemia in patients with Diabetes Type 1 changes cardiac repolarization and contributes to the risk of "dead in bed" syndrome (Koivikko, 2017).
Numerous studies Zinman,(2011), Gough, (2013), Onishi, (2013) examined this variable for both glargine and degludec insulins from 2011 year; pooled results of these studies are presented in a several systematic reviews and meta-analyses (Zhou, 2019; Heller, 2015; Ratner, 2015). The findings of meta-analysis based on the results of seven BEGIN 3a phase clinical trials (completed in the period 2011-2012) including both insulin-naïve and insulin experienced patients diagnosed with T2D (5 trials) and T1D (2 trials) demonstrated that end-of-trial rates of nocturnal hypoglycaemia were lower in groups treated with insulin degludec in both patient categories – T2D and T1D, however the rates were lower for T2D patients.
The rate of overall episodes of hypoglycaemia also favours groups treated with insulin degludec. However, the difference was not statistically significant. (Russel-Jones, 2015).
The results of the meta-analysis of Zhou et al (2019) showed that a treatment with insulin degludec was associated with lower severe and nocturnal hypoglycaemia, In terms of hypoglycaemia events, treatment with IDeg was associated with lower nocturnal and overall hypoglycaemia in patients with T2D according to the meta-analysis of Liu et al, (2018).
Finding of the retrospective cohort study revealed that incidence rates of hypoglycaemia during 6-month follow up were slightly lower in the IGlar group versus IDeg group. IGlar showed a 24% lower likelihood to experience a hypoglycaemic episode - IRR 0,76 [CI95% 0,60-0,96](Laviola, 2021).
The review of Heller, (2015) reported that for T2D patients, the risk of nocturnal hypoglycaemia (timescale 00,01-5.59, plasma glucose,3,1 mmol/l) was significantly lower with insulin degludec vs insulin glargine during all trial periods. For individuals with T1D, nocturnal hypoglycaemia risk was similar or lower across different definitions, trial periods and timescales. Nocturnal documented symptomatic hypoglycaemia for T2D patients during entire trial period IGlar-100,5 /IDeg 73,8 (Episodes per 100PYE).
The review of Madenidou, (2018) reported pooled results of 38 randomized controlled trials where several basal insulins were analyzed in terms of weight gain, hypoglycaemia events and HbA1c. According to this review, IDeg-100 was associated with lower incidence of any hypoglycemia (confirmed, symptomatic, asymptomatic with blood glucose <3,9; 3,1) compared with Glar-100 (OR-0,64 [0,43 to 0,96]). The data for nocturnal hypoglycaemia were reported altogether for IGlar 300 and IDeg 100, 200 showing less nocturnal hypoglycaemia compared to insulin detemir, LY2963016 and NPL.
Another review exploring this safety parameters reported that IDeg is associated with lower risk of overall and nocturnal hypoglycaemia in both Diabetes Type 2(insulin-naïve and basal-bolus) and Type 1 patients with a risk reduction variating from 24% to 40%(Woo,2020). The review examined the results of different studies and trial phases (SWITCH trial- (RR 0,94, p = 0.002, DEVOTE trial, EDITION trials, CONFIRM trial - RR 0,70, p =0.05), BRIGHT trial) and meta-analyses. Additionally, the association of the treatment with insulin degludeg with a significantly reduced risk (RR 0,60, p = 0,001) of developing severe hypoglycemia among patients with chronic kidney and cardiovascular disease was confirmed (DEVOTE trial) (Woo, 2020).
The meta-analysis of Ratner et al (2015) showed that among overall T2D population (Rate Ratio (RR) 0,83 and 0,68) and insulin-naive patients with T2D (RR-0,83 and 0,64), those using IDeg experienced significantly lower rates of overall confirmed and nocturnal hypoglycaemia than those using IGlar. In terms of T1D patients, during a maintenance period, a treatment with IDeg was associated with the significantly lower event rates of nocturnal confirmed hypoglycaemia as compared to IGlar (Rate Ratio 0,75). The results were statistically significant (Ratner et al, 2015).
Sullivan (2018), however, reported different results obtained from the DELIVER D+ cohort study: a considerable decrease in the incidence of hypoglycaemia was associated with IGla-300 (overall hypoglycaemia: from 15.6% to 12.7%; p = 0,006; hypoglycaemia requiring a treatment in an inpatient/emergency department: from 5.3% to 3.5%; p = 0,007). However, after the adjustment for baseline hypoglycaemia, IGlar-300 and IDeg showed similar event rates with no statistically significant difference in episodes of hypoglycaemia. At the follow-up period, the number of hypoglycaemic events was similar in both groups, but those patients who switched to IGlar-300 from IDeg demonstrated a lower inpatient/hypoglycaemia event rate (Rate Ratio- 0,56; p = 0,016).
The review of Zhang (2018) reported results favouring insulin degludec; IDeg was associated with a reduced risk for all confirmed hypoglycaemia. The results reached a statistical significance: ERR -0,81; 95% CI - 0,72-0,92; p-0,001), nocturnal hypoglycaemia (ERR-0,71, 95% CI - 0,63-0,80; p < 0,001.
2.3 Change in HbA1c
In terms of HbA1c, the study of Sullivan, (2018) identified that the reduction in mean HbA1c levels were similar among patients from both IGlar-300 and IDeg-100 cohorts. HbA1c measurements were similar at baseline and follow-up periods.
Network meta-analysis of Madenidou, (2018) based on the data obtained from 37 studies showed a minimal difference in change of HbA1c level: Deg-100 (MD- 0,21% [95% CI 0,03% to 0,38%]) Deg-200 (MD 0,28% [0,04% to 0,52%]), Glar-100 (MD- 0,26% [0,11% to 0,42%]),
Glar-300 (MD- 0,32% [0,13% to 0,51%]). This analysis showed that no statistically significant difference was detected in comparisons between IGlar-300, IGlar-100 vs IDeg-100, IDeg-200.
In terms of percentage of patients with HbA1c level less than 7% pooled results of 26 studies revealed that more patients treated with Glar-100 achieved an HbA1c level less than 7% than those treated with Deg-3TW – Odds Ratio 1,45 [CI95% 1,06 to 1,96].
According to the review of Zhou (2019), the sensitivity analysis which included nine trials with 13072 participants in total, revealed that insulin glargine was associated with a greater mean overall reduction in HbA1c comparing to insulin degludec. However, the difference was not statistically significant - WMD 0,03 [0,01 to 0,07] p = 0, 10. A subgroup analysis was performed for insulin-naïve and insulin-experienced groups which confirmed that the difference in the level of glycated hemoglobin was not statistically significant between IDeg and IGlar treatment groups -WMD 0,03 [0,00 to 0,07] p = 0,08.
The results of BRIGHT trial showed that from baseline to the end-of-trial period, the level of HbA1c reduced similarly from initial values in IDeg-100 treatment groups versus IGlar-300 treatment groups. The initial values of 8,7% ± 0,8% in the IDeg group and 8,6% ± 0,8% in the IGlar-300 group reduced to 7,0%± 0,8% by the week 24 in both groups. Least squares mean change in the level of HbA1c from baseline to end-of-trial period was -(-1,64 ± 0,04% [-18,0 ± 0,4] mmol/l) for IGlar group and -(-1,59 ± 0,04% (-17,4 ± 0,4 mmol/mol) for IDeg group, p < 0,0001 (Rosenstock, 2018).
The review of Liu et al, (2018) reported that the proportions of patients who achieved HbA1c < 7% from the baseline level were similar in both groups (IDeg 46,1% vs IGlar -46,9%). The overall results of HbA1c reduction were better in IGlar treatment groups. However, the difference was clinically insignificant (MD = 0,04% [0,01% to 0,07%]).
The review of Russel Jones, (2015) based on seven phase 3 clinical trials did not reveal a statistically significant difference in the level of HbA1c reduction between IDeg and IGlar groups, however due to the treat-to-target nature of the trials' design the difference was not expected.
The similar changes in the level of HbA1c from baseline to end-of-trial period were observed during BEGIN Basal–Bolus Type 1 and Type 2 trials which confirmed that treatments with IDeg and IGlar result in similar reduction of HbA1c levels. In T1D patient groups, glycated hemoglobin improved by 0,40% points in both insulin glargine and degludec groups during the first year (ETD -0,01 [0,14 to 0,11). Regarding the number of those who achieved a target level of HbA1c, a total of 67 (43%) participants in IGlar groups and 188 (40%) participants in IDeg groups reached the level of HbA1c < 7% (<53 mmol/l) from mean baseline values 7,7 ± 1,0%, SD (60,7 ± 11,0 mmol/mol). In T2D patient groups, the level of HbA1c reduction at first year was 1,1% in IDeg treatment groups and 1,2% in IGlar treatment groups - ETD 0,08 [0,05 to 0,21](Hui, 2012).
The findings of Zhang, (2018) demonstrated that HbA1c concentration was higher in IDeg vs IGlar group, but the results were not clinically or statistically significant (estimated treatment difference (ETD - 0,03 [0,00 to 0,06%] p= 0,06).
2.4 Change in FPG levels.
The following authors reported the findings regarding changes in fasting plasma glucose from baseline to end-of-trial periods.
A separate analysis of four trials with T2D patients showed that those who achieved FPG target <5 was higher in IDeg group (40,9%) vs IGlar (29,4%) Also, the proportion of patients who will probably reach the FPG target without nocturnal confirmed hypoglycaemia was considerably higher in IDeg group (34,9%) vs IGlar (23,8%) (Russel-Jones, 2015).
The review of Zhang, (2018) based on eighteen trials with a total of 16791 participants reported that the FPG level was lower in the IDeg treatment groups vs IGlar ones (ETD -0,28 mmol/l [0,44 to -0,11] p=0,001).
Zhou, et al, (2019): the analysis revealed that insulin degludec produced better FPG levels as compared to insulin glargine (weighted mean difference - 5.20 mg/dL [-7.34, -3.07] p < 0.0001).
Hui, (2012): The mean reductions in laboratory-reported FPGs were also similar between IDeg and IGlar treatment groups.
Laviola, (2021): while no statistically significant change in FPG levels were documented in the IGlar-300 group at 3 month (T3) and 6 month (T6), the IDeg-100 group demonstrated a statistically important reductions in FPG at 3 month-15,39 mg/dl and at 6 month-16,84 mg/dl). Between -group estimated MD-T3-20,41 mg/dl; p-0,004; but not at T6.
The review of Liu, (2018) reported that treatment with IDeg was associated with a statistically significant reduction in FPG levels as compared to treatment with IGlar -MD = -0,41 [-0,54 to -0,28] p< 0,001, with low heterogeneity across studies- - 27%.
2.5 The level of Antibodies Cross-Reacting with Human Insulin
The existed research on the level of antibodies cross-reacting with human insulin comprises of six phase 3 trials: Begin Basal Bolus Type 1 Long, Begin Flex Type 1, Begin Once Asia, Begin Flex Type 2, Begin Once Long and Begin Low Volume. The total number of participants in IDeg groups was (n =2550) and in IGlar groups (n=1184). Antibody measurements were conducted at baseline (week 0) and at weeks 12, 26, 40 and 52 depending on a treatment duration. The last measurements were performed at the end-of-trial and end of follow up periods.
The results revealed that treatment with IGlar and IDeg produce similar levels of antibodies cross-reacting with human insulin at the EOF period. The levels of IDeg- and IGlar-specific antibodies remained lower than bound/total radioactivity (B/T) (Vora, 2015).
Both treatment groups demonstrated a minimal increase in mean levels of antibodies cross-reacting with human insulin: baseline IGlar 11,5% increased to 14,3% to end-of-follow-up period (EOF) in T1D groups. In T2D groups, baseline IGlar -0,2% grew to 6,0% to EOF. In IDeg groups, T1D patients showed 11,2% at baseline and 19,3% at EOF. In T2D groups, from baseline 0,2% the level of antibodies increased to 5,1% to EOF. Overall, an increase in the level of antibodies was higher for participants with T1D, who have already had a long-term insulin treatment experience, as compared to those with T2D (Vora, 2016).
2.6 Critical Analysis of the Research Discussed above
Laviola et al, (2021)
Strengths: the first study to compare the mid-term effectiveness and safety of second-generation basal insulins among patients with T1D.
Limitations: the main limitations are the lack of information on self-measuring blood glucose tests for a large proportion of patients and lack of possibility to perform head-to-head analysis due to considerable under-titration of both bolus and basal insulins. Also, baseline risk of hypoglycaemia was not included in the primary analysis. In addition to these, the study design itself provides limited evidence, no information about patients' selection (whether they were randomly selected or not).
Russel-Jones, (2015)
Strengths: all included studies followed a randomized controlled trial design which represents the evidence of high-quality according to the hierarchy of the evidence (Saks, 2019). In addition to this, studies included large multi-national samples (329-1030 participants) and are methodologically sound which increases the validity of their results.
Limitations: all seven studies excluded patients with severe, recurrent hypoglycaemia and therefore, the rates of recorded hypoglycaemia might be lower than in a real clinical practice. Another limitation is the open-label design of all clinical trials included in the review. As different devices were used for injection, masking in that case was not possible. The third limitation is that this meta-analysis pooled the results for Diabetes Type 1 drawing on two studies only.
Sullivan, (2018)
Strengths: DELIVER D+ study provides the first comparative evidence on clinical outcomes when switching from Gla-100/IDeg to Gla-300 or IDeg. The study provides complementary evidence obtained from a real-world clinical practice to the existed RCTs. The study has a sound methodology; propensity-score matching was performed to minimize confounding, sensitivity and subgroup analyses were conducted to analyze consistency of results.
Limitations: the study has a retrospective design, which according to Bowling,(2014) and Saks, (2019) is set in a lower layer of the hierarchy of evidence and patients' data came mostly from northwest and southern states which is not representative of the whole population of the USA. In addition to these, the study participants were mostly insulin naïve users, so their characteristics might differ from insulin experienced patients; dosage data were missing in records; the findings can also be biased by the prescribing patterns depending on medical insurance coverage; the reason for switching insulins was not defined in the medical records and therefore a selection bias may not be fully excluded after propensity-score matching; short follow-up period months;
Despite the fact, that most of inpatient hypoglycaemia events might be reported in the medical records, it is likely that a considerable number of non-inpatient episodes of hypoglycaemia were not recorded.
Madenidou, (2018)
Strengths: the meta-analysis includes a large number of RCT trials (n=38), which mostly comprise of large samples thus increasing a statistical power.
Limitations: the meta-analysis has low external validity due to the inclusion of only studies that assessed a basal insulin analogue in both the intervention and comparator groups; therefore, the measurements of comparative efficacy of basal insulin analogues against premixed insulin regimens or NPH were limited. The comparative analysis of basal insulins' efficacy and safety parameters was limited because the conclusions were based on mostly indirect comparisons. Confidence in findings for glycemic efficacy and hypoglycemia was low due to imprecision, inconsistency and individual-study limitations.
For change in HbA1c level, approximately half of eligible studies had some concerns about bias or high risk of bias, and for nocturnal hypoglycemia almost all trials had high risk of bias. Also, the definition of any hypoglycemia varied among eligible studies, which compromises the applicability of findings in clinical practice; the dosing regimens varied across studies from once a day to twice a day.
Liu et al, (2018)
Strengths: the review included only high-quality studies following RCT design with a strong internal validity evaluated by the Jadad scale from 3 to five scores.
Limitations: this review has several limitations such as self-reporting of hypoglycaemic episodes; some of the included studies has open-label design; different definitions of hypoglycaemis across American Diabetes Association and European Medicines Agency. Also, a meta-analysis has shown a publication bias.
Zhou et al, (2019)
Strengths: first, the meta-analysis has a robust methodology, the sensitivity and subgroup analyses show consistency of the results. Second, a large number of RCTs and patients with T2D were included in this analysis.
Limitations: the main limitations are that most studies were funded by the manufacturer Novo Nordisk and has an open-label design. In addition to these, insulin concentrations (IDeg -100Units/ml, IDeg-200Units/ml, IGlar-100 Units/ml, IGlar -300Units/ml), frequency of injections (once daily or three times a week) insulin preparations and intervals between insulin injections may lead to high between-study heterogeneity. Finally, the difference in costs between insulin glargine and degludec was not taken into consideration in this analysis, however the cost is an important factor that influences a clinician's prescriptions (Zhou et al, 2019).
Zhang et al, (2018)
Strengths: the meta-analysis includes a large number of high-quality trials included (18 trials with a total of 16791 patients) which increases a statistical power; the data was extracted from original trials and adjusted for multiple baseline factors minimizing a risk of bias. A subgroup analysis was performed concerning the type of insulin degludec and duration of follow-up.
Limitations: the limitations of this meta-analysis include open-label design of the included studies; most of the studies were funded by the manufacturers; the definition of hypoglycaemia varied across studies; considerable heterogeneity observed for several outcomes (Zhang et al 2018).
Hui, (2012)
Strengths: The long duration of the included trials up to 52 weeks, an RCT design, low dropout rates, intention-to-treat analysis set in all trials.
Limitations: open-label design; different dose adjustments and injection timings for IDeg and IGlar; exclusion of patients with comorbidities and severe hypoglycaemia in anamnesis i.e. not close to a real-world clinical practice (Hui, 2012).
Rosenstock, (2018)
Strengths: the main strength of this study is a head-to-head trial design, proper insulin titration and low dropout rate. Most of participants has similar baseline characteristics.
Limitations: the main limitation is an absence of masking i.e. an open-label design which may have introduced a bias. Also, a comparatively short 24-week duration; the outcomes of a follow up period are unavailable (Rosenstock, 2018).
Ratner et al, (2015)
Strengths: this meta-analysis has two main strengths: pre-planned design and the inclusion of all phase 3 trials comparing directly insulin degludec with insulin glargine. The meta-analysis includes sensitivity analyses which demonstrated that baseline characteristics of the population did not influence the estimated rate ratio. Drawing on the results of sensitivity analyses it can be suggested that the findings of this meta-analysis can be applied to a wider population.
Limitations: the blinding of investigators and subjects was not possible due to the use of the different devices for the injection. Taking this absence of masking into account, a presence of a reporting bias to a certain extent can be suggested in this meta-analysis. Another limitation of the review is linked with individual study limitations: included trials excluded patients experiencing recurrent, severe hypoglycemic events from participation in the experiment (Ratner, 2015).
Lingav et al, (2016)
Strengths: the study has robust methodology, include multinational large sample IDeg (n=278), IGlar (n=279) with a proper matching of participants according to baseline characteristics.
Limitations: the trial has strict inclusion and exclusion criteria relating to body mass index, level of HbA1c and medication taken before the trial which makes its clinical applicability limited to these criteria. Also, study has a short follow-up period (1 week) and an open-label design which may introduce a reporting bias.
Woo, (2020)
Strengths: data were retrieved from studies and meta-analyses of high quality; studies contain large samples with various types of patients (insulin-naïve, insulin experienced, wide age range; some studies include participants with comorbidities (cardiovascular, chronic kidney diseases), data for both types of diabetesT2D, T1D were analyzed.
Limitations: limitations mostly relate to individual-study limitations such as open-label design and variations in definition of hypoglycaemia across studies.
Vora et al, (2015)
Strengths: the included trials followed an RCT design with high internal validity of results; the robust methodology of the review and precise measurements of antibodies used in trials.
Limitations: open-label design; at randomization, some participants had already had a long history of pretrial insulin exposure and higher levels of antibodies and others were insulin naïve (Vora, 2015).
CHAPTER 3: METHODOLOGY
3.1 Research Philosophy
This research is embedded in the paradigms of functionalism and positivism and follows hypothetico-deductive model. In the positivist paradigm, the association between study's variables are expressed quantitatively through direct or indirect effects. The dependent variable is linked with independent variable and increase in a latter one results in the increase in the dependent variable) (Park, 2020). Positivism recognizes evidence that relies on empirical experiments and methods accepted by scientific community (Bowling, 2014). The limitations of positivism relate to its context-free laws and neglect to individuality, subjectivity of human experience and specific conditions of the research (Davis, 2018).
The ontology of this dissertation draws on a rational research framework, positivism, functionalist research paradigm, objectivism. The ontology of the dissertation is aimed at the analysis and comparison of the two basal insulins (IDeg vs IGlar) in terms of safety, glycaemic variability and control. The dissertation considers that treatment effect of insulin is an objective entity which can be measured by objectivist methods for investigation of their specific aspects (efficacy and safety parameters). The limitation is that this ontology considers the existence of only one universal reality.
Epistemology of the dissertation assumes that objective facts and quantifiable data are the best tools to gain strong evidence and research findings of high validity through the quantitative analysis of numerical data (Haig, 2018).
This systematic review and meta-analysis include only primary investigation papers which used quantitative research methods, predominantly randomized controlled studies (RCT).
3.3 Search Strategy
Initially, the PROSPERO databases and the Cochrane Database of Systematic Reviews (CDSR) were inspected for ongoing and existing reviews. The result of this search showed that no systematic review matching the chosen research topic was found. SPIDER search strategy tools were applied in order to define the keywords. The MeSH browser and Boolean operators were used to retrieve more relevant and precise results (Aromataris, 2014).
The existing literature was searched in accordance with the Centre for Reviews and Dissemination (CRD) 2009 and Preferred Reporting Items for Systematic Reviews and Meta-Analyses (PRISMA) guidelines (CRD,2009).
PubMed, Clinicaltrials.gov, Clinicaltrialsregister.eu and Google Scholar electronic databases were used for the search of studies with the results published within 2015-2021 period. The purpose of the literature search was to detect all publications that matches the inclusion criteria and directly compare the effects of two long-acting insulins IDeg vs IGlar in patients with Diabetes Mellitus Type 1 and Type 2.
| S-Sample | Patients with Diabetes Type 1 or Type 2 (community based or hospital-based recruitment). |
| PI- Phenomenon of Interest | Overall and nocturnal hypoglycaemia, HbA1c, FPG, body weight gain, level of cross-reacting with human insulin antibodies in patients with Diabetes mellitus Type 1 and Type 2 receiving basal insulins (Insulin Degludec or Insulin Glargine) |
| D-Design | RCTs, cohort studies, clinical trials (primary, original research papers). |
| E- Evaluation (Outcome) | Overall and Nocturnal Hypoglycaemia (Number of episodes/Rates/PYE)Change of HbA1c from baseline to the end of trial (Mean difference)Change of FPG from baseline to the end of trial (mean difference)Change in body weight from baseline to the end of trial (mean difference)The level of antibodies cross-reacting with human insulin after the treatment with IDeg/IGlar (Mean difference,% B/T=percentage bound/total radioactivity) |
| R-Research type | Studies with quantitative research methodology |
The following search terms were used: PubMed: "insulin glargine" OR "insulin degludec" AND "Diabetes"- 1831 articles; Clinicaltrials.gov-keywords: condition- "Diabetes mellitus", search terms: "insulin glargine", insulin degludec" - 79 trials; Clinicaltrialsregister.eu – keywords: "insulin degludec", "insulin glargine" - 41 trials; Google Scholar: advanced search (filter with the exact phrase) - keywords: "insulin glargine", "insulin degludec" - 76 articles identified.
Search limits were applied to refine the scope to studies not older than 2015 years from the publication of results, published on English language, studies including participants older than 18 age, full-free text primary investigation papers or peer-reviewed articles, studies designed as clinical or randomized controlled trials.
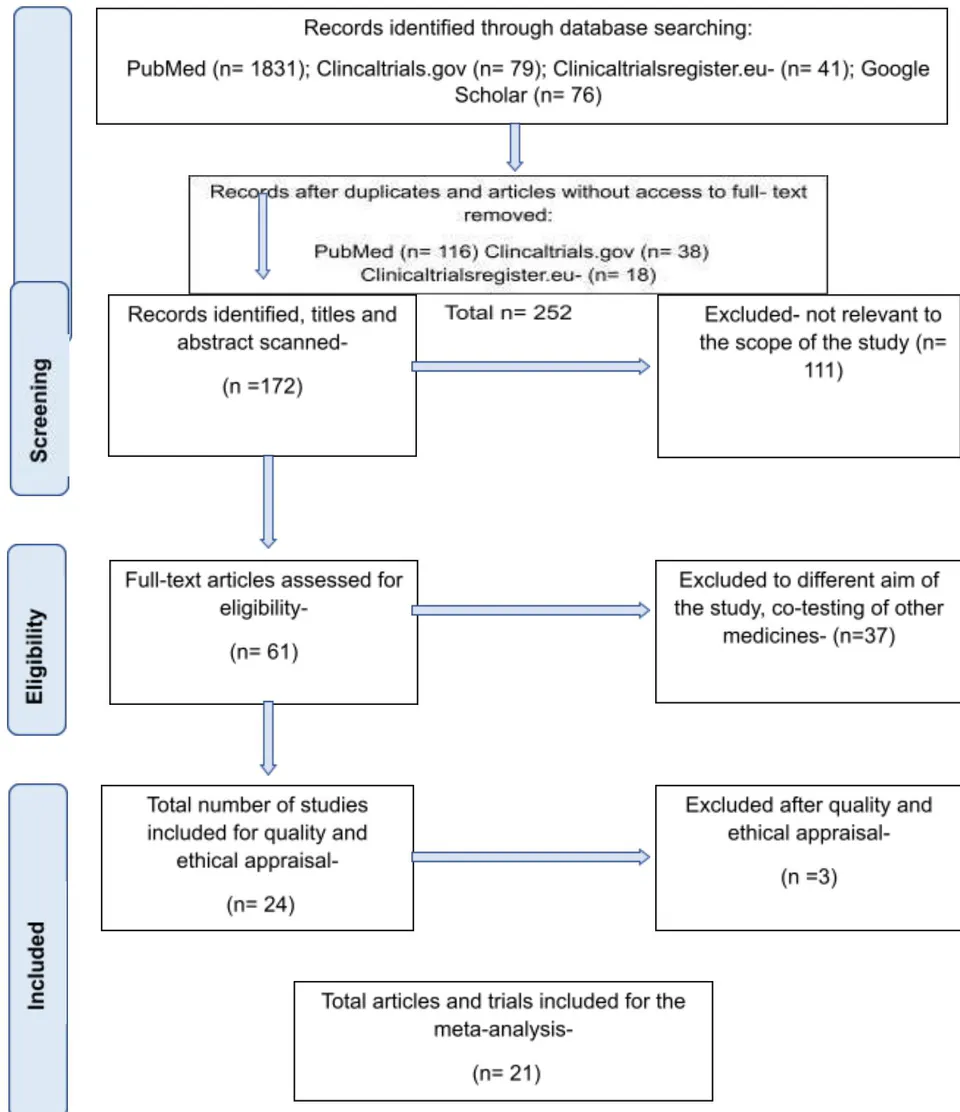
The first stage included application of filters (free-full text, RCT, clinical trial design, publication date 2015-2021, associated data available) and screening of trials and articles resulted from filtered search for study design, titles and abstracts. The second stage involved scanning of publications and exclusion of duplicates. Studies examining safety and efficacy parameters irrelevant to the scope of this review were excluded. At the last stage, 61 relevant full-text articles and trials were included and scanned for data collection. 37 studies were excluded due to co-testing of other medicines along with IDeg vs IGlar to minimize confounding factors. Finally, after the application of eligibility criteria 24 studies were chosen for the quality and ethical appraisal (Table 3).
3.5 Eligibility Criteria
| Inclusion | Exclusion | |
| S-Sample | Samplings including participants older than 18 age.Studies which include participants diagnosed =/> six months duration, participants without severe cardiovascular and other comorbidities.Samples which do not include participants with the history of recurrent severe episodes of hypoglycaemia. | Studies including participants younger than 18 age.Studies which include newly diagnosed participants - less than six months duration, participants with severe cardiovascular and other comorbiditiesSamples which include participants with the history of recurrent severe episodes of hypoglycaemia. |
| PI- Phenomenon of Interest | Studies which include data (measurements/outcomes) of the overall, nocturnal, episodes of hypoglycaemia, the level of antibodies cross-reacting with human insulin, body weight gain, change in the HbA1c and fasting plasma glucose IDeg vs iGlar. | Studies which do not include data (measurements/outcomes) of the overall, nocturnal, episodes of hypoglycaemia, the level of antibodies cross-reacting with human insulin, body weight gain, change in the HbA1c and fasting plasma glucose IDeg vs iGlar. |
| D-Design | Studies relating to higher levels of hierarchy of evidence (Randomized Controlled Trials, Prospective cohort studies, Clinical trials)Trials with duration =/>12 weeks | Studies relating to lower level of hierarchy of evidence (eg. case series, case reports, case control studies, expert opinions)Trials with duration less than 12 weeks |
| E- Evaluation (Outcome) | Studies that provide direct comparison of efficacy and safety parameters (overall, nocturnal episodes of hypoglycaemia, the level of antibodies cross-reacting with human insulin, body weight gain, change in the HbA1c and fasting plasma glucose); active comparator is IDeg vs IGlar or IGlar vs IDeg. | Studies which co-test other new medicines along with IDeg/Glar;Studies which test short-acting insulins along with IDeg vs IGlarIsolated studies which examined only one of the insulins IDeg or IGlar. |
| R-Research type | Studies with results published within 7 years age range (2015-2021).Studies published in English language Primary researchStudies from peer-reviewed journals Quantitative studie | Studies with results published before 2015.Languages other than English Literature other than primary research Papers from no peer-reviewed journals Qualitative, Mixed-Method studies |
3.6 Data Extraction
Data extraction will be implemented in Microsoft Excel and include study design, sample size, the context of the study, limitations of the study, baseline characteristics of participants in both groups (mean age, mean weight, proportions of male/female%, diagnosis, duration of disease, treatment received prior to trial) In addition to this, data on predetermined six safety and efficacy variables of interest will be retrieved:
Safety parameters: Hypoglycaemia episodes (overall, nocturnal), the level of antibodies cross-reacting with human insulin, body weight gain.
Efficacy parameters: Changes in fasting plasma glucose (FPG) and HbA1c levels from the baseline to the end of a trial.
3.7 Data Analysis
The statistical analysis includes the meta-analysis of continuous variables using mean differences (MD) and standard deviations (SD), Inverse Variance method, with 95% Confidence Intervals [CI 95%] p<0,05 for FPG, HbA1c, body weight gain and the level of antibodies cross-reacting with human insulin. The meta-analysis of dichotomous variables (episodes of overall and nocturnal hypoglycaemia) used Risk Ratios with [CI95%], Mantel-Haenszel method, with p<0,05 detecting statistically significant results. The statistic was used to test heterogeneity with values of >50% representing important heterogeneity (Corcoran, 2008). The random effect model was used for all estimates. As studies applied different measurements of the same effect the random effect model was used because it incorporates study variance and heterogeneity into the weights given to individual studies (Bruce, 2017).
Effect sizes for continuous data were calculated using standardized effect sizes (Cohen's formula ), for the samples of equal size and Cohen's resp g Hedges for the samples of different size with a correction of a positive bias in the pooled standard deviations. (McCabe, 2012; Lenhard, 2016). Standard Errors (SE) were calculated through the square root of Variance (see Appendix 1,2,3,4).
For dichotomous variables effect sizes were calculated through odds ratios using online formula converter (odds ratio is converted into Cohen's )(Lenhard, 2016). According to Haddock, (1998) the calculation of odds ratios is the most appropriate method of defining effect size for dichotomous data.
A subgroup analysis was performed for the variables with statistically significant results to test their consistency across different patient groups:
1. Between participants with T1D and T2D,
- Between insulin naïve and insulin experienced participants.
The subgroup analysis is needed to control the consistency of the results across all chosen variables. Examination of the publication bias was conducted through a funnel plot and the Egger's regression test for funnel plot asymmetry (Mikolajewicz, 2019; Laake, 2015).
3.8 Methodological Quality Assessment
The critical appraisal included 24 studies. The following methodological quality characteristics were evaluated: the validity of research, the reliability of results (whether the intention-to-treat analysis was performed, the presence of ethical issues or biases due to poor design, protocol violations or high drop-out rates), strengths and weaknesses (Ajetunmobi, 2002). In addition to this, a quality appraisal was implemented in order to evaluate the studies' design, methodological rigour, whether the studies provide a relevant answer to a research question and are written in a reliable way.
The Critical Appraisal Skills Programme (CASP) Checklist for Randomized Controlled Trial was used for the appraisal because all selected studies except one followed a RCT design and implemented quantitative research methods (CASP, 2019).
As a result of a quality appraisal, 21 studies were included in this systematic review and meta-analysis (Table3). Three studies out of 24 were excluded for the following reasons: Novo Nordisk, 2015 NCT00972283 trial- the available data does not contain precise names and dosages of other oral hypoglycaemic drugs which were used as additional medications along with insulin therapy. This might act as a confounding factor and produce biased results. Another trial- Novo Nordisk, 2015, NCT 01569841 was excluded because no confidence intervals and standard deviations were available for estimates, so this could affect the precision of the results. The study of Ortez-Gonzalez, 2020 possesses a low external and internal validity and contains severe methodological flaws.
Majority of the studies included in a review consists of large, multi-ethnic and multi-national samples (more than 500 participants) recruited from general population, medical institutions, hospitals according to eligibility criteria. Trials included participants from more than 25 different countries of Asia, Africa, South and North America, Europe which increases generalizability of the results. In addition to this, large samples minimize the sampling error and allow to generate more reliable results (Bowling, 2014).
| Reference | Did the study address a clearly focused question? | Was the assignment of participants to intervention randomized? | Were all participants who entered the study accounted for at its conclusion? | Were the participants, investigators and assessors blinded? | Were the study groups similar at the start of the randomized controlled trial? | Apart from the experimental intervention were the study participants treated equally? | Were the effects of intervention reported comprehensively? | Was the precision of the estimate of the intervention or treatment effect (CIs) reported? | Do the benefits of the experimental intervention outweigh the harms and costs? | Can the results be applied to your local population/context? | Would the experimental intervention provide greater value to the people in your care than any of the existed interventions? |
| Philis-Tsimikas, 2020. CONCLUDE Trial. | + | + | + | - | + | + | + | + | + | + | + |
| Gonzalez Ortiz M., 2020 | + | + | - | + | + | Can't tell | - | - | - | - | - |
| Kawaguchi Y. et al, 2018. | + | + | + | - | + | + | + | + | Can't tell | - | Can't tell |
| Kumar S., 2017. | + | + | + | - | + | + | + | + | + | + | + |
| Wysham, K. et al, 2017 SWITCH 2 | + | + | + | + | + | + | + | + | + | + | + |
| Lane et al, 2017 SWITCH 1 | + | + | + | + | + | + | + | + | + | + | Can't tell |
| Novo Nordisk, 2015 NCT00612 040 | + | + | + | - | - | + | + | + | + | + | + |
| Novo Nordisk, 2015(BEGIN T1 LONG) NCT00982 228 | + | + | + | - | + | + | + | - | + | + | Can't tell |
| Novo Nordisk, 2015(BEGIN FLEX 1), NCT01079 234 | - | + | + | - | + | + | + | + | + | + | + |
| Novo Nordisk, 2015 (BEGIN: Once Long) NCT00982 644 | + | + | + | - | - | + | + | - | + | + | + |
| Novo Nordisk, 2015 (BEGIN) NCT00972 283 | - | + | + | - | - | Can't tell | + | + | + | - | - |
| Novo Nordisk, 2016. DUALTM V | + | + | + | - | + | + | + | + | + | + | + |
| Novo Nordisk, 2017. DUALTM VII | + | + | + | - | + | + | + | + | + | + | + |
| Novo Nordisk, 2018, NCT02906 917 | + | + | + | - | + | + | + | + | + | + | + |
| Novo Nordisk, 2015, NCT 01006291 (BEGINTM: FLEX 2) | + | + | + | - | + | + | + | + | + | + | + |
| Novo Nordisk, 2015 NCT 01059799 (BEGIN: ONCE ASIA) | + | + | + | - | + | + | + | + | + | - | - |
| Novo Nordisk, 2015 NCT 01068665 (BEGIN: LOW VOLUME) | + | + | + | - | + | + | + | + | + | + | + |
| Pan C.,2016. BEGIN ONCE | + | + | + | - | + | + | + | + | + | + | + |
| Rosenstock J. (2018). BRIGHT Trial | + | + | + | - | + | + | + | + | + | + | + |
| Philis-Tsim ikas et al, 2019. DUALTM IX | + | + | + | - | + | + | + | + | + | + | + |
| Novo Nordisk, 2015. NCT01076 647 BEGIN EASY | + | + | + | - | + | + | + | + | + | + | + |
| Novo Nordisk, 2016. NCT011359 92 BEGIN SIMPIFY | + | - | + | - | + | + | + | + | + | + | + |
| Novo Nordisk, 2015. NCT 01569841 | + | + | + | - | + | - | - | - | Can't tell | - | - |
| Goldenberg et al, 2021. SWITCH PRO trial | + | + | + | - | + | + | + | + | + | + | + |
3.9 Baseline Characteristics of the Included Studies
Most of the selected studies examined patients with Diabetes Type 2 (17) and only four trials include participants with Diabetes Type 1. The trials' participants are predominantly middle-aged patients (45-60 years old), with BMI lower than 30 and with no severe cardiovascular or renal complications or recurrent, severe hypoglycaemia. Out of 21 studies, 8 ones include insulin naïve participants; remaining studies include mixed samples (insulin naïve + insulin experienced) and those who already used basal insulins + oral antidiabetic drugs. The duration of diabetes varied, but most samples constitute participants with long history of diabetes (diabetes duration from 9 to 23 year).
| Study, year | Participants' Diagnosis | Trial setting and duration (weeks) | Sample size | Mean Age | Gender(Female /Male%) | Mean Weight | Duration of disease (years) | Treatment received prior to trial | ||||||
| IDeg | IGlar | IDeg | IGlar | IDeg | IGlar | IDeg | IGlar | IDeg | IGlar | IDeg | IGlar | |||
| Novo Nordisk, 2015, NCT 01006291(BEGINTM: FLEX 2) | Diabetes Type 2 | 69 sites in 14 countries of Africa, Asia, Europe and South America. 26 weeks | 257230 | 56,5 | 56,7 | F-45,6M-55,4 | 51,748,3 | Below40kg/m2 | T2D minimum6 months | Oral Antidiabetic Drugs (OAD)alone or basal insulin alone or in combination with OAD(insulin naïve+insulin experienced) | ||||
| Diabetes Type 2 | 52 sites in 6 countries: Hong Kong (1), Japan (12), Malaysia (8), South Korea (19), Thailand (6) and Taiwan (6) 26 weeks | 289146 | 58,8 | 58,1 | F-45,3M-54,7 | 48,651,4 | Below35kg/m2 | T2D minimum6 months | ||||||
| Novo Nordisk, 2015 NCT 01059799(BEGIN: ONCE ASIA) | Diabetes Type 2 | 106 sites in 8 countries of Europe, Asia and North America. 26 weeks | 228229 | 57,8 | 57,3 | F-47,8M-52,2 | 45,954,1 | Below45,0kg/m2 | T2D minimum6 months | OAD only(insulin naïve) | ||||
| Novo Nordisk, 2017 NCT 01068665(BEGIN: LOW VOLUME) | Diabetes Type 2 | 166 sites in 12 countries of Europe and USA 104 weeks | 773257 | 59,3 | 58,7 | F-39,1M-60,9 | 35,065,0 | 89,4 | 91,8 | 9,4 | 8,6 | OAD only(insulin naïve) | ||
| Novo Nordisk, 2015 NCT 00982644(BEGIN: Once Long). | Diabetes Type 1 | 79 sites in six countries of Africa, Europe and the United States of America (USA). 104 weeks | 472157 | 42,8 | 43,7 | F-41,1M-58,9 | 42,757,3 | Below35,0kg/m2 | T1D minimum12 months | Treatment with any basal bolus insulin for at least 12 months | ||||
| Novo Nordisk, 2015 NCT009822 28 (BEGIN T1 LONG) | Diabetes Type 1 | 71/68 sites in 6 countries of Europe and USA 52 weeks | Below or equal to 35.0 kg/m2 | Treatment with any basal bolus insulin for at least 12 months | ||||||||
| 75 centers in 10 countries. 26 weeks | 43,6 | 44,1 | F- 40,4 M -59,6 | 46,3 53,7 | T1D minimum 12 months | Treatment with insulin glargine minimum 90 days prior to screening | ||||||
| Novo Nordisk, 2015 NCT 01079234 (BEGIN FLEX T1) | Diabetes Type 2 | 329 164 | 88,3 | 87,3 | Current treatment with IGlar at least 90 days prior to screening | |||||||
| 89 sites in 12 countries of Europe, Asia, South and North America. | 278 279 | 58,4 | 59,1 | F- 48,6 M -51,4 | 50,1 49,1 | 11,64 | 11,33 | |||||
| Lingvay et al, 2016. DUALTM V | Diabetes Type 2 | 26 weeks | 58,6 58,0 | F- 56,3 M -43,7 | 53,9 46,1 | 13,2 | 13,3 | Treated with any basal insulin for at least 90 days prior to the day of screening | ||||
| 71 sites in 7 countries of Africa, Asia, Europe and USA | 252 254 | 88,6 88,5 | ||||||||||
| Novo Nordisk, 2017. DUAL TM VII | Diabetes Type 2 | 26 weeks | 58,2 | 59,2 | F- 53,2 M -46,8 | 48,3 51,7 | 12,9 | 13,0 | Treatment with insulin for more than 5 years | |||
| 230 sites in 11 countries of Europe and USA 88 weeks | Treatment with insulin and OADs | |||||||||||
| Novo Nordisk, 2018 NCT0290691 7. | Diabetes Type 2 | Minami Osaka Hospital, Osaka, Japan 20 weeks | 267 265 | F- 41,6 M -58,4 | 46,1 53,9 | 91,6 | 90,7 | 15,0 | 14,8 | Treatment with OADs (insulin naïve subjects) | ||
| Diabetes Type 2 | 88 sites in 8 countries of Asia, USA, Europe 52 weeks | 758 759 | 67,9 | 71,1 | F- 33,3 M -66,7 | 46,7 53,3 | 73 | 70 | 18,1 | 18,5 | Treatment with basal insulin with or without OADs at least 26 weeks | |
| Philis-Tsimi kas, 2020. CONCLUDE trial | Diabetes Type 2 | 152 US centers 32 weeks | 57,4 | 56,4 | F- 53,0 M -47,0 | 48,3 51,7 | 84,7 83,9 | 11,6 | 11,4 | Current treatment with a basal-bolus regimen or CSII (with rapid acting insulin) for ≥ 26 weeks prior to Visit 1 | ||
| Kawaguchi Y. et al, 2018. | Diabetes Type 2 | 90 sites in 2 countries, as follows: US: 84 sites, Poland: 6 sites. | 15 | 61,5 | 61,2 | F- 46,9 M -53,1 | 46,9 53,1 | 90,8 92,6 | 14,2 | 13,9 | ||
| Kumar S., 2017. BOOST Trial. NCT0104570 7 | Diabetes Type 1 | 64 weeks 158 study centers across 16 countries 24 weeks | 360 360 | 45,4 | 46,4 | F- 49,4 M -50,6 | 46,3 53,7 | 82,1 | 78,9 | OADs only (insulin naïve) | ||
| Wysham, K. et al, 2017. SWITCH 2 Trial | Diabetes Type 2 | 28 centres in Australia, USA and Europe 16 weeks | 60,5 60,6 | F- 45,6 M -54,4 | 47,0 53,0 | 10,7 | 10,5 | Treated with insulin for at least six months - any regimen | ||||
| Lane, W. et al, 2017. SWITCH 1 Trial. | Diabetes Type 1 | 74 sites in 11 countries of Soth America, Asia, USA and Europe. 26 weeks | 45,1 | 47,2 | F- 63,0 M -37,0 | 54,0 46,0 | 21,8 | 19,1 | Treatment with AODs (insulin naïve) |
| RosenstockJ. (2018).BRIGHTTrial | DiabetesType 2 | 27 sites in the USA16 weeks | 463466 | F- 42,4 40,0M -57,6 60,0 | 9,8 | 9,3 | basal-oral therapy (BOT)at least three months with insulin glargine once daily | ||||
| 56,1 | 57,2 | 89,3 | 87,2 | ||||||||
| Novo Nordisk, 2015.NCT00612040 | DiabetesType 2 | 119 | 59 | F- 33,3 33,3M -66,7 66,7 | T2D for at least 6 months | Treatment with OADs (insulin naïve) | |||||
| 94 sites in 7 countries of Africa, Asia, Europe and USA, Canada 26 weeks | 210210 | 99,399,3 | |||||||||
| Philis-Tsimi kas et al, 2019.DUALTM IX. | DiabetesType 2 | 68 sites in six countriesof South America, Africa, Asia, North America, Europe 26 weeks | 142142 | F- 45,9 40,4M -54,1 59,6 | Clinically diagnosed T2D | Current treatment with OADs only (insulin naïve) | |||||
| Novo Nordisk, 2016.NCT01135992 | DiabetesType 2 | 56 sites in Canada, Poland, Slovakia, South Africa, USA. | 233234 | F- 46,1 52,5M -53,9 47,5 | 7,55 | 8,26 | Treated with insulin for more than 5 years | ||||
| BEGIN SIMPIFY | 75,5 | 73,8 | |||||||||
| Novo Nordisk, 2015.NCT01076647 | DiabetesType 2 | 555278 | F- 52,6 51,4M- 47,4 48,6 | 14,5 | 15,6 | ||||||
| BEGIN EASY | Below or equal to 45 kg/m2 | ||||||||||
| Pan C.,2016.BEGIN ONCE. | 249249 | ||||||||||
| Goldenberg et al, 2021.SWITCH PRO trial.NCT03687827 | |||||||||||
| Study, year | Cross-reacting antibodies to insulin%B/T* mean (SD) | Body weight gain (after treatment) kg | Change from baseline fasting plasma glucose (FPG) mean (SD)mmol/l | Episodes of nocturnal hypoglycaemia (PYE) and Rate Ratio | Overall episodes of hypoglycaemia (PYE) and Rate Ratio | HbA1c (Mean difference /Standard Deviation) mmol/l | |||||||
| IDeg | IGlar | IDeg | IGlar | IDeg | IGlar | IDeg | IGlar | IDeg | IGlar | IDeg | IGlar | ||
| -3,2 | -2,8 | 36,3 | 34,8 | -1,28 | -1.26 | ||||||||
| Novo Nordisk, 2015, NCT01006291(BEGINTM: FLEX 2) | BSL3,9(10,9)5,1(13.6) | 3.3(9,5)5,0(12,4) | RR [-0.53 to 0.52], P = NS). | ETD -0.42 mm [-0.82 to -0.02], p = 0.04) | 56 RR 0.77[0.44-1.35], P = NS | RR1.03[0.75-1.40], P = NS | (1,00) ETD -0.04% [-0.12 to 0.20] | ||||||
| 78 RR 0.52, 95% CI0.27 to 1.00, P = 0.05)NS | 29,8 RR 0.63, 95% CI[0.42 to 0.94] P = 0.02) | -1.24 (0.87) ETD -0.11% [95% CI -0.03 to 0.24] | |||||||||||
| -3.70(3.06) | -3.38(2.96) | 27 RR 0.64[0.30-1.37], P = 0.25)NS | 17,2 RR 0.86[0.58-1.28], P = 0.46)NS | -1.30 (1.04) ETD 0.04 (95% CI -0.11 to 0.19) | |||||||||
| BSL0,2(1,2)0,5(2,3) | 0,9(6,7)6,0(15,0) | ETD -0.17[95% CI -0.59 to 0.26], P = 0.44, NS | -1,6-0,09[95% CI 0.80 to 0.99], P = 0.013) | 78 RR 0.52, 95% CI0.27 to 1.00, P = 0.05)NS | 29,8 RR 0.63, 95% CI[0.42 to 0.94] P = 0.02) | -1.24 (0.87) ETD -0.11% [95% CI-0.03 to 0.24] | |||||||
| ETD -0.42[95% CI -0.78 to -0.06] | 27 RR 0.64[0.30-1.37], P = 0.25)NS | 17,2 RR 0.86[0.58-1.28], P = 0.46)NS | -1.30 (1.04) ETD 0.04 (95% CI -0.11 to 0.19) | ||||||||||
| ETD -0.42[95% CI -0.78 to -0.06] | ETD -0.42[95% CI -0.78 to -0.06] | 27 RR 0.64[0.30-1.37], P = 0.25)NS | 17,2 RR 0.86[0.58-1.28], P = 0.46)NS | -1.06 (1.01) ETD 0.07% (95% CI -0.07 to 0.22), P = 0.339 NS | |||||||||
| 172 RR0,84[0,68-1,04]NS | 27,0 RR0.57(0.40-0.81)p=0.002 | -0.27 (0,75) ETD -0,01 [95% CI -0,14 to 0,11];p<0,0001 | |||||||||||
| 39,1 RR 0.73 [0.56; 0.96] | 37,5 RR1,07 [0,89 to 1,28]; p=0,48) (NS) | -0.13 (0,67) ETD 0.07 [-0.05 to 0.19] | |||||||||||
| Novo Nordisk, 2015NCT00982228(BEGIN T1 LONG) | BSL13,5(17,2)15,4EOT15,8(18,0) | 12,4(15,4)13,0(16,9) | ETD -0.42[95% CI -0.78 to -0.06] | ETD -0.42[95% CI -0.78 to -0.06] | 64,0 RR0.75 [0.58; 0.97] | 68,1 RR 1.02 [0.84; 1.24](NS) | -1.48 (0,05) ETD -0,02 (-0,16 to 0,12) p=0,0001 | ||||||
| BSL12,2(14,7)19,3(20,8) | 11,5(13,6)14,3(15,9) | ETD -0.42[95% CI -0.78 to -0.06] | ETD -0.42[95% CI -0.78 to -0.06] | 13 RR0,25 [0,13 to 0,45] p=0,0001 | 10,7 RR 0,11 [0,08 to 0,17] p=0,0001 | -1.81 (1,08) ETD -0,66% (-0,80 to -0,52) p=0,001 | |||||||
| Novo Nordisk, 2015NCT01079234(BEGIN FLEX T1) | ETD -0.42[95% CI -0.78 to -0.06] | 22 RR0,17(95%CI 0,10 to 0,31), p=0,001 | 22,3 RR -0,44(0,31 to 0,63) p=0,001 | -1,2 (0,9) ETD 0.07% (95% i [CI -0.06- 0.21] | |||||||||
| Novo Nordisk, 2017. DUALTM VII | ETD -0.42[95% CI -0.78 to -0.06] | ETD -0.42[95% CI -0.78 to -0.06] | 113 RR0.61 [95% CI: 0.40; 0.93] | 53,7 RR 0,86(0,65 to 1,14) NS | -0.54 (0,91) ETD -1.05 (-1.89,-0.21) | ||||||||
| Novo Nordisk, 2016. DUAL TM V | ETD -0.42[95% CI -0.78 to -0.06] | ETD -0.42[95% CI -0.78 to -0.06] | 62 RR 0.63 (0.49, 0.81) | 138 RR0.82 (0.67, 1.00)NS | -1.65 (1.28) ETD -0.03% (95% CI -0.20, 0.14] | ||||||||
| Novo Nordisk, 2018NCT02906917. | ETD -0.42[95% CI -0.78 to -0.06] | ETD -0.42[95% CI -0.78 to -0.06] | 19 RR0.80, [95% CI 0.49,1.30] NS | 5,5 RR 1.43, 95% CI 1.07, 1.92; P < 0.05 | -0.49 (0,99) ETD, 0.09% [95% CI, -0.04% to 0.23%]; P <.001 | ||||||||
| Philis-Tsimikas, 2020.CONCLUDE trial | ETD -0.42[95% CI -0.78 to -0.06] | ETD -0.42[95% CI -0.78 to -0.06] | 19 RR0.80, [95% CI 0.49,1.30] NS | 41,9 RR 1.43, 95% CI 1.07, 1.92; P < 0.05 | -1.65 (1.28) ETD -0.03% (95% CI -0.20, 0.14] | ||||||||
| Kawaguchi Y. et al, 2018.Kumar S., 2017.BOOST Trial. | ETD -0.42[95% CI -0.78 to -0.06] | ETD -0.42[95% CI -0.78 to -0.06] | 19 RR0.80, [95% CI 0.49,1.30] NS | 41,9 RR 1.43, 95% CI 0.49,1.30; P < 0.05 | -0.49 (0,99) ETD, 0.09% [95% CI, -0.04% to 0.23%]; P <.001 | ||||||||
| 1.5 [4.4] | 1,8 [4.3] | 55 RR=0.58 [95% CI, 0.46 to 0.74]; P<.001 | 93 RR=0.70 [95% CI, 0.61 to 0.80] p<0,001 | 26,5 RR=0.70 [95% CI, 0.61 to 0.80] p<0,001 | -0.73 (0.89) | -0.66 (0.76) | ||||
| Wysham, K. et al, 2017. SWITCH 2 Trial | -1,95 (3,57) | -1,58 (3,56) | ETD -0,03 [-0.10 to 0.15] | |||||||
| 2.6 | 2.7 | 28,1 RR0.75 (95% CI, 0.68-0.83: P<.001) | 37,2 RR0.94 (0.91-0.98) P<.002 | 21,7 | -1.59 (0.037) | -1,64 (0.037) | ||||
| ETD -0.25 [-0.99 to 0.49] p = 0.51) NS | ETD -0,05 [-0,15 to 0,05] | |||||||||
| Lane, W. et al, 2017. SWITCH 1 Trial. | 2.0 (3.8) | 2,3 (3,6) | 183 RR0,81 [0,58 to 1,12) NS | 226 | -0.57 (0.76) | -0.62 (0.68) | ||||
| -1.60 (4.66) | -0,54 (4,36) | 108,3 RR 0,86 [0,71 to 1,04) NS | ETD -0.10%-point [-0.14 to 0.34] | |||||||
| Rosenstock J. (2018). BRIGHT Trial | 0,1 2,5) | 0.7 (1,6) | ETD -0.76 mmol/L [−2.04 to 0.52] | 5,1 RR: 0.42 [0.25-0.69] | 12,3 | -1.94 (0.95) | -1,68 (1,05) | |||
| -3.72 (2.89) | -3,50 (2,43) | 6,62 (RR: 0.72 [0.52-1.00] NS | ETD -0,34 [95%;-0,48 to -0,20] | |||||||
| Novo Nordisk, 2015. NCT00612040 | 0,0 (3,8) | 2,0 (3,9) | ETD -0.33 mmol/L [95%CI -0.64, -0.01] P = 0.04 | 37,0 RR 0,42 [CI95%;0.23 to 0.75] | ||||||
| ETD -1,92-2.64 to -1.19 | ||||||||||
| Philis-Tsimikas et al, 2019. DUALTM IX | 0,1 (0,4) | 0,6 (2,2) | -0,7 (2,2) | 0,0 (2,3) | 8,3 | 11,1 | -1,05 (0,94) | -1,36 (0,95) | ||
| 45,3 | -0,26% [95% CI -0,11 to 0,41] | |||||||||
| Novo Nordisk, 2016. NCT01135992 BEGIN SIMPIFY | 0,8 (3,9) | 1,0 (3,7) | RR 0.60, [0.21-1.69] NS | -1.3 (1.1) | -1,2 (1.0) | |||||
| -3.35 (2.91) | -3,14 (2.71) | 10,0 RR 1.04, [95% CI 0.69-1.55] NS | ETD -0.05% [-0.18 to 0.08] | |||||||
| Novo Nordisk, 2015. NCT01076647 BEGIN EASY | BSL 2.0 (8.7) | 1,6 (7,5) | ETD -0.26 [-0.53 to 0.02] | 22 RR0.77 [0.43 to 1.37] NS | 85,0 RR0.80 [0.59 to 1.10] NS | |||||
| Pan C.,2016. BEGIN ONCE. | EOT 3.2 (11.1) | 4,9 (12,5) | -0,50 (0,42) | -0,40 (0,42) | ||||||
| 31,1 RR 0,76[95%CI 0,65 to 0,90] | 55,8 RR 0,87[0,75 to 1,00] NS | ETD -0,06% [95%CI -0,11 to -0,01] | ||||||||
| Goldenberg et al, 2021. SWITCH PRO trial | ||||||||||
3.9 Ethical Appraisal
The trials selected for this review are ethically sound and carried out in compliance with the Declaration of Helsinki, 2008. All selected trials obtained approvals from different independent ethical committees and have written consent forms from participants. Although, no participants will be recruited for this study; ethical approval from the University of Essex will be applied for prior to conducting the study.
CHAPTER 4: RESULTS
The results of the meta-analysis demonstrate that:
IDeg is associated with less glycaemic variability (less overall and nocturnal hypoglycaemia episodes) in both T2D and T1D (insulin naïve and experienced) patients.
IDeg is more effective in the reduction of fasting plasma glucose (FPG) levels in both T2D and T1D (naïve and experienced) patients.
Treatment with IDeg is associated with less weight gain compared to IGlar in T2D (insulin-experienced) and T1D groups.
4. Both insulins (IDeg and IGlar) provide a similar reduction of HbA1c levels
- The difference in the level of antibodies cross-reacting with human insulin after the treatment with IDeg vs IGlar is not statistically significant.
The aim of the study was to investigate and compare the efficacy and safety parameters of insulin degludec versus insulin glargine in the treatment of adult (18+) patients with Diabetes Type 1 and Type 2.
4.1 Efficacy Parameters
Change in HbA1c level
For the analysis of HbA1c estimates, nineteen out of 21 studies were selected with a total number of participants in IDeg groups (n=6607) and in IGlar groups (n=5112). The pooled estimates of 19 studies with available data on the levels of HbA1c showed that the result is numerically lower for IDeg, but the overall difference is not statistically significant; the overall effect Z=0,49; p=0,62 (see Figure 3 below). In addition to this, a high between-study heterogeneity was detected ( ). A funnel plot revealed gaps in the bottom areas, however this can be explained by high heterogeneity (see Figure 4). The plot was not examined for funnel plot asymmetry (publication bias) because the result is not statistically significant.
| Study or Subgroup | Experimental IDeg | Control IGlar | Weight | Mean Difference IV, Random, 95% CI | Year | Mean Difference IV, Random, 95% CI | |||||
| Mean [mmol/l] | SD [mmol/l] | Total | Mean [mmol/l] | SD [mmol/l] | Total | ||||||
| Goldenberg et al, 2021. SWITCH PRO trial | -0.5 | 0.42 | 249 | -0.4 | 0.42 | 249 | 8.6% | -0.10 [-0.17, -0.03] | 2021 | ||
| Philis-Tsimikas, 2020. CONCLUDE trial | -0.54 | 0.91 | 758 | -0.46 | 0.9 | 759 | 7.5% | -0.08 [-0.17, 0.01] | 2020 | ||
| Philis-Tsimikas et al, 2019. DUALTM IX | -1.94 | 0.95 | 210 | -1.68 | 1.05 | 210 | 3.2% | -0.26 [-0.45, -0.07] | 2019 | ||
| Novo Nordisk, 2018 | -1.2 | 0.9 | 267 | -1.2 | 0.9 | 265 | 4.4% | 0.00 [-0.15, 0.15] | 2018 | ||
| Rosenstock J. (2018). BRIGHT Trial | -1.59 | 0.037 | 463 | -1.64 | 0.037 | 466 | 12.1% | 0.05 [0.05, 0.05] | 2018 | ||
| Novo Nordisk, 2017 DUAL VII | -1.48 | 0.05 | 252 | -1.46 | 0.05 | 254 | 12.1% | -0.02 [-0.03, -0.01] | 2017 | ||
| Wysham, K. et al, 2017. SWITCH 2 Trial | -0.49 | 0.99 | 360 | -0.58 | 1.02 | 360 | 4.6% | 0.09 [-0.06, 0.24] | 2017 | ||
| Kumar S., 2017. BOOST Trial. | -1.65 | 1.28 | 266 | -1.72 | 1.17 | 264 | 2.8% | 0.07 [-0.14, 0.28] | 2017 | ||
| Lane, W. et al, 2017. SWITCH 1 Trial. | -0.73 | 0.89 | 249 | -0.66 | 0.76 | 252 | 4.7% | -0.07 [-0.22, 0.08] | 2017 | ||
| Pan C., 2016. BEGIN ONCE. | -1.3 | 1.1 | 555 | -1.2 | 1 | 278 | 4.5% | -0.10 [-0.25, 0.05] | 2016 | ||
| Lingvay, 2016 | -1.81 | 1.08 | 278 | -1.13 | 0.98 | 279 | 3.8% | -0.68 [-0.85, -0.51] | 2016 | ||
| Novo Nordisk 2015, BEGIN Once Asia | -1.24 | 0.87 | 289 | -1.35 | 0.87 | 146 | 3.7% | 0.11 [-0.06, 0.28] | 2015 | ||
| Novo Nordisk, 2015, (BEGIN T1 LONG) | -0.27 | 0.75 | 472 | -0.24 | 0.86 | 157 | 4.5% | -0.03 [-0.18, 0.12] | 2015 | ||
| Novo Nordisk, 2015, (BEGINTM: FLEX 2) | -1.28 | 1 | 257 | -1.26 | 1.07 | 230 | 3.4% | -0.02 [-0.20, 0.16] | 2015 | ||
| Novo Nordisk, 2015, BEGIN EASY | -1.05 | 0.94 | 233 | -1.36 | 0.95 | 234 | 3.8% | 0.31 [0.14, 0.48] | 2015 | ||
| Novo Nordisk, 2015.NCT00612040 | -0.57 | 0.76 | 119 | -0.62 | 0.68 | 59 | 2.6% | 0.05 [-0.17, 0.27] | 2015 | ||
| Novo nordisk, 2015 (BEGIN: LOW VOLUME) | -1.3 | 1.04 | 228 | -1.32 | 0.98 | 229 | 3.4% | 0.02 [-0.17, 0.21] | 2015 | ||
| Novo Nordisk, 2015 (BEGIN: Once Long). | -1.06 | 1.01 | 773 | -1.19 | 0.97 | 257 | 5.0% | 0.13 [-0.01, 0.27] | 2015 | ||
| Novo Nordisk, 2015 (BEGIN FLEX T1) | -0.13 | 0.67 | 329 | -0.21 | 0.73 | 164 | 5.2% | 0.08 [-0.05, 0.21] | 2015 | ||
| Total (95% CI) | 6607 | 5112 | 100.0% | -0.02 [-0.06, 0.02] | |||||||
| Heterogeneity: Tau2 = 0.00; Chi2 = 305.17, df = 18 (P < 0.00001); I2 = 94% | |||||||||||
| Test for overall effect: Z = 0.99 (P = 0.32) | |||||||||||
4.2 Change in Fasting Plasma Glucose (FPG) level
In terms of FPG, not all studies included in this review contained standard deviations and therefore the meta-analysis was performed drawing on the data which contain means and standard deviations. As a result, fifteen out of 21 studies were selected for this analysis with a total number of participants in IDeg groups (n=5448) and in IGlar groups (n=4092). No significant between-study heterogeneity was detected, (lower than 50%). In addition to this, the results obtained showed high significance (Z=11,82; p<0,00001) (see Figure 5). The estimated pooled mean difference shows that IDeg is more effective in the reduction of fasting blood glucose levels as compared to IGlar (MD = -0,40[-0,47 to-0,34]).
This result is consistent across all subgroups: T1D subgroup MD = -0,40[-0,46 to-0,35] p<0000,1, - 0%; T2D subgroup MD = -0,37 [-0,50 to -0,24] p<0,00001, - 49%; subgroup experienced MD = -0,41 [-0,45 to -0,35] p<0,00001, - 0%; subgroup naïve MD = -0,32 [-0,51 to -0,13] p<0,00001, - 65% (see Figure 6,7,8,9). A funnel plot was examined for asymmetry using the Egger's regression test. The Egger's test did not detect a true asymmetry (publication bias) as p= 0, 332 (See Table 6, Figure 10,11). The result of this test can be considered as a reliable one as more than 10 studies were included in the analysis (BMJ).
| Study or Subgroup | Experimental IDeg | Control IGlar | Weight | Mean Difference IV, Random, 95% CI | Year | Mean Difference IV, Random, 95% CI | ||||
| Mean | SD | Total | Mean | SD | Total | |||||
| Novo Nordisk, 2015 (BEGIN: Once Long). | -4.17 | 1.82 | 773 | -3.56 | 1.69 | 257 | 6.4% | -0.61 [-0.85, -0.37] | 2015 | |
| Novo Nordisk, 2015 (BEGIN FLEXT1), | -1.73 | 5.32 | 329 | -0.61 | 5.23 | 164 | 0.5% | -1.12 [-2.11, -0.13] | 2015 | |
| Novo Nordisk, 2015 (BEGIN T1 LONG) | -1.8 | 0.17 | 472 | -1.4 | 0.34 | 157 | 31.4% | -0.40 [-0.46, -0.34] | 2015 | |
| Novo Nordisk, 2015 BEGIN SIMPLIFY | -0.7 | 2.2 | 142 | 0 | 2.3 | 142 | 1.6% | -0.70 [-1.22, -0.18] | 2015 | |
| Novo Nordisk,2015 NCT00612040 | -1.6 | 4.56 | 119 | -0.54 | 4.36 | 59 | 0.2% | -1.06 [-2.44, 0.32] | 2015 | |
| Novo Nordisk, 2015NCT 01068665 (BEGIN: LOW VOLUME) | -3.7 | 3.06 | 228 | -3.38 | 2.96 | 229 | 1.4% | -0.32 [-0.87, 0.23] | 2015 | |
| Pan C.,2016.BEGIN ONCE. | -3.35 | 2.91 | 555 | -3.14 | 2.71 | 278 | 2.6% | -0.21 [-0.61, 0.19] | 2016 | |
| Kumar S., 2017. BOOST trial. | -1.7 | 2.1 | 266 | -1.8 | 1.7 | 264 | 3.9% | 0.10 [-0.23, 0.43] | 2017 | |
| Lane W. et al,2017. SWITCH 1 | -1.95 | 3.57 | 249 | -1.58 | 3.56 | 252 | 1.1% | -0.37 [-0.99, 0.25] | 2017 | |
| Wysham, K. et al, 2017 SWITCH 2 | -1.8 | 2.3 | 360 | -1.6 | 2.2 | 360 | 3.8% | -0.20 [-0.53, 0.13] | 2017 | |
| Novo Nordisk, 2018, NCT02906917 | -2.7 | 3 | 267 | -2.3 | 3.1 | 265 | 1.6% | -0.40 [-0.92, 0.12] | 2018 | |
| Rosenstock J, 2018 BRIGHT Trial | -3.95 | 0.109 | 463 | -3.52 | 0.11 | 466 | 39.2% | -0.43 [-0.44, -0.42] | 2018 | |
| Philis-Tsimikas et al, 2019. DUALTM IX | -3.72 | 2.89 | 210 | -3.5 | 2.43 | 210 | 1.7% | -0.22 [-0.73, 0.29] | 2019 | |
| Philis-Tsimikas, 2020. CONCLUDE Trial. | -1.97 | 2.74 | 758 | -1.43 | 3.1 | 759 | 4.6% | -0.54 [-0.83, -0.25] | 2020 | |
| Total (95% CI) | 5191 | 3862 | 100.0% | -0.40 [-0.47, -0.34] | ||||||
| Heterogeneity: Tau2 = 0.00; Chi2 = 21.44, df = 13 (P = 0.06); I2 = 39% | ||||||||||
| Test for overall effect: Z = 11.82 (P < 0.00001) | ||||||||||
Figure 5: Forest Plot for FPG Figure 6: Subgroup T1D
| Study or Subgroup | Experimental IDeg | Control IGlar | Weight | Mean Difference IV, Random, 95% CI | Year | Mean Difference IV, Random, 95% CI | ||||
| Mean | SD | Total | Mean | SD | Total | |||||
| 5.1.1 New Subgroup | ||||||||||
| Novo Nordisk, 2015 (BEGIN: Once Long). | -4.17 | 1.82 | 773 | -3.56 | 1.69 | 257 | 0.0% | -0.61 [-0.85, -0.37] | 2015 | |
| Novo Nordisk, 2015 (BEGIN FLEX T1), | -1.73 | 5.32 | 329 | -0.61 | 5.23 | 164 | 0.3% | -1.12 [-2.11, -0.13] | 2015 | |
| Novo Nordisk, 2015 (BEGIN T1 LONG) | -1.8 | 0.17 | 472 | -1.4 | 0.34 | 157 | 98.8% | -0.40 [-0.46, -0.34] | 2015 | |
| Novo Nordisk, 2015 BEGIN SIMILIFY | -0.7 | 2.2 | 142 | 0 | 2.3 | 142 | 0.0% | -0.70 [-1.22, -0.18] | 2015 | |
| Novo Nordisk,2015 NCT00612040 | -1.6 | 4.56 | 119 | -0.54 | 4.36 | 59 | 0.2% | -1.06 [-2.44, 0.32] | 2015 | |
| Novo Nordisk, 2015NCT 01068665 (BEGIN: LOW VOLUME) | -3.7 | 3.06 | 228 | -3.38 | 2.96 | 229 | 0.0% | -0.32 [-0.87, 0.23] | 2015 | |
| Pan C.,2016.BEGIN ONCE. | -3.35 | 2.91 | 555 | -3.14 | 2.71 | 278 | 0.0% | -0.21 [-0.61, 0.19] | 2016 | |
| Kumar S., 2017. BOOST trial. | -1.7 | 2.1 | 266 | -1.8 | 1.7 | 264 | 0.0% | 0.10 [-0.23, 0.43] | 2017 | |
| Lane W. et al,2017. SWITCH 1 | -1.95 | 3.57 | 249 | -1.58 | 3.56 | 252 | 0.8% | -0.37 [-0.99, 0.25] | 2017 | |
| Wysham, K. et al, 2017 SWITCH 2 | -1.8 | 2.3 | 360 | -1.6 | 2.2 | 360 | 0.0% | -0.20 [-0.53, 0.13] | 2017 | |
| Novo Nordisk, 2018, NCT02906917 | -2.7 | 3 | 267 | -2.3 | 3.1 | 265 | 0.0% | -0.40 [-0.92, 0.12] | 2018 | |
| Rosenstock J, 2018 BRIGHT Trial | -3.95 | 0.109 | 463 | -3.52 | 0.11 | 466 | 0.0% | -0.43 [-0.44, -0.42] | 2018 | |
| Philis-Tsimikas et al, 2019. DUALTM IX | -3.72 | 2.89 | 210 | -3.5 | 2.43 | 210 | 0.0% | -0.22 [-0.73, 0.29] | 2019 | |
| Philis-Tsimikas, 2020. CONCLUDE Trial. | -1.97 | 2.74 | 758 | -1.43 | 3.1 | 759 | 0.0% | -0.54 [-0.83, -0.25] | 2020 | |
| Subtotal (95% CI) | 1169 | 632 | 100.0% | -0.40 [-0.46, -0.35] | ||||||
| Heterogeneity: Tau = 0.00; Chi = 2.92, df = 3 (P = 0.40); I = 0% | ||||||||||
| Test for overall effect: Z = 14.36 (P < 0.00001) | ||||||||||
| Total (95% CI) | 1169 | 632 | 100.0% | -0.40 [-0.46, -0.35] | ||||||
| Heterogeneity: Tau = 0.00; Chi = 2.92, df = 3 (P = 0.40); I = 0% | ||||||||||
| Test for overall effect: Z = 14.36 (P < 0.00001) | ||||||||||
| Test for subgroup differences: Not applicable | ||||||||||
| Novo Nordisk, 2015 (BEGIN: Once Long). | -4.17 | 1.82 | 773 | -3.56 | 1.69 | 257 | 13.9% | -0.61 [-0.85, -0.37] | 2015 | |
| Novo Nordisk, 2015 (BEGIN FLEX T1), | -1.73 | 5.32 | 329 | -0.61 | 5.23 | 164 | 0.0% | -1.12 [-2.11, -0.13] | 2015 | |
| Novo Nordisk, 2015 (BEGIN T1 LONG) | -1.8 | 0.17 | 472 | -1.4 | 0.34 | 157 | 0.0% | -0.40 [-0.46, -0.34] | 2015 | |
| Novo Nordisk, 2015 BEGIN SIMPLIFY | -0.7 | 2.2 | 142 | 0 | 2.3 | 142 | 5.1% | -0.70 [-1.22, -0.18] | 2015 | |
| Novo Nordisk,2015 NCT00612040 | -1.6 | 4.56 | 119 | -0.54 | 4.36 | 59 | 0.0% | -1.06 [-2.44, 0.32] | 2015 | |
| Novo Nordisk, 2015NCT 01068665 (BEGIN: LOW VOLUME) | -3.7 | 3.06 | 228 | -3.38 | 2.96 | 229 | 4.7% | -0.32 [-0.87, 0.23] | 2015 | |
| Pan C.,2016.BEGIN ONCE. | -3.35 | 2.91 | 555 | -3.14 | 2.71 | 278 | 7.7% | -0.21 [-0.61, 0.19] | 2016 | |
| Kumar S., 2017. BOOST trial. | -1.7 | 2.1 | 266 | -1.8 | 1.7 | 264 | 10.1% | 0.10 [-0.23, 0.43] | 2017 | |
| Lane W. et al,2017. SWITCH 1 | -1.95 | 3.57 | 249 | -1.58 | 3.56 | 252 | 0.0% | -0.37 [-0.99, 0.25] | 2017 | |
| Wysham, K. et al, 2017 SWITCH 2 | -1.8 | 2.3 | 360 | -1.6 | 2.2 | 360 | 10.0% | -0.20 [-0.53, 0.13] | 2017 | |
| Novo Nordisk, 2018, NCT02906917 | -2.7 | 3 | 267 | -2.3 | 3.1 | 265 | 5.2% | -0.40 [-0.92, 0.12] | 2018 | |
| Rosenstock J, 2018 BRIGHT Trial | -3.95 | 0.109 | 463 | -3.52 | 0.11 | 466 | 26.6% | -0.43 [-0.44, -0.42] | 2018 | |
| Philis-Tsimikas et al, 2019. DUALTM IX | -3.72 | 2.89 | 210 | -3.5 | 2.43 | 210 | 5.3% | -0.22 [-0.73, 0.29] | 2019 | |
| Philis-Tsimikas, 2020. CONCLUDE Trial. | -1.97 | 2.74 | 758 | -1.43 | 3.1 | 759 | 11.4% | -0.54 [-0.83, -0.25] | 2020 | |
| Subtotal (95% CI) | 4022 | 3230 | 100.0% | -0.37 [-0.50, -0.24] | ||||||
| Heterogeneity: Tau = 0.02; Chi = 17.71, df = 9 (P = 0.04); I = 49%Test for overall effect: Z = 5.52 (P < 0.00001) | ||||||||||
| Total (95% CI) | 4022 | 3230 | 100.0% | -0.37 [-0.50, -0.24] | ||||||
| Heterogeneity: Tau = 0.02; Chi = 17.71, df = 9 (P = 0.04); I = 49%Test for overall effect: Z = 5.52 (P < 0.00001) | ||||||||||
| Test for subgroup differences: Not applicable | ||||||||||
Figure 7: Subgroup T2D
| Study or Subgroup | Experimental IDeg | Control IGlar | Weight | Mean Difference IV, Random, 95% CI | Year | Mean Difference IV, Random, 95% CI | ||||
| Mean | SD | Total | Mean | SD | Total | |||||
| 5.1.1 New Subgroup | ||||||||||
| Novo Nordisk, 2015 (BEGIN: Once Long). | -4.17 | 1.82 | 773 | -3.56 | 1.69 | 257 | 0.0% | -0.61 [-0.85, -0.37] | 2015 | |
| Novo Nordisk, 2015 (BEGIN FLEX T1), | -1.73 | 5.32 | 329 | -0.61 | 5.23 | 164 | 0.3% | -1.12 [-2.11, -0.13] | 2015 | |
| Novo Nordisk, 2015 (BEGIN T1 LONG) | -1.8 | 0.17 | 472 | -1.4 | 0.34 | 157 | 91.0% | -0.40 [-0.46, -0.34] | 2015 | |
| Novo Nordisk, 2015 BEGIN SIMPLIFY | -0.7 | 2.2 | 142 | 0 | 2.3 | 142 | 1.0% | -0.70 [-1.22, -0.18] | 2015 | |
| Novo Nordisk,2015 NCT00612040 | -1.6 | 4.56 | 119 | -0.54 | 4.36 | 59 | 0.1% | -1.06 [-2.44, 0.32] | 2015 | |
| Novo Nordisk, 2015NCT 01068665 (BEGIN: LOW VOLUME) | -3.7 | 3.06 | 228 | -3.38 | 2.96 | 229 | 0.0% | -0.32 [-0.87, 0.23] | 2015 | |
| Pan C.,2016.BEGIN ONCE. | -3.35 | 2.91 | 555 | -3.14 | 2.71 | 278 | 0.0% | -0.21 [-0.61, 0.19] | 2016 | |
| Kumar S., 2017. BOOST trial. | -1.7 | 2.1 | 266 | -1.8 | 1.7 | 264 | 0.0% | 0.10 [-0.23, 0.43] | 2017 | |
| Lane W. et al,2017. SWITCH 1 | -1.95 | 3.57 | 249 | -1.58 | 3.56 | 252 | 0.7% | -0.37 [-0.99, 0.25] | 2017 | |
| Wysham, K. et al, 2017 SWITCH 2 | -1.8 | 2.3 | 360 | -1.6 | 2.2 | 360 | 2.6% | -0.20 [-0.53, 0.13] | 2017 | |
| Novo Nordisk, 2018, NCT02906917 | -2.7 | 3 | 267 | -2.3 | 3.1 | 265 | 1.0% | -0.40 [-0.92, 0.12] | 2018 | |
| Rosenstock J, 2018 BRIGHT Trial | -3.95 | 0.109 | 463 | -3.52 | 0.11 | 466 | 0.0% | -0.43 [-0.44, -0.42] | 2018 | |
| Philis-Tsimikas et al, 2019. DUALTM IX | -3.72 | 2.89 | 210 | -3.5 | 2.43 | 210 | 0.0% | -0.22 [-0.73, 0.29] | 2019 | |
| Philis-Tsimikas, 2020. CONCLUDE Trial. | -1.97 | 2.74 | 758 | -1.43 | 3.1 | 759 | 3.2% | -0.54 [-0.83, -0.25] | 2020 | |
| Subtotal (95% CI) | 2696 | 2158 | 100.0% | -0.41 [-0.46, -0.35] | ||||||
| Heterogeneity: Tau = 0.00; Chi = 6.45, df = 7 (P = 0.49); I = 0% | ||||||||||
| Test for overall effect: Z = 15.04 (P < 0.00001) | ||||||||||
| Total (95% CI) | 2696 | 2158 | 100.0% | -0.41 [-0.46, -0.35] | ||||||
| Heterogeneity: Tau = 0.00; Chi = 6.45, df = 7 (P = 0.49); I = 0% | ||||||||||
| Test for overall effect: Z = 15.04 (P < 0.00001) | ||||||||||
| Test for subgroup differences: Not applicable | ||||||||||
Figure 8: Subgroup Experienced Figure 9: Subgroup Naïve
| Study or Subgroup | Experimental IDeg | Control IGlar | Weight | Mean Difference IV, Random, 95% CI | Year | Mean Difference IV, Random, 95% CI | ||||
| Mean | SD | Total | Mean | SD | Total | |||||
| 5.1.1 New Subgroup | ||||||||||
| Novo Nordisk, 2015 (BEGIN: Once Long). | -4.17 | 1.82 | 773 | -3.56 | 1.69 | 257 | 20.8% | -0.61 [-0.85, -0.37] | 2015 | |
| Novo Nordisk, 2015 (BEGIN FLEX T1), | -1.73 | 5.32 | 329 | -0.61 | 5.23 | 164 | 0.0% | -1.12 [-2.11, -0.13] | 2015 | |
| Novo Nordisk, 2015 (BEGIN T1 LONG) | -1.8 | 0.17 | 472 | -1.4 | 0.34 | 157 | 0.0% | -0.40 [-0.46, -0.34] | 2015 | |
| Novo Nordisk, 2015 BEGIN SIMPLIFY | -0.7 | 2.2 | 142 | 0 | 2.3 | 142 | 0.0% | -0.70 [-1.22, -0.18] | 2015 | |
| Novo Nordisk,2015 NCT00612040 | -1.6 | 4.56 | 119 | -0.54 | 4.36 | 59 | 0.0% | -1.06 [-2.44, 0.32] | 2015 | |
| Novo Nordisk, 2015NCT 01068665 (BEGIN: LOW VOLUME) | -3.7 | 3.06 | 228 | -3.38 | 2.96 | 229 | 8.7% | -0.32 [-0.87, 0.23] | 2015 | |
| Pan C.,2016.BEGIN ONCE. | -3.35 | 2.91 | 555 | -3.14 | 2.71 | 278 | 13.2% | -0.21 [-0.61, 0.19] | 2016 | |
| Kumar S., 2017. BOOST trial. | -1.7 | 2.1 | 266 | -1.8 | 1.7 | 264 | 16.4% | 0.10 [-0.23, 0.43] | 2017 | |
| Lane W. et al,2017. SWITCH 1 | -1.95 | 3.57 | 249 | -1.58 | 3.56 | 252 | 0.0% | -0.37 [-0.99, 0.25] | 2017 | |
| Wysham, K. et al, 2017 SWITCH 2 | -1.8 | 2.3 | 360 | -1.6 | 2.2 | 360 | 0.0% | -0.20 [-0.53, 0.13] | 2017 | |
| Novo Nordisk, 2018, NCT02906917 | -2.7 | 3 | 267 | -2.3 | 3.1 | 265 | 0.0% | -0.40 [-0.92, 0.12] | 2018 | |
| Rosenstock J, 2018 BRIGHT Trial | -3.95 | 0.109 | 463 | -3.52 | 0.11 | 466 | 31.2% | -0.43 [-0.44, -0.42] | 2018 | |
| Philis-Tsimikas et al, 2019. DUALTM IX | -3.72 | 2.89 | 210 | -3.5 | 2.43 | 210 | 9.7% | -0.22 [-0.73, 0.29] | 2019 | |
| Philis-Tsimikas, 2020. CONCLUDE Trial. | -1.97 | 2.74 | 758 | -1.43 | 3.1 | 759 | 0.0% | -0.54 [-0.83, -0.25] | 2020 | |
| Subtotal (95% CI) | 2495 | 1704 | 100.0% | -0.32 [-0.51, -0.13] | ||||||
| Heterogeneity: Tau = 0.03; Chi = 14.26, df = 5 (P = 0.01); I = 65%Test for overall effect: Z = 3.29 (P = 0.0010) | ||||||||||
| Total (95% CI) | 2495 | 1704 | 100.0% | -0.32 [-0.51, -0.13] | ||||||
| Heterogeneity: Tau = 0.03; Chi = 14.26, df = 5 (P = 0.01); I = 65%Test for overall effect: Z = 3.29 (P = 0.0010)Test for subgroup differences: Not applicable | ||||||||||
| Regression test for Funnel plot asymmetry ("Egger's test") | ||
| z | P | |
| sei | 0.969 | 0.332 |
4.3 Safety Parameters
Body Weight Gain
Nine out of 21 studies which contained standard deviations of the mean were selected for this analysis with a total number of 2401 participants in IDeg groups and 2179 in IGlar groups. The analysis detected considerable between-studies heterogeneity . After the exclusion of the study - Lingvay, 2016 DUAL TM V heterogeneity fell to (see Figure 12,13). The results revealed that a treatment with IDeg is associated with less weight gain and the difference is statistically significant with MD -0,84kg [95% -1,50 to -0,18], Z=2,50 and p=0,01 (see Figure 12). The analyses of subgroups showed that all subgroups (T2D,T1D, insulin experienced), except the insulin naïve group, demonstrate a statistically significant reduction in weight gain associated with insulin degludec: T2D subgroup = -0,91(-1,73 to -0,08) p=0,03, Z=2,16, -94%; T1D subgroup = -0,60(-1,08 to -0,12) p=0,01, Z=2,44, =0%; subgroup experienced- -1,19(-2,11 to -0,28) p=
0,01, Z=2,55, (See Figure 14,15,17). The reduction ranges from -0,60 to -1,19kg. Subgroup which consisted of insulin naïve patients lacks statistical significance- -0,16[-0,48 to 0,17) p=0,35, (See Figure 16).
The funnel plot was examined for asymmetry and no publication bias was detected – Egger's test p =0,797(see Table 7, Figure 18,19). However, the number of studies examined was lower than 10, so this may weaken the validity of the test (BMJ).
| Study or Subgroup | Experimental IDeg | Control IGlar | Weight | Mean Difference IV, Random, 95% CI | Mean Difference IV, Random, 95% CI | ||||
| Mean | SD | Total | Mean | SD | Total | ||||
| Wysham K. et al, 2017, SWITCH 2 Trial | 1.5 | 4.4 | 360 | 1.8 | 3.1 | 360 | 11.3% | -0.30 [-0.86, 0.26] | |
| Rosenstock, 2018 BRIGHT Trial | 2 | 3.8 | 463 | 2.3 | 3.6 | 466 | 11.5% | -0.30 [-0.78, 0.18] | |
| Philis-Tsimikas et al, 2019 DUALTM X | 0 | 3.8 | 210 | 2 | 3.9 | 210 | 10.6% | -2.00 [-2.74, -1.26] | |
| Novo Nordisk, 2018 | 2.5 | 3.8 | 267 | 2.4 | 3.2 | 265 | 11.2% | 0.10 [-0.50, 0.70] | |
| Novo Nordisk, 2015 NCT 00612040 | 0.1 | 2.5 | 119 | 0.7 | 1.6 | 59 | 11.1% | -0.60 [-1.21, 0.01] | |
| Novo Nordisk, 2015 BEGIN SIMPLIFY | 0.1 | 0.4 | 142 | 0.6 | 2.2 | 142 | 11.8% | -0.50 [-0.87, -0.13] | |
| Novo Nordisk, 2015 BEGIN FLEX T1 | 1.3 | 3.6 | 329 | 1.9 | 4.5 | 164 | 10.4% | -0.60 [-1.39, 0.19] | |
| Novo Nordisk, 2015 BEGIN EASY | 0.8 | 3.9 | 233 | 1 | 3.7 | 234 | 10.8% | -0.20 [-0.89, 0.49] | |
| Lingvay, 2015 DUALTM V | -1.4 | 3.5 | 278 | 1.8 | 3.6 | 279 | 11.2% | -3.20 [-3.79, -2.61] | |
| Total (95% CI) | 2401 | 2179 | 100.0% | -0.84 [-1.50, -0.18] | |||||
| Heterogeneity: Tau2 = 0.92; Chi2 = 95.71, df = 8 (P < 0.00001); I2 = 92% | |||||||||
| Test for overall effect: Z = 2.50 (P = 0.01) | |||||||||
Figure 12: Forest Plot for Body Weight Gain
| Study or Subgroup | Experimental IDeg | Control IGlar | Weight | Mean Difference IV, Random, 95% CI | Mean Difference IV, Random, 95% CI | ||||
| Mean | SD | Total | Mean | SD | Total | ||||
| Wysham K. et al, 2017, SWITCH 2 Trial | 1.5 | 4.4 | 360 | 1.8 | 3.1 | 360 | 13.1% | -0.30 [-0.86, 0.26] | |
| Rosenstock, 2018 BRIGHT Trial | 2 | 3.8 | 463 | 2.3 | 3.6 | 466 | 14.3% | -0.30 [-0.78, 0.18] | |
| Philis-Tsimikas et al, 2019 DUALTM X | 0 | 3.8 | 210 | 2 | 3.9 | 210 | 10.6% | -2.00 [-2.74, -1.26] | |
| Novo Nordisk, 2018 | 2.5 | 3.8 | 267 | 2.4 | 3.2 | 265 | 12.5% | 0.10 [-0.50, 0.70] | |
| Novo Nordisk, 2015 NCT 00612040 | 0.1 | 2.5 | 119 | 0.7 | 1.6 | 59 | 12.4% | -0.60 [-1.21, 0.01] | |
| Novo Nordisk, 2015 BEGIN SIMPLIFY | 0.1 | 0.4 | 142 | 0.6 | 2.2 | 142 | 15.9% | -0.50 [-0.87, -0.13] | |
| Novo Nordisk, 2015 BEGIN FLEX T1 | 1.3 | 3.6 | 329 | 1.9 | 4.5 | 164 | 9.9% | -0.60 [-1.39, 0.19] | |
| Novo Nordisk, 2015 BEGIN EASY | 0.8 | 3.9 | 233 | 1 | 3.7 | 234 | 11.2% | -0.20 [-0.89, 0.49] | |
| Lingvay, 2015 DUALTM V | -1.4 | 3.5 | 278 | 1.8 | 3.6 | 279 | 0.0% | -3.20 [-3.79, -2.61] | |
| Total (95% CI) | 2123 | 1900 | 100.0% | -0.52 [-0.88, -0.16] | |||||
| Heterogeneity: Tau2 = 0.18; Chi2 = 21.82, df = 7 (P = 0.003); I2 = 68% Test for overall effect: Z = 2.82 (P = 0.005) | |||||||||
Figure 13: Lingvay, 2016 DUAL TM V Excluded (source of heterogeneity) Figure 14: Subgroup T2D
| Study or Subgroup | Experimental IDeg | Control IGlar | Weight | Mean Difference IV, Random, 95% CI | Mean Difference IV, Random, 95% CI | ||||
| Mean | SD | Total | Mean | SD | Total | ||||
| 1.1 New Subgroup | |||||||||
| Wysham K. et al, 2017, SWITCH 2 Trial | 1.5 | 4.4 | 360 | 1.8 | 3.1 | 360 | 14.4% | -0.30 [-0.86, 0.26] | |
| Rosenstock, 2018 BRIGHT Trial | 2 | 3.8 | 463 | 2.3 | 3.6 | 466 | 14.6% | -0.30 [-0.78, 0.18] | |
| Philis-Tsimikas et al, 2019 DUALTM X | 0 | 3.8 | 210 | 2 | 3.9 | 210 | 13.7% | -2.00 [-2.74, -1.26] | |
| Novo Nordisk, 2018 | 2.5 | 3.8 | 267 | 2.4 | 3.2 | 265 | 14.2% | 0.10 [-0.50, 0.70] | |
| Novo Nordisk, 2015 NCT 00612040 | 0.1 | 2.5 | 119 | 0.7 | 1.6 | 59 | 0.0% | -0.60 [-1.21, 0.01] | |
| Novo Nordisk, 2015 BEGIN SIMPLIFY | 0.1 | 0.4 | 142 | 0.6 | 2.2 | 142 | 14.9% | -0.50 [-0.87, -0.13] | |
| Novo Nordisk, 2015 BEGIN FLEX T1 | 1.3 | 3.6 | 329 | 1.9 | 4.5 | 164 | 0.0% | -0.60 [-1.39, 0.19] | |
| Novo Nordisk, 2015 BEGIN EASY | 0.8 | 3.9 | 233 | 1 | 3.7 | 234 | 13.9% | -0.20 [-0.89, 0.49] | |
| Lingvay, 2015 DUALTM V | -1.4 | 3.5 | 278 | 1.8 | 3.6 | 279 | 14.3% | -3.20 [-3.79, -2.61] | |
| Subtotal (95% CI) | 1953 | 1956 | 100.0% | -0.91 [-1.73, -0.08] | |||||
| Heterogeneity: Tau2 = 1.15; Chi2 = 95.30, df = 6 (P < 0.00001); I2 = 94% | |||||||||
| Test for overall effect: Z = 2.16 (P = 0.03) | |||||||||
| Total (95% CI) | 1953 | 1956 | 100.0% | -0.91 [-1.73, -0.08] | |||||
| Heterogeneity: Tau2 = 1.15; Chi2 = 95.30, df = 6 (P < 0.00001); I2 = 94% | |||||||||
| Test for overall effect: Z = 2.16 (P = 0.03) | |||||||||
| Test for subgroup differences: Not applicable | |||||||||
| 1.1.1 New Subgroup | |||||||||
| Wysham K. et al, 2017, SWITCH 2 Trial | 1.5 | 4.4 | 360 | 1.8 | 3.1 | 360 | 0.0% | -0.30 [-0.86, 0.26] | |
| Rosenstock, 2018 BRIGHT Trial | 2 | 3.8 | 463 | 2.3 | 3.6 | 466 | 0.0% | -0.30 [-0.78, 0.18] | |
| Philis-Tsimikas et al, 2019 DUALTM X | 0 | 3.8 | 210 | 2 | 3.9 | 210 | 0.0% | -2.00 [-2.74, -1.26] | |
| Novo Nordisk, 2018 | 2.5 | 3.8 | 267 | 2.4 | 3.2 | 265 | 0.0% | 0.10 [-0.50, 0.70] | |
| Novo Nordisk, 2015 NCT 00612040 | 0.1 | 2.5 | 119 | 0.7 | 1.6 | 59 | 62.9% | -0.60 [-1.21, 0.01] | |
| Novo Nordisk, 2015 BEGIN SIMPLIFY | 0.1 | 0.4 | 142 | 0.6 | 2.2 | 142 | 0.0% | -0.50 [-0.87, -0.13] | |
| Novo Nordisk, 2015 BEGIN FLEX T1 | 1.3 | 3.6 | 329 | 1.9 | 4.5 | 164 | 37.1% | -0.60 [-1.39, 0.19] | |
| Novo Nordisk, 2015 BEGIN EASY | 0.8 | 3.9 | 233 | 1 | 3.7 | 234 | 0.0% | -0.20 [-0.89, 0.49] | |
| Lingvay, 2015 DUALTM V | -1.4 | 3.5 | 278 | 1.8 | 3.6 | 279 | 0.0% | -3.20 [-3.79, -2.61] | |
| Subtotal (95% CI) | 448 | 223 | 100.0% | -0.60 [-1.08, -0.12] | |||||
| Heterogeneity: Tau2 = 0.00; Chi2 = 0.00, df = 1 (P = 1.00); I2 = 0% | |||||||||
| Test for overall effect: Z = 2.44 (P = 0.01) | |||||||||
| Total (95% CI) | 448 | 223 | 100.0% | -0.60 [-1.08, -0.12] | |||||
| Heterogeneity: Tau2 = 0.00; Chi2 = 0.00, df = 1 (P = 1.00); I2 = 0% | |||||||||
| Mean | SD | Total | Mean | SD | Total | ||||
| 1.1.1 New Subgroup | |||||||||
| Wysham K. et al, 2017, SWITCH 2 Trial | 1.5 | 4.4 | 360 | 1.8 | 3.1 | 360 | 0.0% | -0.30 [-0.86, 0.26] | |
| Rosenstock, 2018 BRIGHT Trial | 2 | 3.8 | 463 | 2.3 | 3.6 | 466 | 47.3% | -0.30 [-0.78, 0.18] | |
| Philis-Tsimikas et al, 2019 DUALTM X | 0 | 3.8 | 210 | 2 | 3.9 | 210 | 0.0% | -2.00 [-2.74, -1.26] | |
| Novo Nordisk, 2018 | 2.5 | 3.8 | 267 | 2.4 | 3.2 | 265 | 30.1% | 0.10 [-0.50, 0.70] | |
| Novo Nordisk, 2015 NCT 00612040 | 0.1 | 2.5 | 119 | 0.7 | 1.6 | 59 | 0.0% | -0.60 [-1.21, 0.01] | |
| Novo Nordisk, 2015 BEGIN SIMPLIFY | 0.1 | 0.4 | 142 | 0.6 | 2.2 | 142 | 0.0% | -0.50 [-0.87, -0.13] | |
| Novo Nordisk, 2015 BEGIN FLEX T1 | 1.3 | 3.6 | 329 | 1.9 | 4.5 | 164 | 0.0% | -0.60 [-1.39, 0.19] | |
| Novo Nordisk, 2015 BEGIN EASY | 0.8 | 3.9 | 233 | 1 | 3.7 | 234 | 22.6% | -0.20 [-0.89, 0.49] | |
| Lingvay, 2015 DUALTM V | -1.4 | 3.5 | 278 | 1.8 | 3.6 | 279 | 0.0% | -3.20 [-3.79, -2.61] | |
| Subtotal (95% CI) | 963 | 965 | 100.0% | -0.16 [-0.48, 0.17] | |||||
| Heterogeneity: Tau2 = 0.00; Chi2 = 1.07, df = 2 (P = 0.58); I2 = 0% | |||||||||
| Test for overall effect: Z = 0.94 (P = 0.35) | |||||||||
| Total (95% CI) | 963 | 965 | 100.0% | -0.16 [-0.48, 0.17] | |||||
| Heterogeneity: Tau2 = 0.00; Chi2 = 1.07, df = 2 (P = 0.58); I2 = 0% | |||||||||
Figure 16: Subgroup Naïve
| Study or Subgroup | Experimental IDeg | Control IGlar | Weight | Mean Difference IV, Random, 95% CI | Mean Difference IV, Random, 95% CI | ||||
| Mean | SD | Total | Mean | SD | Total | ||||
| 1.1.1 New Subgroup | |||||||||
| Wysham K. et al, 2017, SWITCH 2 Trial | 1.5 | 4.4 | 360 | 1.8 | 3.1 | 360 | 16.9% | -0.30 [-0.86, 0.26] | |
| Rosenstock, 2018 BRIGHT Trial | 2 | 3.8 | 463 | 2.3 | 3.6 | 466 | 0.0% | -0.30 [-0.78, 0.18] | |
| Philis-Tsimikas et al, 2019 DUALTM X | 0 | 3.8 | 210 | 2 | 3.9 | 210 | 16.2% | -2.00 [-2.74, -1.26] | |
| Novo Nordisk, 2018 | 2.5 | 3.8 | 267 | 2.4 | 3.2 | 265 | 0.0% | 0.10 [-0.50, 0.70] | |
| Novo Nordisk, 2015 NCT 00612040 | 0.1 | 2.5 | 119 | 0.7 | 1.6 | 59 | 16.7% | -0.60 [-1.21, 0.01] | |
| Novo Nordisk, 2015 BEGIN SIMPLIFY | 0.1 | 0.4 | 142 | 0.6 | 2.2 | 142 | 17.5% | -0.50 [-0.87, -0.13] | |
| Novo Nordisk, 2015 BEGIN FLEX T1 | 1.3 | 3.6 | 329 | 1.9 | 4.5 | 164 | 15.9% | -0.60 [-1.39, 0.19] | |
| Novo Nordisk, 2015 BEGIN EASY | 0.8 | 3.9 | 233 | 1 | 3.7 | 234 | 0.0% | -0.20 [-0.89, 0.49] | |
| Lingvay, 2015 DUALTM V | -1.4 | 3.5 | 278 | 1.8 | 3.6 | 279 | 16.8% | -3.20 [-3.79, -2.61] | |
| Subtotal (95% CI) | 1438 | 1214 | 100.0% | -1.19 [-2.11, -0.28] | |||||
| Heterogeneity: Tau2 = 1.22; Chi2 = 76.35, df = 5 (P < 0.00001); I2 = 93% | |||||||||
| Test for overall effect: Z = 2.55 (P = 0.01) | |||||||||
| Total (95% CI) | 1438 | 1214 | 100.0% | -1.19 [-2.11, -0.28] | |||||
| Heterogeneity: Tau2 = 1.22; Chi2 = 76.35, df = 5 (P < 0.00001); I2 = 93% | |||||||||
| Test for overall effect: Z = 2.55 (P = 0.01) | |||||||||
Figure 17: Subgroup Experienced
Figure 19: Funnel Plot for Body Weight Gain Performed on JASP Table 7: Egger's Test
| Regression Test for Funnel Plot Asymmetry ("Egger's Test") | ||
| z | p | |
| sei | -0.257 | 0.797 |
| Regression Test for Funnel Plot Asymmetry ("Egger's Test") | ||
| z | p | |
| sei | -0.257 | 0.797 |
4.4 Overall Episodes of Hypoglycaemia
21 studies were selected for the analysis of the overall episodes of hypoglycaemia with a total number of 6764 participants in IDeg groups and 5269 in IGlar groups. The results showed that treatment with IDeg is associated with considerable reduction in overall episodes of hypoglycaemia - RR- 0,61[95% 0,47 to 0,77] which can be interpreted as lower risk of hypoglycaemia. The result has a high statistical power ; (see Figure 20).
However, a considerable heterogeneity was detected ( ). The subgroup analysis showed reduced heterogeneity in T1D groups (see Figure 21), but in other subgroups (naïve, experienced, T2D) heterogeneity remained high (see Figure 22, 23, 24). The subgroup analyses confirmed the consistency of the results favouring IDeg across all subgroups: subgroup insulin naïve-RR 0,58 [0,38 to 0,88] p=0,01; subgroup insulin experienced-RR 0,64 [0,48 to 0,84] p=0,001; subgroup T1D -RR 0,52 [0,33 to 0,72] p=0,001; subgroup T2D-RR 0,63 [0,49 to 0,82] p=0,0007 (See Figure 22, 23, 24). The subgroup analysis identified that T1D and insulin naïve groups showed the highest numbers for risk reduction 42% and 48%, respectively (see Figure 21, 24).
A funnel plot was examined for asymmetry using the Egger's regression test. The Egger's test which included 21 studies detected a statistically significant funnel plot asymmetry (publication bias) p=0,002 (see Table 8, Figure 25,26). The second Egger's test was performed including only those studies which showed statistically significant results. The second test indicated no true asymmetry p=0,651 (see Table 9, Figure 27). Therefore, the detected asymmetry can be explained by high between-studies heterogeneity and inclusion of studies with statistically insignificant results.
| Study or Subgroup | Experimental IDeg | Control IGlar | Weight | Risk Ratio M-H, Random, 95% CI | Year | Risk Ratio M-H, Random, 95% CI | ||
| Events | Total | Events | Total | |||||
| Novo Nordisk, 2015, (BEGIN T1 LONG) | 38 | 472 | 37 | 157 | 5.2% | 0.34 [0.23, 0.52] | 2015 | |
| Novo Nordisk, 2015, (BEGINTM: FLEX 2) | 36 | 257 | 35 | 230 | 5.1% | 0.92 [0.60, 1.41] | 2015 | |
| Novo Nordisk,2015.NCT00612040 | 6 | 119 | 7 | 59 | 2.7% | 0.42 [0.15, 1.21] | 2015 | |
| Novo Nordisk, 2015. NCT01076647BEGIN EASY | 10 | 233 | 16 | 234 | 3.7% | 0.63 [0.29, 1.35] | 2015 | |
| Novo nordisk, 2015 (BEGIN: LOW VOLUME) | 17 | 228 | 21 | 229 | 4.3% | 0.81 [0.44, 1.50] | 2015 | |
| Novo Nordisk, 2015 (BEGIN: Once Long). | 27 | 773 | 42 | 257 | 5.0% | 0.21 [0.13, 0.34] | 2015 | |
| Novo Nordisk,2015 (BEGIN FLEX T1) | 68 | 329 | 63 | 164 | 5.7% | 0.54 [0.40, 0.72] | 2015 | |
| Novo Nordisk 2015, BEGIN Once Asia | 30 | 289 | 37 | 146 | 5.1% | 0.41 [0.26, 0.64] | 2015 | |
| Lingvay, 2016 | 22 | 278 | 51 | 279 | 4.9% | 0.43 [0.27, 0.69] | 2016 | |
| Novo Nordisk, 2016 BEGIN SIMPIFY | 45 | 142 | 42 | 142 | 5.4% | 1.07 [0.75, 1.52] | 2016 | |
| Pan C.,2016.BEGIN ONCE. | 85 | 555 | 97 | 278 | 5.8% | 0.44 [0.34, 0.57] | 2016 | |
| Kumar S., 2017. BOOST Trial. | 42 | 266 | 21 | 264 | 4.8% | 1.98 [1.21, 3.26] | 2017 | |
| Lane, W. et al, 2017. SWITCH 1 Trial. | 20 | 249 | 22 | 252 | 4.4% | 0.92 [0.52, 1.64] | 2017 | |
| Novo Nordisk, 2017 DUAL VII | 10 | 252 | 82 | 254 | 4.2% | 0.12 [0.07, 0.23] | 2017 | |
| Wysham, K. et al, 2017.SWITCH 2 Trial | 19 | 360 | 27 | 360 | 4.5% | 0.70 [0.40, 1.24] | 2017 | |
| Kawaguchi, 2018 | 5 | 15 | 1 | 15 | 1.1% | 5.00 [0.66, 37.85] | 2018 | |
| Novo Nordisk, 2018 | 54 | 267 | 64 | 265 | 5.5% | 0.84 [0.61, 1.15] | 2018 | |
| Rosenstock J. (2018). BRIGHT Trial | 93 | 463 | 108 | 466 | 5.8% | 0.87 [0.68, 1.11] | 2018 | |
| Philis-Tsimikas et al, 2019. DUALTM IX | 37 | 210 | 90 | 210 | 5.5% | 0.41 [0.30, 0.57] | 2019 | |
| Philis-Tsimikas, 2020. CONCLUDE trial | 138 | 758 | 164 | 759 | 5.9% | 0.84 [0.69, 1.03] | 2020 | |
| Goldenberg et al, 2021. SWITCH PRO trial | 56 | 249 | 64 | 249 | 5.6% | 0.88 [0.64, 1.20] | 2021 | |
| Total (95% CI) | 6764 | 5269 | 100.0% | 0.61 [0.49, 0.77] | ||||
| Total events | 858 | 1091 | ||||||
| Heterogeneity: Tau2= 0.22; Chi2= 137.39, df = 20 (P < 0.00001); I2= 85% | ||||||||
| Test for overall effect: Z = 4.20 (P < 0.0001) | ||||||||
Figure 20: Forest Plot for the Overall Episodes of Hypoglycaemia (OEH)
| Study or Subgroup | Experimental IDeg | Control IGlar | Weight | Risk Ratio M-H, Random, 95% CI | Risk Ratio M-H, Random, 95% CI | ||
| Events | Total | Events | Total | ||||
| 7.1.1 New Subgroup | |||||||
| Goldenberg et al, 2021. SWITCH PRO trial | 56 | 249 | 64 | 249 | 0.0% | 0.88 [0.64, 1.20] | |
| Kawaguchi, 2018 | 5 | 15 | 1 | 15 | 0.0% | 5.00 [0.66, 37.85] | |
| Kumar S., 2017. BOOST Trial. | 42 | 266 | 21 | 264 | 0.0% | 1.98 [1.21, 3.26] | |
| Lane, W. et al, 2017. SWITCH 1 Trial. | 20 | 249 | 22 | 252 | 23.0% | 0.92 [0.52, 1.64] | |
| Lingvay, 2016 | 22 | 278 | 51 | 279 | 0.0% | 0.43 [0.27, 0.69] | |
| Novo Nordisk, 2015, (BEGIN T1 LONG) | 38 | 472 | 37 | 157 | 30.0% | 0.34 [0.23, 0.52] | |
| Novo Nordisk, 2015, (BEGINTM: FLEX 2) | 36 | 257 | 35 | 230 | 0.0% | 0.92 [0.60, 1.41] | |
| Novo Nordisk,2015.NCT00612040 | 6 | 119 | 7 | 59 | 11.1% | 0.42 [0.15, 1.21] | |
| Novo Nordisk, 2015. NCT01076647BEGIN EASY | 10 | 233 | 16 | 234 | 0.0% | 0.63 [0.29, 1.35] | |
| Novo nordisk, 2015 (BEGIN: LOW VOLUME) | 17 | 228 | 21 | 229 | 0.0% | 0.81 [0.44, 1.50] | |
| Novo Nordisk, 2015 (BEGIN: Once Long). | 27 | 773 | 42 | 257 | 0.0% | 0.21 [0.13, 0.34] | |
| Novo Nordisk,2015 (BEGIN FLEX T1) | 68 | 329 | 63 | 164 | 35.9% | 0.54 [0.40, 0.72] | |
| Novo Nordisk, 2016 BEGIN SIMPIFY | 45 | 142 | 42 | 142 | 0.0% | 1.07 [0.75, 1.52] | |
| Novo Nordisk, 2017 DUAL VII | 10 | 252 | 82 | 254 | 0.0% | 0.12 [0.07, 0.23] | |
| Novo Nordisk, 2018 | 54 | 267 | 64 | 265 | 0.0% | 0.84 [0.61, 1.15] | |
| Novo Nordisk 2015, BEGIN Once Asia | 30 | 289 | 37 | 146 | 0.0% | 0.41 [0.26, 0.64] | |
| Pan C.,2016.BEGIN ONCE. | 85 | 555 | 97 | 278 | 0.0% | 0.44 [0.34, 0.57] | |
| Philis-Tsimikas, 2020. CONCLUDE trial | 138 | 758 | 164 | 759 | 0.0% | 0.84 [0.69, 1.03] | |
| Philis-Tsimikas et al, 2019. DUALTM IX | 37 | 210 | 90 | 210 | 0.0% | 0.41 [0.30, 0.57] | |
| Rosenstock J. (2018). BRIGHT Trial | 93 | 463 | 108 | 466 | 0.0% | 0.87 [0.68, 1.11] | |
| Wysham, K. et al, 2017.SWITCH 2 Trial | 19 | 360 | 27 | 360 | 0.0% | 0.70 [0.40, 1.24] | |
| Subtotal (95% CI) | 1169 | 632 | 100.0% | 0.52 [0.35, 0.77] | |||
| Total events | 132 | 129 | |||||
| Heterogeneity: Tau2= 0.10; Chi2= 7.83, df = 3 (P = 0.05); I2= 62% | |||||||
| Test for overall effect: Z = 3.21 (P = 0.001) | |||||||
| Total (95% CI) | 1169 | 632 | 100.0% | 0.52 [0.35, 0.77] | |||
| Total events | 132 | 129 | |||||
| Heterogeneity: Tau2= 0.10; Chi2= 7.83, df = 3 (P = 0.05); I2= 62% | |||||||
| Test for subgroup differences: Not applicable | |||||||
| Events | Total | Events | Total | ||||
| 7.1.1 New Subgroup | |||||||
| Goldenberg et al, 2021. SWITCH PRO trial | 56 | 249 | 64 | 249 | 6.7% | 0.88 [0.64, 1.20] | |
| Kawaguchi, 2018 | 5 | 15 | 1 | 15 | 1.4% | 5.00 [0.66, 37.85] | |
| Kumar S., 2017. BOOST Trial. | 42 | 266 | 21 | 264 | 5.9% | 1.98 [1.21, 3.26] | |
| Lane, W. et al, 2017. SWITCH 1 Trial. | 20 | 249 | 22 | 252 | 0.0% | 0.92 [0.52, 1.64] | |
| Lingvay, 2016 | 22 | 278 | 51 | 279 | 6.0% | 0.43 [0.27, 0.69] | |
| Novo Nordisk, 2015, (BEGIN T1 LONG) | 38 | 472 | 37 | 157 | 0.0% | 0.34 [0.23, 0.52] | |
| Novo Nordisk, 2015, (BEGINTM: FLEX 2) | 36 | 257 | 35 | 230 | 6.2% | 0.92 [0.60, 1.41] | |
| Novo Nordisk,2015.NCT00612040 | 6 | 119 | 7 | 59 | 0.0% | 0.42 [0.15, 1.21] | |
| Novo Nordisk, 2015. NCT01076647BEGIN EASY | 10 | 233 | 16 | 234 | 4.6% | 0.63 [0.29, 1.35] | |
| Novo nordisk, 2015 (BEGIN: LOW VOLUME) | 17 | 228 | 21 | 229 | 5.3% | 0.81 [0.44, 1.50] | |
| Novo Nordisk, 2015 (BEGIN: Once Long). | 27 | 773 | 42 | 257 | 6.1% | 0.21 [0.13, 0.34] | |
| Novo Nordisk,2015 (BEGIN FLEX T1) | 68 | 329 | 63 | 164 | 0.0% | 0.54 [0.40, 0.72] | |
| Novo Nordisk, 2016 BEGIN SIMPIFY | 45 | 142 | 42 | 142 | 6.6% | 1.07 [0.75, 1.52] | |
| Novo Nordisk, 2017 DUAL VII | 10 | 252 | 82 | 254 | 5.2% | 0.12 [0.07, 0.23] | |
| Novo Nordisk, 2018 | 54 | 267 | 64 | 265 | 6.7% | 0.84 [0.61, 1.15] | |
| Novo Nordisk 2015, BEGIN Once Asia | 30 | 289 | 37 | 146 | 6.2% | 0.41 [0.26, 0.64] | |
| Pan C.,2016.BEGIN ONCE. | 85 | 555 | 97 | 278 | 7.0% | 0.44 [0.34, 0.57] | |
| Philis-Tsimikas, 2020. CONCLUDE trial | 138 | 758 | 164 | 759 | 7.1% | 0.84 [0.69, 1.03] | |
| Philis-Tsimikas et al, 2019. DUALTM IX | 37 | 210 | 90 | 210 | 6.7% | 0.41 [0.30, 0.57] | |
| Rosenstock J. (2018). BRIGHT Trial | 93 | 463 | 108 | 466 | 7.0% | 0.87 [0.68, 1.11] | |
| Wysham, K. et al, 2017.SWITCH 2 Trial | 19 | 360 | 27 | 360 | 5.5% | 0.70 [0.40, 1.24] | |
| Subtotal (95% CI) | 5595 | 4637 | 100.0% | 0.63 [0.49, 0.82] | |||
| Total events | 726 | 962 | |||||
| Heterogeneity: Tau2= 0.24; Chi2= 124.12, df = 16 (P < 0.00001); I2= 87% | |||||||
| Test for overall effect: Z = 3.39 (P = 0.0007) | |||||||
| Total (95% CI) | 5595 | 4637 | 100.0% | 0.63 [0.49, 0.82] | |||
| Total events | 726 | 962 | |||||
| Heterogeneity: Tau2= 0.24; Chi2= 124.12, df = 16 (P < | |||||||
- 00001); I2= 87% Test for overall effect: Z = 3.39 (P = 0.0007) Test for subgroup differences: Not applicable Figure 21: Subgroup T1D
Figure 22: Subgroup T2D
| Study or Subgroup | Experimental IDeg | Control IGlar | Weight | Risk Ratio M-H, Random, 95% CI | Risk Ratio M-H, Random, 95% CI | ||
| Events | Total | Events | Total | ||||
| 7.1.1 New Subgroup | |||||||
| Goldenberg et al, 2021. SWITCH PRO trial | 56 | 249 | 64 | 249 | 9.4% | 0.88 [0.64, 1.20] | |
| Kawaguchi, 2018 | 5 | 15 | 1 | 15 | 1.6% | 5.00 [0.66, 37.85] | |
| Kumar S., 2017. BOOST Trial. | 42 | 266 | 21 | 264 | 0.0% | 1.98 [1.21, 3.26] | |
| Lane, W. et al, 2017. SWITCH 1 Trial. | 20 | 249 | 22 | 252 | 7.3% | 0.92 [0.52, 1.64] | |
| Lingvay, 2016 | 22 | 278 | 51 | 279 | 8.1% | 0.43 [0.27, 0.69] | |
| Novo Nordisk, 2015, (BEGIN T1 LONG) | 38 | 472 | 37 | 157 | 8.6% | 0.34 [0.23, 0.52] | |
| Novo Nordisk, 2015, (BEGINTM: FLEX 2) | 36 | 257 | 35 | 230 | 8.5% | 0.92 [0.60, 1.41] | |
| Novo Nordisk,2015.NCT00612040 | 6 | 119 | 7 | 59 | 4.2% | 0.42 [0.15, 1.21] | |
| Novo Nordisk, 2015. NCT01076647BEGIN EASY | 10 | 233 | 16 | 234 | 0.0% | 0.63 [0.29, 1.35] | |
| Novo nordisk, 2015 (BEGIN: LOWVOLUME) | 17 | 228 | 21 | 229 | 0.0% | 0.81 [0.44, 1.50] | |
| Novo Nordisk, 2015 (BEGIN: Once Long). | 27 | 773 | 42 | 257 | 0.0% | 0.21 [0.13, 0.34] | |
| Novo Nordisk,2015 (BEGIN FLEX T1) | 68 | 329 | 63 | 164 | 9.6% | 0.54 [0.40, 0.72] | |
| Novo Nordisk, 2016 BEGIN SIMPIFY | 45 | 142 | 42 | 142 | 9.1% | 1.07 [0.75, 1.52] | |
| Novo Nordisk, 2017 DUAL VII | 10 | 252 | 82 | 254 | 6.8% | 0.12 [0.07, 0.23] | |
| Novo Nordisk, 2018 | 54 | 267 | 64 | 265 | 9.3% | 0.84 [0.61, 1.15] | |
| Novo Nordisk 2015, BEGIN Once Asia | 30 | 289 | 37 | 146 | 0.0% | 0.41 [0.26, 0.64] | |
| Pan C.,2016.BEGIN ONCE. | 85 | 555 | 97 | 278 | 0.0% | 0.44 [0.34, 0.57] | |
| Philis-Tsimikas, 2020. CONCLUDE trial | 138 | 758 | 164 | 759 | 10.1% | 0.84 [0.69, 1.03] | |
| Philis-Tsimikas et al, 2019. DUALTM IX | 37 | 210 | 90 | 210 | 0.0% | 0.41 [0.30, 0.57] | |
| Rosenstock J. (2018). BRIGHT Trial | 93 | 463 | 108 | 466 | 0.0% | 0.87 [0.68, 1.11] | |
| Wysham, K. et al, 2017.SWITCH 2 Trial | 19 | 360 | 27 | 360 | 7.4% | 0.70 [0.40, 1.24] | |
| Subtotal (95% CI) | 3747 | 3185 | 100.0% | 0.64 [0.48, 0.84] | |||
| Total events | 517 | 659 | |||||
| Heterogeneity: Tau2= 0.19; Chi2= 67.45, df = 12 (P < 0.00001); I2= 82% | |||||||
| Test for overall effect: Z = 3.22 (P = 0.001) | |||||||
| Total (95% CI) | 3747 | 3185 | 100.0% | 0.64 [0.48, 0.84] | |||
| Total events | 517 | 659 | |||||
| Heterogeneity: Tau2= 0.19; Chi2= 67.45, df = 12 (P < 0.0.0001); I2= 82% | |||||||
| Test for overall effect: Z = 3.22 (P = 0.001) | |||||||
| Test for subgroup differences: Not applicable | |||||||
| Events | Total | Events | Total | ||||
| 7.1.1 New Subgroup | |||||||
| Goldenberg et al, 2021. SWITCH PRO trial | 56 | 249 | 64 | 249 | 0.0% | 0.88 [0.64, 1.20] | |
| Kawaguchi, 2018 | 5 | 15 | 1 | 15 | 0.0% | 5.00 [0.66, 37.85] | |
| Kumar S., 2017. BOOST Trial. | 42 | 266 | 21 | 264 | 12.2% | 1.98 [1.21, 3.26] | |
| Lane, W. et al, 2017. SWITCH 1 Trial. | 20 | 249 | 22 | 252 | 0.0% | 0.92 [0.52, 1.64] | |
| Lingvay, 2016 | 22 | 278 | 51 | 279 | 0.0% | 0.43 [0.27, 0.69] | |
| Novo Nordisk, 2015, (BEGIN T1 LONG) | 38 | 472 | 37 | 157 | 0.0% | 0.34 [0.23, 0.52] | |
| Novo Nordisk, 2015, (BEGINTM: FLEX 2) | 36 | 257 | 35 | 230 | 0.0% | 0.92 [0.60, 1.41] | |
| Novo Nordisk,2015.NCT00612040 | 6 | 119 | 7 | 59 | 0.0% | 0.42 [0.15, 1.21] | |
| Novo Nordisk, 2015. NCT01076647BEGIN EASY | 10 | 233 | 16 | 234 | 9.8% | 0.63 [0.29, 1.35] | |
| Novo nordisk, 2015 (BEGIN: LOWVOLUME) | 17 | 228 | 21 | 229 | 11.2% | 0.81 [0.44, 1.50] | |
| Novo Nordisk, 2015 (BEGIN: Once Long). | 27 | 773 | 42 | 257 | 12.5% | 0.21 [0.13, 0.34] | |
| Novo Nordisk,2015 (BEGIN FLEX T1) | 68 | 329 | 63 | 164 | 0.0% | 0.54 [0.40, 0.72] | |
| Novo Nordisk, 2016 BEGIN SIMPIFY | 45 | 142 | 42 | 142 | 0.0% | 1.07 [0.75, 1.52] | |
| Novo Nordisk, 2017 DUAL VII | 10 | 252 | 82 | 254 | 0.0% | 0.12 [0.07, 0.23] | |
| Novo Nordisk, 2018 | 54 | 267 | 64 | 265 | 0.0% | 0.84 [0.61, 1.15] | |
| Novo Nordisk 2015, BEGIN Once Asia | 30 | 289 | 37 | 146 | 12.7% | 0.41 [0.26, 0.64] | |
| Pan C.,2016.BEGIN ONCE. | 85 | 555 | 97 | 278 | 14.0% | 0.44 [0.34, 0.57] | |
| Philis-Tsimikas, 2020. CONCLUDE trial | 138 | 758 | 164 | 759 | 0.0% | 0.84 [0.69, 1.03] | |
| Philis-Tsimikas et al, 2019. DUALTM IX | 37 | 210 | 90 | 210 | 13.5% | 0.41 [0.30, 0.57] | |
| Rosenstock J. (2018). BRIGHT Trial | 93 | 463 | 108 | 466 | 14.0% | 0.87 [0.68, 1.11] | |
| Wysham, K. et al, 2017.SWITCH 2 Trial | 19 | 360 | 27 | 360 | 0.0% | 0.70 [0.40, 1.24] | |
| Subtotal (95% CI) | 3017 | 2084 | 100.0% | 0.58 [0.38, 0.88] | |||
| Total events | 341 | 432 | |||||
| Heterogeneity: Tau2= 0.31; Chi2= 64.34, df = 7 (P < 0.00001); I2= 89% | |||||||
| Test for overall effect: Z = 2.56 (P = 0.01) | |||||||
| Total (95% CI) | 3017 | 2084 | 100.0% | 0.58 [0.38, 0.88] | |||
| Total events | 341 | 432 | |||||
| Heterogeneity: Tau2= 0.31; Chi2= 64.34, df = 7 (P < 0.00.001); I2= 89% | |||||||
| Test for overall effect: Z = 2.56 (P = 0.01) | |||||||
| Test for subgroup differences: Not applicable | |||||||
Figure 23. Subgroup Experienced
| Regression test for Funnel plot asymmetry ("Egger's test") | ||
| z | p | |
| sei | 3.049 | 0.002 |
| Regression test for Funnel plot asymmetry ("Egger's test") | ||
| z | p | |
| sei | 0.453 | 0.651 |
4.5 Episodes of Nocturnal Hypoglycaemia
Eighteen out of 21 studies were selected for this analysis with a total number of 6306 participants in IDeg groups and 4810 in IGlar groups. The results showed that treatment with IDeg is associated with a statistically significant reduction in episodes of nocturnal hypoglycaemia RR 0,48 [95%0,38 to 0,60] p<0,00001 (see Figure 28). The result can be interpreted as a treatment with IDeg is associated with 52% lower risk of nocturnal hypoglycaemia, which is twofold risk reduction compared to IGlar. The analysis detected high between-studies heterogeneity . The subgroup analyses did not considerably reduce heterogeneity (see Figure 29, 30, 31, 32).
The subgroup analyses confirmed the consistency of the results favouring IDeg across all subgroups: subgroup insulin naïve- RR 0,43 [0,28 to 0,64] p< 0,00001; subgroup insulin experienced- RR 0,52 [0,41 to 0,68], Z= 6,29 and p< 0,00001; subgroup T1D - RR 0,37 [0,23 to 0,61] p<0,00001; subgroup T2D- RR 0,51 [0,40 to 0,66] p< 0,00001(see Figure 29, 30, 31, 32). Similar to the results for the overall episodes of hypoglycaemia, this subgroup analysis also revealed that T1D and insulin naïve groups benefit most from a treatment with IDeg, demonstrating a considerable risk reduction of 63% and 57%, respectively (see Figure 29, 32).
A funnel plot has visible gaps at the bottom areas and therefore the funnel plot asymmetry was examined using the Egger's regression test (see Figure 33, 34). The Egger's test did not detect a true asymmetry (publication bias) as p=0, 948 (see Table 10). Therefore, the visible asymmetry on a funnel plot can be explained by high between-studies heterogeneity and inclusion of studies with insignificant results.
| Study or Subgroup | Experimental IDeg | Control IGlar | Weight | Risk Ratio M-H, Random, 95% CI | Year | Risk Ratio M-H, Random, 95% CI | ||
| Events | Total | Events | Total | |||||
| Novo Nordisk, 2015, (BEGIN T1 LONG) | 39 | 472 | 52 | 157 | 5.6% | 0.25 [0.17, 0.36] | 2015 | |
| Novo Nordisk, 2015, (BEGINTM: FLEX 2) | 56 | 257 | 75 | 230 | 6.0% | 0.67 [0.50, 0.90] | 2015 | |
| Novo Nordisk,2015.NCT00612040 | 5 | 119 | 12 | 59 | 3.0% | 0.21 [0.08, 0.56] | 2015 | |
| Novo nordisk, 2015 (BEGIN: LOW VOLUME) | 27 | 228 | 46 | 229 | 5.3% | 0.59 [0.38, 0.91] | 2015 | |
| Novo Nordisk, 2015 (BEGIN: Once Long). | 172 | 773 | 206 | 257 | 6.5% | 0.28 [0.24, 0.32] | 2015 | |
| Novo Nordisk,2015 (BEGIN FLEX T1) | 64 | 329 | 85 | 164 | 6.1% | 0.38 [0.29, 0.49] | 2015 | |
| Novo Nordisk 2015, BEGIN Once Asia | 78 | 289 | 124 | 146 | 6.3% | 0.32 [0.26, 0.39] | 2015 | |
| Lingvay, 2016 | 22 | 278 | 123 | 279 | 5.4% | 0.18 [0.12, 0.27] | 2016 | |
| Novo Nordisk, 2016 BEGIN SIMPIFY | 83 | 142 | 111 | 142 | 6.4% | 0.75 [0.63, 0.88] | 2016 | |
| Pan C.,2016.BEGIN ONCE. | 22 | 555 | 24 | 278 | 4.8% | 0.46 [0.26, 0.80] | 2016 | |
| Kumar S., 2017. BOOST Trial. | 19 | 266 | 53 | 264 | 5.1% | 0.36 [0.22, 0.58] | 2017 | |
| Lane, W. et al, 2017. SWITCH 1 Trial. | 28 | 249 | 37 | 252 | 5.2% | 0.77 [0.48, 1.21] | 2017 | |
| Novo Nordisk, 2017 DUAL VII | 13 | 252 | 17 | 254 | 4.1% | 0.77 [0.38, 1.55] | 2017 | |
| Wysham, K. et al, 2017.SWITCH 2 Trial | 55 | 360 | 93 | 360 | 6.0% | 0.59 [0.44, 0.80] | 2017 | |
| Novo Nordisk, 2018 | 113 | 267 | 189 | 265 | 6.4% | 0.59 [0.51, 0.70] | 2018 | |
| Rosenstock J. (2018). BRIGHT Trial | 183 | 463 | 226 | 466 | 6.5% | 0.81 [0.70, 0.94] | 2018 | |
| Philis-Tsimikas, 2020. CONCLUDE trial | 62 | 758 | 94 | 759 | 5.9% | 0.66 [0.49, 0.90] | 2020 | |
| Goldenberg et al, 2021. SWITCH PRO trial | 31 | 249 | 41 | 249 | 5.4% | 0.76 [0.49, 1.16] | 2021 | |
| Total (95% CI) | 6306 | 4810 | 100.0% | 0.48 [0.38, 0.60] | ||||
| Total events | 1072 | 1608 | ||||||
| Heterogeneity: Tau2 = 0.21; Chi2 = 215.32, df = 17 (P < 0.00001); I2 = 92% | ||||||||
| Test for overall effect: Z = 6.29 (P < 0.00001) | ||||||||
Figure 28: Forest Plot for Episodes of Nocturnal Hypoglycaemia (enh)
| Study or Subgroup | Experimental IDeg | Control IGlar | Weight | Risk Ratio M-H, Random, 95% CI | Year | Risk Ratio M-H, Random, 95% CI | ||
| Events | Total | Events | Total | |||||
| 11.1.1 New Subgroup | ||||||||
| Novo Nordisk, 2015, (BEGIN T1 LONG) | 39 | 472 | 52 | 157 | 28.4% | 0.25 [0.17, 0.36] | 2015 | |
| Novo Nordisk, 2015, (BEGINTM: FLEX 2) | 56 | 257 | 75 | 230 | 0.0% | 0.67 [0.50, 0.90] | 2015 | |
| Novo Nordisk,2015.NCT00612040 | 5 | 119 | 12 | 59 | 14.3% | 0.21 [0.08, 0.56] | 2015 | |
| Novo nordisk, 2015 (BEGIN: LOW VOLUME) | 27 | 228 | 46 | 229 | 0.0% | 0.59 [0.38, 0.91] | 2015 | |
| Novo Nordisk, 2015 (BEGIN: Once Long). | 172 | 773 | 206 | 257 | 0.0% | 0.28 [0.24, 0.32] | 2015 | |
| Novo Nordisk,2015 (BEGIN FLEX T1) | 64 | 329 | 85 | 164 | 30.9% | 0.38 [0.29, 0.49] | 2015 | |
| Novo Nordisk 2015, BEGIN Once Asia | 78 | 289 | 124 | 146 | 0.0% | 0.32 [0.26, 0.39] | 2015 | |
| Lingvay, 2016 | 22 | 278 | 123 | 279 | 0.0% | 0.18 [0.12, 0.27] | 2016 | |
| Novo Nordisk, 2016 BEGIN SIMPIFY | 83 | 142 | 111 | 142 | 0.0% | 0.75 [0.63, 0.88] | 2016 | |
| Pan C.,2016.BEGIN ONCE. | 22 | 555 | 24 | 278 | 0.0% | 0.46 [0.26, 0.80] | 2016 | |
| Kumar S., 2017. BOOST Trial. | 19 | 266 | 53 | 264 | 0.0% | 0.36 [0.22, 0.58] | 2017 | |
| Lane, W. et al, 2017. SWITCH 1 Trial. | 28 | 249 | 37 | 252 | 26.3% | 0.77 [0.48, 1.21] | 2017 | |
| Novo Nordisk, 2017 DUAL VII | 13 | 252 | 17 | 254 | 0.0% | 0.77 [0.38, 1.55] | 2017 | |
| Wysham, K. et al, 2017.SWITCH 2 Trial | 55 | 360 | 93 | 360 | 0.0% | 0.59 [0.44, 0.80] | 2017 | |
| Novo Nordisk, 2018 | 113 | 267 | 189 | 265 | 0.0% | 0.59 [0.51, 0.70] | 2018 | |
| Rosenstock J. (2018). BRIGHT Trial | 183 | 463 | 226 | 466 | 0.0% | 0.81 [0.70, 0.94] | 2018 | |
| Philis-Tsimikas, 2020. CONCLUDE trial | 62 | 758 | 94 | 759 | 0.0% | 0.66 [0.49, 0.90] | 2020 | |
| Goldenberg et al, 2021. SWITCH PRO trial | 31 | 249 | 41 | 249 | 0.0% | 0.76 [0.49, 1.16] | 2021 | |
| Subtotal (95% CI) | 1169 | 632 | 100.0% | 0.37 [0.23, 0.61] | ||||
| Total events | 136 | 186 | ||||||
| Heterogeneity: Tau2= 0.19; Chi2= 15.32, df = 3 (P = 0.002); I2= 80% | ||||||||
| Test for overall effect: Z = 3.92 (P < 0.0001) | ||||||||
| Total (95% CI) | 1169 | 632 | 100.0% | 0.37 [0.23, 0.61] | ||||
| Total events | 136 | 186 | ||||||
| Heterogeneity: Tau2= 0.19; Chi2= 15.32, df = 3 (P = 0.0O2); I2= 80% | ||||||||
| Test for overall effect: Z = 3.92 (P < 0.0001) | ||||||||
| Test for subgroup differences: Not applicable | ||||||||
| Events | Total | Events | Total | |||||
| 11.1.1 New Subgroup | ||||||||
| Novo Nordisk, 2015, (BEGIN T1 LONG) | 39 | 472 | 52 | 157 | 0.0% | 0.25 [0.17, 0.36] | 2015 | |
| Novo Nordisk, 2015, (BEGINTM: FLEX 2) | 56 | 257 | 75 | 230 | 7.5% | 0.67 [0.50, 0.90] | 2015 | |
| Novo Nordisk,2015.NCT00612040 | 5 | 119 | 12 | 59 | 0.0% | 0.21 [0.08, 0.56] | 2015 | |
| Novo nordisk, 2015 (BEGIN: LOW VOLUME) | 27 | 228 | 46 | 229 | 6.7% | 0.59 [0.38, 0.91] | 2015 | |
| Novo Nordisk, 2015 (BEGIN: Once Long). | 172 | 773 | 206 | 257 | 8.1% | 0.28 [0.24, 0.32] | 2015 | |
| Novo Nordisk,2015 (BEGIN FLEX T1) | 64 | 329 | 85 | 164 | 0.0% | 0.38 [0.29, 0.49] | 2015 | |
| Novo Nordisk 2015, BEGIN Once Asia | 78 | 289 | 124 | 146 | 7.9% | 0.32 [0.26, 0.39] | 2015 | |
| Lingvay, 2016 | 22 | 278 | 123 | 279 | 6.8% | 0.18 [0.12, 0.27] | 2016 | |
| Novo Nordisk, 2016 BEGIN SIMPIFY | 83 | 142 | 111 | 142 | 8.0% | 0.75 [0.63, 0.88] | 2016 | |
| Pan C.,2016.BEGIN ONCE. | 22 | 555 | 24 | 278 | 5.9% | 0.46 [0.26, 0.80] | 2016 | |
| Kumar S., 2017. BOOST Trial. | 19 | 266 | 53 | 264 | 6.3% | 0.36 [0.22, 0.58] | 2017 | |
| Lane, W. et al, 2017. SWITCH 1 Trial. | 28 | 249 | 37 | 252 | 0.0% | 0.77 [0.48, 1.21] | 2017 | |
| Novo Nordisk, 2017 DUAL VII | 13 | 252 | 17 | 254 | 5.1% | 0.77 [0.38, 1.55] | 2017 | |
| Wysham, K. et al, 2017.SWITCH 2 Trial | 55 | 360 | 93 | 360 | 7.4% | 0.59 [0.44, 0.80] | 2017 | |
| Novo Nordisk, 2018 | 113 | 267 | 189 | 265 | 8.0% | 0.59 [0.51, 0.70] | 2018 | |
| Rosenstock J. (2018). BRIGHT Trial | 183 | 463 | 226 | 466 | 8.1% | 0.81 [0.70, 0.94] | 2018 | |
| Philis-Tsimikas, 2020. CONCLUDE trial | 62 | 758 | 94 | 759 | 7.4% | 0.66 [0.49, 0.90] | 2020 | |
| Goldenberg et al, 2021. SWITCH PRO trial | 31 | 249 | 41 | 249 | 6.7% | 0.76 [0.49, 1.16] | 2021 | |
| Subtotal (95% CI) | 5137 | 4178 | 100.0% | 0.51 [0.40, 0.66] | ||||
| Total events | 936 | 1422 | ||||||
| Heterogeneity: Tau2= 0.21; Chi2= 189.61, df = 13 (P < 0.00001); I2= 93% | ||||||||
| Test for overall effect: Z = 5.11 (P < 0.00001) | ||||||||
| Total (95% CI) | 5137 | 4178 | 100.0% | 0.51 [0.40, 0.66] | ||||
| Total events | 936 | 1422 | ||||||
| Heterogeneity: Tau2= 0.21; Chi2= 189.61, df = 13 (P <0.00001); I2= 93% | ||||||||
| Test for overall effect: Z = 5.11 (P < 0.00001) | ||||||||
| Test for subgroup differences: Not applicable | ||||||||
Figure 29: Subgroup T1D
Figure 30: Subgroup T2D Figure 31: Subgroup experienced
| Study or Subgroup | Experimental IDeg | Control IGlar | Weight | Risk Ratio M-H, Random, 95% CI | Year | Risk Ratio M-H, Random, 95% CI | ||
| Events | Total | Events | Total | |||||
| 11.1.1 New Subgroup | ||||||||
| Novo Nordisk, 2015, (BEGIN T1 LONG) | 39 | 472 | 52 | 157 | 9.5% | 0.25 [0.17, 0.36] | 2015 | |
| Novo Nordisk, 2015, (BEGINTM: FLEX 2) | 56 | 257 | 75 | 230 | 10.3% | 0.67 [0.50, 0.90] | 2015 | |
| Novo Nordisk,2015.NCT00612040 | 5 | 119 | 12 | 59 | 4.2% | 0.21 [0.08, 0.56] | 2015 | |
| Novo nordisk, 2015 (BEGIN: LOW VOLUME) | 27 | 228 | 46 | 229 | 0.0% | 0.59 [0.38, 0.91] | 2015 | |
| Novo Nordisk, 2015 (BEGIN: Once Long). | 172 | 773 | 206 | 257 | 0.0% | 0.28 [0.24, 0.32] | 2015 | |
| Novo Nordisk,2015 (BEGIN FLEX T1) | 64 | 329 | 85 | 164 | 0.0% | 0.38 [0.29, 0.49] | 2015 | |
| Novo Nordisk 2015, BEGIN Once Asia | 78 | 289 | 124 | 146 | 0.0% | 0.32 [0.26, 0.39] | 2015 | |
| Lingvay, 2016 | 22 | 278 | 123 | 279 | 9.0% | 0.18 [0.12, 0.27] | 2016 | |
| Novo Nordisk, 2016 BEGIN SIMPIFY | 83 | 142 | 111 | 142 | 11.4% | 0.75 [0.63, 0.88] | 2016 | |
| Pan C.,2016.BEGIN ONCE. | 22 | 555 | 24 | 278 | 0.0% | 0.46 [0.26, 0.80] | 2016 | |
| Kumar S., 2017. BOOST Trial. | 19 | 266 | 53 | 264 | 0.0% | 0.36 [0.22, 0.58] | 2017 | |
| Lane, W. et al, 2017. SWITCH 1 Trial. | 28 | 249 | 37 | 252 | 8.6% | 0.77 [0.48, 1.21] | 2017 | |
| Novo Nordisk, 2017 DUAL VII | 13 | 252 | 17 | 254 | 6.3% | 0.77 [0.38, 1.55] | 2017 | |
| Wysham, K. et al, 2017.SWITCH 2 Trial | 55 | 360 | 93 | 360 | 10.2% | 0.59 [0.44, 0.80] | 2017 | |
| Novo Nordisk, 2018 | 113 | 267 | 189 | 265 | 11.4% | 0.59 [0.51, 0.70] | 2018 | |
| Rosenstock J. (2018). BRIGHT Trial | 183 | 463 | 226 | 466 | 0.0% | 0.81 [0.70, 0.94] | 2018 | |
| Philis-Tsimikas, 2020. CONCLUDE trial | 62 | 758 | 94 | 759 | 10.2% | 0.66 [0.49, 0.90] | 2020 | |
| Goldenberg et al, 2021. SWITCH PRO trial | 31 | 249 | 41 | 249 | 8.9% | 0.76 [0.49, 1.16] | 2021 | |
| Subtotal (95% CI) | 3403 | 3006 | 100.0% | 0.52 [0.41, 0.68] | ||||
| Total events | 507 | 844 | ||||||
| Heterogeneity: Tau2= 0.14; Chi2= 70.65, df = 10 (P < 0.00001); I2= 86% | ||||||||
| Test for overall effect: Z = 4.96 (P < 0.00001) | ||||||||
| Total (95% CI) | 3403 | 3006 | 100.0% | 0.52 [0.41, 0.68] | ||||
| Total events | 507 | 844 | ||||||
| Heterogeneity: Tau2= 0.14; Chi2= 70.65, df = 10 (P < 00.00001); I2= 86% | ||||||||
| Test for overall effect: Z = 4.96 (P < 0.00001) | ||||||||
| Test for subgroup differences: Not applicable | ||||||||
| 11.1 New Subgroup | ||||||||
| Novo Nordisk, 2015, (BEGIN T1 LONG) | 39 | 472 | 52 | 157 | 0.0% | 0.25 [0.17, 0.36] | 2015 | |
| Novo Nordisk, 2015, (BEGINTM: FLEX 2) | 56 | 257 | 75 | 230 | 0.0% | 0.67 [0.50, 0.90] | 2015 | |
| Novo Nordisk,2015.NCT00612040 | 5 | 119 | 12 | 59 | 0.0% | 0.21 [0.08, 0.56] | 2015 | |
| Novo nordisk, 2015 (BEGIN: LOW VOLUME) | 27 | 228 | 46 | 229 | 13.5% | 0.59 [0.38, 0.91] | 2015 | |
| Novo Nordisk, 2015 (BEGIN: Once Long). | 172 | 773 | 206 | 257 | 15.6% | 0.28 [0.24, 0.32] | 2015 | |
| Novo Nordisk,2015 (BEGIN FLEX T1) | 64 | 329 | 85 | 164 | 14.9% | 0.38 [0.29, 0.49] | 2015 | |
| Novo Nordisk 2015, BEGIN Once Asia | 78 | 289 | 124 | 146 | 15.3% | 0.32 [0.26, 0.39] | 2015 | |
| Lingvay, 2016 | 22 | 278 | 123 | 279 | 0.0% | 0.18 [0.12, 0.27] | 2016 | |
| Novo Nordisk, 2016 BEGIN SIMPIFY | 83 | 142 | 111 | 142 | 0.0% | 0.75 [0.63, 0.88] | 2016 | |
| Pan C.,2016.BEGIN ONCE. | 22 | 555 | 24 | 278 | 12.3% | 0.46 [0.26, 0.80] | 2016 | |
| Kumar S., 2017. BOOST Trial. | 19 | 266 | 53 | 264 | 12.9% | 0.36 [0.22, 0.58] | 2017 | |
| Lane, W. et al, 2017. SWITCH 1 Trial. | 28 | 249 | 37 | 252 | 0.0% | 0.77 [0.48, 1.21] | 2017 | |
| Novo Nordisk, 2017 DUAL VII | 13 | 252 | 17 | 254 | 0.0% | 0.77 [0.38, 1.55] | 2017 | |
| Wysham, K. et al, 2017.SWITCH 2 Trial | 55 | 360 | 93 | 360 | 0.0% | 0.59 [0.44, 0.80] | 2017 | |
| Novo Nordisk, 2018 | 113 | 267 | 189 | 265 | 0.0% | 0.59 [0.51, 0.70] | 2018 | |
| Rosenstock J. (2018). BRIGHT Trial | 183 | 463 | 226 | 466 | 15.6% | 0.81 [0.70, 0.94] | 2018 | |
| Philis-Tsimikas, 2020. CONCLUDE trial | 62 | 758 | 94 | 759 | 0.0% | 0.66 [0.49, 0.90] | 2020 | |
| Goldenberg et al, 2021. SWITCH PRO trial | 31 | 249 | 41 | 249 | 0.0% | 0.76 [0.49, 1.16] | 2021 | |
| Subtotal (95% CI) | 2903 | 1804 | 100.0% | 0.43 [0.28, 0.64] | ||||
| Total events | 565 | 764 | ||||||
| Heterogeneity: Tau2= 0.28; Chi2= 121.34, df = 6 (P < 0.00001); I2= 95% | ||||||||
| Test for overall effect: Z = 4.08 (P < 0.0001) | ||||||||
| Total (95% CI) | 2903 | 1804 | 100.0% | 0.43 [0.28, 0.64] | ||||
| Total events | 565 | 764 | ||||||
| Heterogeneity: Tau2= 0.28; Chi2= 121.34, df = 6 (P < 00.00001); I2= 95% | ||||||||
| Test for overall effect: Z = 4.08 (P < 0.0001) | ||||||||
| Test for subgroup differences: Not applicable | ||||||||
| Regression test for Funnel plot asymmetry ("Egger's test") | ||
| z | p | |
| sei | -0.066 | 0.948 |
4.6 The Level of Antibodies Cross-Reacting with Human Insulin
Seven out of 21 studies were selected for this analysis with a total number of 2903 participants in IDeg groups and 1461 in IGlar groups. The result of meta-analysis indicates numerically lower levels of antibodies cross-reacting with human insulin in IDeg groups MD -0,69 [-2,35 to 0,98], but the difference is not statistically significant p = 0,42 (see Figure 35). The funnel plot revealed a gap in the left bottom area but was not examined on asymmetry as the result is not statistically significant (see Figure 36).
| Study or Subgroup | Experimental IDeg | Control IGlar | Weight | Mean Difference IV, Random, 95% CI | Year | Mean Difference IV, Random, 95% CI | ||||
| Mean | SD | Total | Mean | SD | Total | |||||
| Novo Nordisk, 2015, (BEGIN T1 LONG) | 15.8 | 18 | 472 | 13 | 16.9 | 157 | 11.4% | 2.80 [-0.30, 5.90] | 2015 | |
| Novo Nordisk, 2015, (BEGINTM: FLEX 2) | 5.1 | 13.6 | 257 | 5 | 12.4 | 230 | 13.8% | 0.10 [-2.21, 2.41] | 2015 | |
| Novo nordisk, 2015 (BEGIN: LOW VOLUME) | 0.6 | 3 | 228 | 2.4 | 8.5 | 229 | 17.3% | -1.80 [-2.97, -0.63] | 2015 | |
| Novo Nordisk, 2015 (BEGIN: Once Long). | 1.1 | 5.5 | 773 | 2.5 | 7.8 | 257 | 17.6% | -1.40 [-2.43, -0.37] | 2015 | |
| Novo Nordisk,2015 (BEGIN FLEX T1) | 19.3 | 20.8 | 329 | 14.3 | 15.9 | 164 | 10.8% | 5.00 [1.69, 8.31] | 2015 | |
| Novo Nordisk 2015, BEGIN Once Asia | 0.5 | 2.3 | 289 | 6 | 15 | 146 | 13.4% | -5.50 [-7.95, -3.05] | 2015 | |
| Pan C.,2016.BEGIN ONCE. | 3.2 | 11.1 | 555 | 4.9 | 12.5 | 278 | 15.7% | -1.70 [-3.44, 0.04] | 2016 | |
| Total (95% CI) | 2903 | 1461 | 100.0% | -0.69 [-2.35, 0.98] | ||||||
| Heterogeneity: Tau2 = 3.82; Chi2 = 34.27, df = 6 (P < 0.00001); I2 = 82% | ||||||||||
| Test for overall effect: Z = 0.81 (P = 0.42) | ||||||||||
CHAPTER 5: DISCUSSION
This analysis shows that insulin degludec is associated with less glycaemic variability, a greater reduction in FPG levels, reduced weight gain and less overall and nocturnal hypoglycaemia across all T1D, T2D, insulin naïve and experienced groups. No significant difference was detected in the levels of HbA1c and the level of antibodies cross-reacting with human insulin between treatments with IDeg vs IGlar.
With regards to HbA1c levels, no significant difference was detected by this meta-analysis including T1D, T2D, insulin naïve and experienced groups. From one side, this indicates that generally, insulin glargine is not inferior to insulin degludec and possesses the ability to reach the same level of HbA1c and provide the similar level of glycaemic control. On the other side, the majority of included studies followed treat-to-target design and set non-inferiority of IDeg vs IGlar as the primary endpoint of the study. In this case, the difference between IDeg and IGlar was not expected. The longer observational or RCT studies without treat-to-target treatment strategy may clarify a reliability of the results reported.
This analysis revealed similar findings to most authors who performed meta-analyses on a change of HbA1c level- Madenidou, (2018), Zhang, (2018), Russel-Jones, (2015), and Zhou, (2019). The opposite result was reported in the review of Liu, (2018) where insulin glargine showed superiority in HbA1c reduction. However, this difference was not clinically relevant-MD = 0,04% [0.01% to 0,07%].
HbA1c is one of the most important diagnostic markers of diabetes management. This marker is directly linked with mean blood glucose concentrations and long-term complications caused by diabetes. This indicator reflects the mean blood glucose level that a patient has had during the previous three or four weeks.
Glycaemic control among diabetics is primarily guided by the systematic assessment of glycated hemoglobin. The recommended by American Diabetes Association and World Health Organisation level is set to be lower or equal to 7,0%. This level of HbA1c has been associated with a reduced risk of developing microvascular complications, retinopathy, neuropathy and nephropathy (Rezende, 2020; Dedov, 2021)
The analysis of pooled results of nine studies examining change in body weight demonstrates that IDeg is associated with less weight gain in comparison with IGlar. The difference is statistically significant across T2D, T1D and insulin experienced groups, but not for insulin naïve group. The analysis showed high heterogeneity in T2D and insulin experienced subgroups (up to 94%) and absence of heterogeneity in T1D group. This subgroup included only two studies, so the results may lack validity. Generally, the difference in weight gain heterogeneity in T1D group. This subgroup included only two studies, so the results may lack validity. Generally, the difference in weight gain -0,84 kg observed between IDeg and IGlar has a minimal effect in a clinical practice. However, the observations were made during a 24-week study duration, taking into account that most patients with diabetes use insulin for a lifetime, the difference might be larger. The absence of standard deviations (SD) and available dataset of study participants that is needed for SD calculations limited the number of studies included in the meta-analysis.
Generally, treatments with both insulins during the trial period (12 weeks in average) are associated with weight gain: in 5 studies it was minimal, ranging from 0,1 to 0,8 and in the remaining 3 studies, except Lingvay,2016, weight gain ranged from 1,8 to 2,5 kg (See Figure 12).
The findings of other authors varied. The review of Liu, (2018) including 15 studies revealed similar changes in body weight gain IDeg/IGlar -MD = 0,03 [0,11 to 0,18] p=0,67, while the review of Madenidou,(2018) including 36 studies reported that insulin glargine showed more favourable results compared to IDeg100, IDeg200 -MD = 0,75 kg [CI, 1,24 to 0,26 kg]. The review of Zhou, (2019) included six studies out of 15 in the meta-analysis of change in body weight gain- this analysis did not reveal statistically significant difference IDeg/IGlar -MD 0,23 [0.14 to 0,61] p = 0.22). Zhang, (2018) reported a minimal difference in favour of IDeg ETD - 0.09 kg [- 0,19 to 0,37] which is not clinically relevant.
Weight gain is one of the most common side effects of insulin therapy. The number of T2D patients who needs the administration of insulin in order to achieve adequate glycaemic control have been increasing in recent years. As most T2D patients have already had an excess body weight and cardiovascular complications this disadvantage of insulin therapy is particularly relevant in this group. According to DIGAMI 2 study including 865 survivors, the initiation of insulin treatment after myocardial infarction was closely associated with a weight gain and considerable increase in the incidence of reinfarction. The inferences were made based on the comparison of groups receiving only oral hypoglycaemic drugs or without any glucose lowering therapy and those who initiated treatment with insulin (Aas, 2009).
It has been estimated that during the first year of insulin therapy, the average weight gain ranges from 2 to 6 kilograms. However, this parameter demonstrates large differences depending on an individual; some patients experience moderate weight gain or even lose weight, while others suffer from substantial insulin-associated weight gain (Jansen, 2014).
According to several longitudinal observational studies elevated levels of HbA1c during long periods significantly increase the risk of developing cardiovascular and multivessel coronary artery disease in patients with Diabetes Type 2 (Rezende,2020; Dedov, 2019). Chronic hyperglycemia causes systemic inflammation through advanced glycation end products and reactive oxygen species. This chronic inflammation may result in vascular damage (Rezende, 2020).
In terms of overall and nocturnal hypoglycaemia, the groups receiving treatment with IDeg showed the lower rates of hypoglycaemic events. The rates were lower with IDeg during different study periods (titration and maintenance), however, the lowest rates of overall and nocturnal hypoglycaemia were reported during maintenance treatment periods in all populations.
The results of other researchers report similar findings with statistically significant reduction in overall episodes of hypoglycaemia associated with IDeg in T1D and T2D patients: Liu, (2018) RR-0,88 [0,81 to 0,96], subgroup analysis revealed that reduction was true only for T2D patients; Zhang, (2018) ERR 0,81 [0,72 to 0,92]; Ratner, (2015) overall T1D, T2D-RR 0,83 [0,74 to 0,94], T2D naïve -RR 0,83 [0,70to 0,98]; Madenidou,(2018) overall -OR 0,64 [0,43 to 0,96]. Among the existed reviews, the one of Zhou, (2019) did not reveal statistically significant difference in overall hypoglycaemia IDeg vs IGlar RR 0,98 [0,93 to 1,03] p = 0,43.
Regarding nocturnal hypoglycaemia,10 out of 18 individual trials showed a significant reduction in hypoglycaemia rates and remaining 8 showed non-significant difference. The meta-analysis of the pooled populations T1D+T2D, pooled T1D, pooled T2D demonstrates statistically significant reduction in nocturnal hypoglycaemia rates associated with insulin degludec.
Moreover, the reduction in hypoglycaemic episodes is accompanied with more physiological FPG levels as compared to IGlar. The meta-analysis of pooled estimates of 14 studies revealed that IDeg is associated with the greater reduction of fasting plasma glucose levels. The reduction was moderate but significant across all T1D, T2D, insulin experienced and naïve subgroups with absent or low heterogeneity except naïve group which showed considerable heterogeneity ( ). This suggests that IDeg is more effective in achieving FPG target levels without nocturnal hypoglycaemia in comparison with IGlar. In previous treatments with other basal insulins, it was rather problematic to reach FPG target without significant increase in risk of nocturnal hypoglycaemia. This fear of nocturnal hypoglycaemia prevented patients with diabetes from attempts to reach target FPG levels (Russel-Jones,2015). The IDeg showed the ability to solve this long -lasting problem of insulin therapy.
The findings of other authors examining nocturnal hypoglycaemia are quite consistent and similar to the results of this current meta-analysis. The meta-analysis of Heller, (2016) showed a considerable reduction in episodes of hypoglycaemia measured between 00.01-05.59 in subgroups T2D naïve- 0,64 [0,48 to 0,86], T2D basal-bolus group -0,77 [0,60 to 0,97]. All existed meta-analyses report significant a reduction of nocturnal hypoglycaemia in all T2D insulin naïve and experienced groups, and in most of T1D groups: Ratner,(2015)- overall T2D population RR- 0,83, T2D naïve- 0,64, T1D RR 0,75 [0,60 to 0,94]; Zhang, (2018) ERR-0,71 [0,63 too,80]; Zhou,(2019) RR 0,81 [0,75 to 0,88] p<0.0001; Liu, (2018) overall nocturnal RR = 0,74 [0,69 to 0,79], T1D RR - 0,74 [0,68 to 0,81], T2D RR - 0,74 [0,66 to 0,82] p<0,001.
Concerning FPG levels, the result obtained from the current study correlates with the findings of previous reviews: Russel-Jones, (2015); Zhang, (2018)- [ETD - 0.28 mmol/L (- 0.44; - 0.11)]; the meta-analysis of Liu, (2018) found almost the same results for a change in FPG - MD = -0.41[-0.54 to -0.28].
The analysis of FPG has remained as the one of the most precise diagnostic markers of glycemic control used in clinical practice. Along with the level of HbA1c, FPG is also a significant predictor of cardiovascular and other microvascular implications in patients with diabetes (Lu, 2019; Zhou, 2021).
Concerning the overall episodes of hypoglycaemia, this meta-analysis of pooled estimates revealed a statistically significant reduction in the risk of developing hypoglycaemia associated with insulin degludec. However, the analysis includes individual studies with non-significant differences in hypoglycaemia rates; 11 studies out of 21 have results which are not statistically significant.
Additionally, the remaining studies include three studies which showed the opposite results (IGlar's superiority in terms of event rate). All three studies have several limitations, for example the study of Kawaguchi, 2018- after switching to insulin degludec the dosage was not changed during the treatment periods and this led to the higher incidence of hypoglycaemia. The insulin requirement to achieve the same level of glycaemic control with IDeg is lower than with IGlar. This fact was confirmed by the researcher when the rates of hypoglycaemia dropped after the reduction in the dosage of IDeg. In addition to this, IGlar was used in concentration 300U/l which can affect the results, as a novel high-concentrated glargine may produce effect different from 100U/I (Reid, 2017). Also, the sample was small (consisted of 30 participants), which reduces generalizability and validity of the research.
The study of Kumar, (2017) showed 43% increase in hypoglycaemia events in IDeg groups, which the author explained by several flaws in
The study of Kumar, (2017) showed 43% increase in hypoglycaemia events in IDeg groups, which the author explained by several flaws in administration of IDeg and IGlar. IDeg and IGlar was administered at different times of the day and vary among patients depending on their lifestyle.
Also, patients in the IDeg group had the same time for bolus and IDeg injections which could trigger an increase in daytime postprandial hypoglycaemia, the daytime effects of the bolus component overlapped the effect of basal insulin (Kumar, 2017). The study BEGIN SIMPIFY had the similar to Kawaguchi, 2018 limitations (Novo Nordisk, 2015).
According to this analysis, IDeg demonstrates superiority in achieving normoglycaemia without nocturnal and overall confirmed hypoglycaemia. This aspect is particularly important as both hyperglycaemia and hypoglycaemia can lead to adverse cardiovascular consequences. The main problem of insulin therapy is the difficulty to reach stable glucose control within the recommended target levels (FPG <6,1mmol/l, after meal <7,8 mmol/l, HbA1c <7,0%) (Dedov, 2019; Dedov, 2021). Insulin degludec produces less hypoglycaemia and glycaemic variability and therefore ensures a more physiological glycaemic control. Variability in glucose control may increase risk of cardiovascular pathology in diabetics even when a patient has an acceptable HbA1c level (Rezende, 2020).
The meta-analysis of seven trials examining the level of cross-reacting antibodies against human insulins showed that treatments with insulin degludec versus insulin glargine did not reach a statistically significant difference and demonstrate similarity in this safety characteristic. This is the first meta-analysis examining the level of antibodies cross-reacting with human insulin produced after the treatment with IDeg vs IGlar, and therefore no valid comparison with other reviews can be conducted.
According to Vora, (2016), the author who compared the levels of antibodies cross-reacting with human insulin measured as mean differences, IDeg and IGlar produced a similar increase in antibodies' formation. Generally, antibodies produced during the treatment with both insulins remained low T1D (<20% B/T) and T2D (<6% B/T). In addition to this, antibody formation was not associated with change in HbA1c, insulin dose or rates of adverse events (Vora, 2016). The result of this meta-analysis confirms the findings of Vora, (2016).
5.1 Strengths of the Current Study
Systematic reviews and meta-analysis are ranked at the top of the hierarchy of evidence-based medicine and present the most valid and comprehensive quantitative evidence on the topic. Moreover, meta-analysis identifies lack of adequate evidence and reveals areas where additional research is needed. Meta-analysis strengthens evidence generated through the systematic review. Meta-analysis provides an opportunity to summarize findings of a large number of studies and surfaces associations that were not previously detected. Systematic review and meta-analysis provide a transparency which cannot be offered by a traditional, narrative synthesis of research findings. This characteristic helps to conduct a more objective evaluation of the evidence and resolve uncertainty when original research, reviews and editorials disagree (Littell, 2008; Egger, 2001).
A systematic approach ensures that this transparency is combined with discipline, thus minimizing bias. Additionally, meta-analysis can enhance the precision of treatment effects, reduce the probability of false negative results and eventually, speed up the introduction of effective treatments to population. The subgroup analysis, usually performed in meta-analysis, may reveal the patient groups who respond particularly well to the intervention (Egger, 2001).
The meta-analysis including high-quality RCT trials today offers the best available evidence in quantitative research. This meta-analysis includes 21 studies designed as randomized controlled trials which are recognized as a "gold standard" for research, best suited for the experimental interventions including testing of new drugs. RCT design provides a high internal validity of results and is positioned on higher levels of hierarchy of evidence (Ingham-Bromfield, 2016; Saks, 2019).
Generally, studies included in this meta-analysis are of high methodological quality: study participants had similar baseline characteristics and were properly matched, incompletion and withdrawal rates are low, the number of participants who failed to complete the trial was similar in control (IGlar) and experimental (IDeg) groups; all studies include sensitivity analysis. The ITT (intention-to-treat analysis) was performed in studies where higher numbers of drop-out rates were present with the purpose of minimizing an attrition bias (Wysham,2017; CRD,2009). Most of studies are long-term >12 weeks with extensions and follow-ups; in studies with crossover designs wash-out periods were applied to address a possible carryover effect. Despite the fact, that most of the studies were funded by the manufacturer (Novo Nordisk AS), principal investigators were independent researchers, not employed by this company. This is the first systematic review assessing the parameter- the level of antibodies cross-reacting with human insulin produced after the treatment with IDeg vs IGlar. Also, this meta-analysis includes 21 studies ranging from 2015 to 2020, representing the most novel and comprehensive evidence on the chosen topic. The analysis includes early trials as well as the most up-to-date studies.
This meta-analysis used robust methodology, includes subgroup analyses and tests a publication bias in all variables using the Egger's regression test.
5.2 Limitations
This meta-analysis has several limitations such as a high heterogeneity of the results for the hypoglycaemia and body weight gain parameters as well as low external validity. Likewise many forms of research, results of the meta-analysis lack generalizability and work best in contexts similar to those, where the intervention took place. This limitation can also be referred to randomized controlled trials which usually constitute meta-analysis. As a rule, the trials are conducted in "ideal" environments characterized by intensive training of specialists, homogenous samples, a single problem focus and higher methodological rigor which is usually not possible to replicate in a real-world clinical practice. In typical clinical settings, the lack of training and supervision of therapists is present, and patients are more diverse, with multiple health problems (Littell, 2008).
Another limitation is time lag bias which appears due to the fact, that trials with positive, statistically significant results are published faster (median time to publication 2-4 years) while studies with negative results wait up to 6 years before the publication; studies with positive results dominates literature. This means that although most of conducted studies will be eventually published, some of them may not appear in the meta-analysis (Egger, 2001). Also, a language bias may be present, as the search was limited to studies published in English (CRD,2009). Also, the meta-regression was not performed in this analysis.
In this meta-analysis out of 21 selected studies, only three were designed as randomized double-blinded trials. The remaining 18 trials followed open-label design and excluded patients with recurrent, severe hypoglycaemia. Absence of masking can lead to participants/observer bias (Saks, 2019). Additionally, in spite of the fact, that all studies set 18+ years of age as inclusion criteria, most samples represent middle-aged participants (45-60 years), patients younger than 45 years and older than 75 years were underrepresented, which reduces generalizability of results to these two age groups.
This meta-analysis includes studies which used different concentrations of insulin glargine, most studies used treatment with IGlar-100U/ml, but some trials utilize IGlar-300U/ml. For example, two trials BRIGHT Trial and Kawaguchi, 2018 revealed that insulin glargine in concentration of 300U/ml showed similar or opposite to insulin degludec results in terms of reduced overall and nocturnal hypoglycaemia.
The similar inferences were made in a prospective cohort study conducted in Serbia by
Velojic-Golubovic et al, (2021), where a novel formulation of high-concentrated insulin glargine 300U/ml showed a significantly slower absorption after a subcutaneous injection in comparison with insulin glargine 100U/ml. The more prolonged absorption resulted in a more even profile, better glycaemic control and longer duration of action. This cohort included a total of 350 patients with Diabetes Type 2 which were recruited by local physicians from general hospitals and regional medical centers.
Another retrospective cohort study conducted in Japan compared IGlar-100U/ml, IGlar-300U/ml and IDeg-100U/ml using parameters like weight gain and HbA1c levels. The study included a total of 294 patients with Diabetes Type 2 and 307 patients with Diabetes Type 1; both groups had elevated levels of HbA1c >7.0% prior to study. The results showed that IGlar-300U/ml and IDeg-100U/ml produced a similar reduction of HbA1c levels and weight gain. However, the selection of IDeg was associated with the reduced total insulin dosage i.e. IDeg can reach the same targets at lower total daily dosage in comparison to iGlar (Oya, 2021).
5.3 The reasons for high heterogeneity in the overall, nocturnal episodes of hypoglycaemia and body weight gain parameters
The analysis for the episodes of overall and nocturnal hypoglycaemia were based on a large number of studies 21 and 18, respectively. The included studies consist of various participants of different age group, weight, baseline HbA1c, ethnicity. Studies contain multi-national samples and some of them included participants with comorbidities (cardiovascular or kidney diseases) which can affect results. Also, definitions of hypoglycaemia differ across studies (some studies define confirmed hypoglycaemia with blood glucose level of 3,1 mmol/l and others 3,9 mmol/l). Additionally, some studies measure blood glucose levels in mmol/l and others in mg/dl (Zhou, 2019; Zhang, 2018).
5.4 Publication bias
The publication bias was not revealed by this meta-analysis, however, the analysis of body weight gain variable included 9 studies, which is lower than recommended 10 studies for the Egger's test. The Egger's test requires at least 10 studies to produce valid and precise results, so the precision of the test decreases with a smaller number of studies (Sterne, 2011). According to the Egger's test, true asymmetry and the presence of publication bias is confirmed if p -value equates or is less than 0,05 (Bruce, 2017). Publication bias is particularly problematic in RCT studies and can negatively affect the overall treatment effect because small studies with negative results are underrepresented in the meta-analysis (Laake, 2015). However, a funnel plot asymmetry can be the result of between-studies heterogeneity and inclusion of studies with statistically insignificant results (Egger, 1997).
5.5 Application of this Study
The results of this study can be transferred into clinical practice, and inferences of this study can be applied to T1D and T2D patients to optimize a diabetes treatment and glycaemic control of this groups. The prescription of IDeg is particularly relevant in the treatment of T1D and T2D insulin naïve patients starting insulin therapy in primary care. As it comes to weight gain parameter, additional research is needed with a full access to patient's data, as the inclusion of more studies can reveal a wider difference between IDeg and IGlar. In this case, IDeg can be used as a better option for the treatment of overweight and obese patients with Diabetes Type 2.
With regards to hypoglycaemia, IDeg can be safely used as an alternative to other basal insulins of first and second generation as the most pronounced superiority was revealed in the reduction of nocturnal and overall hypoglycaemia in all subgroups. This is especially recommended to patients with T1D and T2D on basal-bolus regimes with frequent nocturnal and overall hypoglycaemia.
This analysis indicated that T1D patients and T2D patients using basal-bolus regime experienced higher number of hypoglycaemic events. The samples which used only basal insulin or naïve patients have fewer events due to the absence of bolus insulin's effect (insulin Aspart was used in basal-bolus regimes in all trials). In case of T1D patients, the use of both insulins increases the risk of hypoglycaemia. Therefore, as analysis confirmed that T1D group benefits the most from IDeg therapy in terms of risk of developing hypoglycaemia, this basal insulin can be used in the treatment of newly diagnosed T1D patients as well as those with long history of diabetes.
However, approach should be individual, as the conditions of randomized controlled trial design may differ from a real clinical practice where the number of hypoglycaemic episodes is usually higher (Russel-Jones, 2015). Also, according to Russel-Jones, (2015) real practice includes patients with BMI higher than 30 years old, and patients with severe and recurrent hypoglycaemia – groups which were not included in the experiment. So, the results should be generalized with cautions.
5.6 Recommendations for Future Research
This analysis and review of the newest literature revealed that studies which used IGlar 300U/ml showed similar to IDeg100U/ml results, and for this reason it can be assumed that IGlar -300U/ml may have a more stable and flat activity profile than IGlar-100U/ml, and further investigation is needed to implement a direct comparison between IGlar-300U/ml and IDeg-100U/ml. Concerning body weight gain parameter, the publication bias cannot be fully excluded, so additional research is needed with a full access to patients' dataset, as most studies did not include standard deviations. Additionally, the future reviews could implement analysis including studies with samples using isolated basal regimes + oral hypoglycaemic drugs and basal-bolus regimes, so that the hypoglycaemic effect of bolus insulin would not interfere during the testing of basal insulins (Kumar, 2017). This is particularly relevant in insulin naïve patients with T2D.
Also, mean age of all samples ranged between 40-60 years with a few 65+ participants and future research could expand age limits and recruit more elderly people 65+. Another point to consider in the future investigation is the inclusion of people with diabetes complications, obesity (BMI more than 30) and severe hypoglycaemia.
5.6 Conclusion
In conclusion, this systematic review and meta-analysis demonstrates that insulin degludec is superior to insulin glargine in terms of four safety and efficacy variables such as change in fasting plasma glucose, body weight gain, nocturnal and overall hypoglycaemia. IDeg vs IGlar produce similar changes in HbA1c levels and the level of antibodies cross-reacting with human insulin. The most pronounced difference was detected in the number of nocturnal and overall hypoglycaemia, which confirms the fact that IDeg exhibits less glycaemic variability and ensures a more flat activity profile. Moreover, the reduced number of hypoglycaemia is accompanied with the reduction of FPG levels. Insulin treatment that achieves near normoglycemia without increasing the risk of hypoglycemia provides an opportunity of reaching glycaemic control which is close to physiological human insulin production (Gelhorn, 2020). This characteristic would be beneficial to T1D as well as T2D naïve and experienced patients because IDeg possesses the ability to ensure a similar to IGlar level of HbA1c along with lower rates of hypoglycaemia, better FPG levels and less weight gain. The additional benefit of better glycaemic control is the reduction in emotional and physiological distress (Gelhorn, 2020).
The findings of this meta-analysis on overall and nocturnal hypoglycaemia, FPG and HbA1c are similar to most existed reviews conducted from 2015 to 2019: Liu,(2018); Zhou,(2019), Ratner, 2015; Heller, (2016); Russel-Jones, (2015). The results on weight gain parameters are similar to Zhang,(2018) and opposite to Madenidou, (2018) and Zhou,(2019). This analysis adds value and evidence to the existed reviews on the topic.
The general inference based on the current analysis is that the basal insulin analogue degludec in comparison with glargine provides a better option for patients with Diabetes Type 1 and Diabetes Type 2. This study adds evidence for health practitioners and managers considering administration of a basal insulin to patients with T1D and T2D in favour of IDeg. As the cost of
IDeg on the market is higher that IGlar's the robust evidence is needed to justify the administration of IDeg for a wider use (Karla, 2013).
1.1 Description of the research topic
Diabetes was known from ancient times (was first recognized around 1500 B.C.E. by Egyptians), the term was first used by the Greek physician Aretaeus (80 to 130 C.E.). Until 1921, when Frederic Banting and Charles Best discovered insulin, diabetes was a uniformly fatal disease.
The discovery of insulin which was initially extracted from animals endowed people with a chance to survive for the long periods of time. The insulin production since has made substantial improvements switching from animal insulins with lower efficacy and higher immune reactions to the refined human analogues, closest by its chemical structure to the endogenous insulin (Polonsky, 2012).
The global prevalence of Diabetes Mellitus is estimated at 8,5% in 2014. Today, the new cases of diabetes show an upward trend globally. Moreover, the diabetes global increasing trend can be observed through decades: from 108 million in 1908 to 422 million in 2014 (WHO, 2020).
Diabetes today has become the ninth leading cause of death: from 2000 to 2019 deaths from diabetes increased by 70% worldwide; in 2019, diabetes was a direct cause of 1,5 million deaths. Moreover, diabetes has become a leading cause of disability which results in a substantial financial burden imposed on health systems globally (WHO,2020). For example, UK only spends 8,8 billion pounds annually in a direct cost, and about 13 billion in indirect costs on complicated Diabetes Type 2 (NHS,2019). Diabetes is a primary cause of blindness, myocardial infarction, stroke, kidney failure and feet amputations.
However, these complications develop in case of poor glycaemic control and persisted chronic hyperglycaemia and can be successfully prevented through a regular self-control of blood glucose, appropriate medication, diet and physical activity (Syaifuddin, 2013; CINAHL, 2016; Chan, 2016; WHO, 2020). Therefore, the efforts to find a better treatment option for patients with diabetes should be intensified.
The two most prevalent types of diabetes requiring administration of insulin therapy are Diabetes Type 1 and Type 2. Diabetes Type 1(juvenile onset) is characterized by absolute deficiency of endogenous insulin production and insulin administration in this case is a life-saving treatment. In 2017, the estimated number of those with T1D diagnosis was nine million people. Today, the cause and measures to prevent T1D are unknown. Diabetes Type 2(adult-onset) accounts for about 95% of all diabetes cases and is mostly caused by excess body weight; T2D unlike T1D, is defined by ineffective use of endogenous insulin (WHO, 2020).
Today, about 50% of patients with Diabetes Type 2 use basal insulins as an additional treatment to oral antidiabetic drugs or basal + bolus regimes alone (Zinman et al,2012). Insulins are divided into short acting (before meal) and long-acting analogues. Long acting or basal insulins ensures a non-stop mild hypoglycaemic effect which altogether with bolus insulins allow to reach an optimal, target blood glucose levels and HbA1c <7%. However, along with multiple benefits insulin therapy has a dangerous side-effect - hypoglycaemia. Hypoglycaemia, especially severe ones can cause loss of consciousness, seizures, coma, an acute coronary syndrome, a hip fracture (Febo,2011). The generation of a basal insulin ensuring a stable hypoglycaemic effect with a minimal risk of hypoglycaemia, especially severe and nocturnal ones, is considered as a priority in the treatment of insulin-dependent patients with diabetes today (Karla, 2013).
The main purpose of this dissertation is to compare six safety and efficacy parameters of the two best available and frequently prescribed basal insulins (glargine and degludec) in order to identify the one that produces better results in terms of safety and glycaemic control in adult patients with Diabetes Type 1 and Type 2.
1.2 Background context
The dissertation considers a meta-analysis as the most appropriate strategy for the investigation of the pooled results for six variables of interest obtained from the existed high-quality trials. Insulin glargine and degludec represent the second-generation basal insulins invented to fill in a clinical need for the insulin which matches the normal pattern of insulin secretion as closely as possible (Pettus et al, 2015; Standi, 2016).
Insulin degludec (U-100) is the newest basal insulin analogue of Novo Nordisk company, approved in 2012, while insulin glargine(U-100) is a product of Sanofi Aventis company with a longer history of clinical use (was approved by Food and Drug Administration USA in 2000) (Dedov,2015; Pettus et al, 2015). Glargine (IGlar) along with Detemir were invented as an improvement of NPH insulin, both demonstrating the lower risk of hypoglycaemia translated into the reduced rate of hospitalization for severe hypoglycemia and secondary healthcare visits in real-world patients - 9.9% lower (p = 0,022) for glargine U100 compared with NPH (Woo, 2021). However, the on-going need for the flat-profile insulin capable of reaching optimal fasting plasma glucose targets without increasing risk of nocturnal hypoglycaemia remained, and degludec (IDeg) was consequently produced to address this need (Lajara et al, 2017).
1.3 Research rationale
With regards to the weight gain parameter, Lingav, (2016) reported that treatment with IDeg was associated with less weight gain, while Madenidou,(2018) provides the opposite results – IGlar and Detemir are associated with weight loss, not IDeg. The results of Zhou et al,(2019) and Liu et al,(2018) demonstrate statistically insignificant difference and similar changes in body weight gain.
Similarly, the results for the overall episodes of hypoglycaemia varies across reviews and studies providing some level of inconsistency: studies of Sullivan et al(2018) and Laviola(2021) reported that a risk reduction is associated with IGlar, not IDeg. In contrast, reviews of Ratner et al (2015), Heller (2015), Liu et al(2018), Madenidou (2018), Zhang(2018) revealed the opposite results: IDeg is associated with fewer hypoglycaemia (overall, severe, nocturnal) in T2D and T1D patients; the results of Russell-Jones (2015) showed no statistically significant difference in overall episodes of hypoglycaemia IDeg/IGlar.
1.4 Research question
What is the difference in terms of efficacy and safety parameters between Insulin Degludec and Insulin Glargine, in the treatment of adult (18+) patients with Diabetes Type 1 and Type 2?
To investigate the efficacy and safety parameters of Insulin Degludec(IDeg) compared to Insulin Glargine(IGlar) in the treatment of adult (18+) patients with +*9999Type 1 and Type 2.
{"image_source":{"path":"images/33d9db6449deca7cd8cd57b388609004f0ac3f363a232760e1a884932b60b122.jpg"},"content":"","chart_caption":[{"type":"text","content":"Figure 1: Glycaemic Profiles of NPL (First Vertical Row) Glargine(second Vertical Row) and Degludec (Third Vertical Row) Adjusted From Woo (2020)"}],"chart_footnote":[]} {"image_source":{"path":"images/1904623a3475b9cf59da5e6b45f65b797e31a014986fba3953dedc8efb4485a1.jpg"},"content":"","chart_caption":[{"type":"text","content":"Figure 3: Forest Plot for Change in HbA1c Levez"},{"type":"text","content":"Figure 4: Funnel Plot for HbA1c"}],"chart_footnote":[]}
{"image_source":{"path":"images/e8958b8c29453d2ab1de4fb467c64fa090dedc56509f7fea41e907a16120c370.jpg"},"content":"","chart_caption":[],"chart_footnote":[]} {"image_source":{"path":"images/6314079818e5ec44917ea0ab400b218239327ac376fcd6e7dd3dade31093d04d.jpg"},"content":"","chart_caption":[{"type":"text","content":"Figure 10: Funnel Plot for FPG Performed on JASP"},{"type":"text","content":"Figure 11: Funnel plot for FPG performed on RevMan 5.4"}],"chart_footnote":[]}
{"image_source":{"path":"images/75d89bba186f11c0b6f22b1c61e1b25af50594a95467bd5d84babe7b2a49bf0d.jpg"},"content":"","chart_caption":[],"chart_footnote":[]} {"image_source":{"path":"images/2a7b167256444975f14998fe0558ee87be8fcd085497829064bce06d612aba95.jpg"},"content":"","chart_caption":[],"chart_footnote":[]}
{"image_source":{"path":"images/a6969fefaf442f6118b896ed469feabc4b0263fff768abe57a46c5c2ecf285ca.jpg"},"content":"","chart_caption":[{"type":"text","content":"Figure 15: Subgroup T1D"}],"chart_footnote":[]} {"image_source":{"path":"images/0753e6300be9dbcfbe96fda79cc822e0dd10e5506a80996fef7f9d5d6c5bb4ff.jpg"},"content":"","chart_caption":[],"chart_footnote":[]}
{"image_source":{"path":"images/86ab60256449bcbfd2919739ca05edf9f1f01938dcbaec889ed9299ed0fb85ba.jpg"},"content":"","chart_caption":[{"type":"text","content":"Figure 18: Funnel Plot for Body Weight Gain Performed on RevMan 5.4"}],"chart_footnote":[]} {"image_source":{"path":"images/d89d959382c230025af1ed3b4e0ba6e946e9769e8dcde75f2203279dc81e993a.jpg"},"content":"","chart_caption":[{"type":"text","content":"Figure 19: Funnel Plot for Body Weight Gain Performed on JASP"}],"chart_footnote":[]}
{"image_source":{"path":"images/6d6eab0203c9b55cb6aacbfe6331717ce2d15e59040b9e4525393fea86785a20.jpg"},"content":"","chart_caption":[{"type":"text","content":"Figure 24: Subgroup Naïve"}],"chart_footnote":[]} {"image_source":{"path":"images/26b50db507a5f548f5944b94d5b94f07dfd746fe7230d12528e606b45444431e.jpg"},"content":"","chart_caption":[{"type":"text","content":"Figure 25; Funnel Plot the OEH Performed on RevMan 5,4"},{"type":"text","content":"Figure 26: Funnel Plot for OEH Performed on JA"}],"chart_footnote":[]}
{"image_source":{"path":"images/9e7ba8705818ba8a9ea625ffe27d2c358b450d1e21f569bdff23c212fb9bc574.jpg"},"content":"","chart_caption":[{"type":"text","content":"Figure 27: Funnel Plot for OEH (studies with insignificant results excluded)"}],"chart_footnote":[]} {"image_source":{"path":"images/9761a0e37501f2f01b5fc17c8d8a3ee202c2f07d8c1d1f30f47b5462620e9f66.jpg"},"content":"","chart_caption":[{"type":"text","content":"Figure 32. Subgroup naïve"}],"chart_footnote":[]}
{"image_source":{"path":"images/c44f0d1fe19a1a410e0bc8f5c1a9fad07fbf91147383a713f7d8c3eb145139f4.jpg"},"content":"","chart_caption":[{"type":"text","content":"Figure 33: Funnel Plot for ENH Performed on RevMan 5.4"},{"type":"text","content":"Figure 34: Funnel Plot for ENH Performed on JASP"}],"chart_footnote":[]} {"image_source":{"path":"images/e79279568210ec3b548a2d0933c6cf8c2e39a846dbd8504d4cf4877471e176eb.jpg"},"content":"","chart_caption":[],"chart_footnote":[]}
{"image_source":{"path":"images/3a445e9245955efbf3688a9a5f661fb6df28d6e86665480fbf875cc8508f6fe3.jpg"},"content":"","chart_caption":[{"type":"text","content":"Figure 35: Forest Plot for End-of_trial Periods IDeg vs IGlar Groups"},{"type":"text","content":"Figure 36: Funnel Plot for Cross-Reacting Antibodies"}],"chart_footnote":[]}
Conflict of Interest
The authors declare no conflict of interest.
Ethical Approval
Not applicable
Data Availability
The datasets used in this study are openly available at [repository link] and the source code is available on GitHub at [GitHub link].
Funding
This work did not receive any external funding.
References
Cite this article
Related Research

Special Issue
Launch a focused special issue to highlight research, emerging trends, and expert insights in your academic field.