




IntelliPaper
Abstract
This is an essay on the consequences of the indiscriminate growth of the central region of Mexico. It is a mixed research, in which the qualitative and quantitative approaches interact with the objectives, on the one hand, to facilitate the understanding of the serious multifaceted situation of the inhabitants and the ecological imbalance of this region, and on the other to propose a drastic paradigm shift in the policy of human settlements and the fight against corruption that is ultimately the root cause of the problem at hand. The procedural part includes statistical data on population, extension, and population density of seven entities in the region: Mexico City, and the States of Mexico, Tlaxcala, Puebla, Querétaro, Hidalgo and Morelos. The propositional part is based on the methodology called "creative imagination" of Giambattista Vico, an Italian philosopher who lived five centuries ago, but whose thought is still valid today. The results of the research were based on the systems approach and the theory of constraints supported respectively by Fritjof Capra and Eliyahu Goldratt.
Explore Digital Article Text
I. INTRODUCTION
This document has been written with unease. Acknowledging the severity of the outsized growth of the country's geographic center and the lack of awareness of it on the part of past and current decision-makers is a powerful motivator to think pessimistically. Pessimism, when it is based on reality, ceases to be pessimism, and becomes realism.
When the leaders of people had a holistic view of the circumstances and acted based on a global long-term vision, great civilizations and powerful empires developed, as happened at some stage of their history with the Romans, Japanese, English, Incas, Mayas, or North Americans among others (Meadwods, at. al 2004).
Unfortunately, all too often this overall vision has been lost in countries such as ours that have not reached the necessary political maturity, and governmental, business, and social decisions have been taken only to achieve narrow purposes or to solve problems limited to local and temporary interests. This absence of a comprehensive long-term vision, together with other aspects in which corruption stands out, has been the cause of many socio-economic situations that are very difficult to resolve.
II. THE CASE OF THE CENTRAL REGIÓN OF MEXICO
The centrality of decisions and the narrow vision of development for several centuries have reached the point where there may be no turning back or, at the very least, their amendment will involve a great deal of effort in the long term, and a great deal of economic resources and sacrifice of communities that must be displaced.
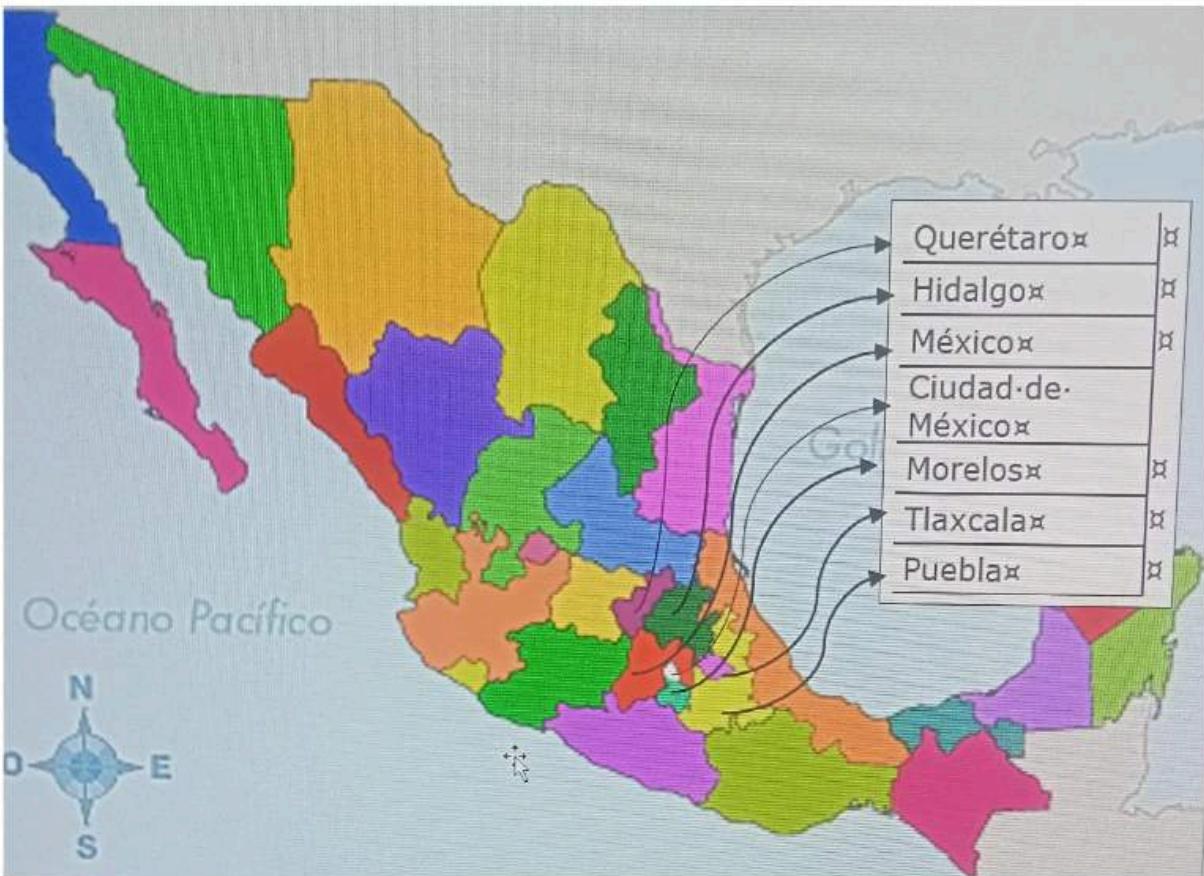
We have narrowed down the geographical area to the entities that have been most affected by the growth. We have used some diagrams and statistical data to facilitate the explanation of the problematic core.
 Figure 1: Geographic location of the region under study in the Mexican Republic Source: Authors' own elaboration of the identification of the entities under study based on a map of the free textbooks
The states under study occupy the northeastern part of Mexico City, with the exception of the state of Morelos, which is located to the south, and the state of Mexico, which largely surrounds it.
Table 1: Population of the period 1970-2020 for each entity in the region under study Source: Authors' own elaboration with data from INEGI (2015) Table 2: Data as of 2025 on population density by entity in the region under study
| State | 1970 | 1980 | 1990 | 2000 | 2010 | 2020 |
| México | 3,833,185 | 7,564,335 | 9,815,795 | 13,096,686 | 15,175,862 | 16,992,418 |
| Ciudad de México | 6,874,165 | 8,831,079 | 8,235,744 | 8,605,239 | 8,851,080 | 9,209,944 |
| Puebla | 250,822 | 3,347,685 | 4,126,101 | 5,076,686 | 5,779,829 | 6,583,278 |
| Hidalgo | 1,193,845 | 1,547,493 | 1,888,366 | 2,235,591 | 2,665,018 | 3,082,841 |
| Querétaro | 485,523 | 739,605 | 1,051,235 | 1,404,306 | 1,827,937 | 2,368,467 |
| Tlaxcala | 420,638 | 556,597 | 761,277 | 962,646 | 1,169,936 | 1,342.977 |
| Morelos | 616,119 | 947,089 | 1,195,059 | 1,555,296 | 1,777,227 | 1,971,520 |
| sumas | 13,674,297 | 23,533,883 | 27,073,577 | 32,936,450 | 37,246,889 | 41,551,445 |
Source: Authors' own elaboration of the calculation of the projection with data from INEGI (2020)
| Code | Federal entity | Area Km2 | Total population (2010) | Density as of 2010 | Population as of 2020 | Density to 2020 | Projection to 2025 | Density to 2025 |
| 13 | Hidalgo | 20,856 | 2,665,018 | 128 | 3,082,841 | 148 | 3,236,983 | 155 |
| 15 | México | 22,333 | 15,175,862 | 680 | 16,992,418 | 761 | 17,842,039 | 799 |
| 9 | Ciudad de México | 1,484 | 8,851,080 | 5,964 | 9,209,944 | 6,206 | 9,670,441 | 6,516 |
| 17 | Morelos | 4,892 | 1,777,227 | 363 | 1,971,520 | 403 | 2,070,096 | 423 |
| 29 | Tlaxcala | 3,997 | 1,169,936 | 293 | 1,342,977 | 336 | 1,410,126 | 353 |
| 22 | Querétaro | 11,658 | 1,827,937 | 157 | 2,368,467 | 203 | 2,486,890 | 213 |
| 21 | Puebla | 34,251 | 5,779,829 | 169 | 6,583,278 | 192 | 6,912,442 | 202 |
| Total | 99,471 | 37,246,889 | 374 | 41,551,445 | 418 | 43,629,017 | 439 |
By 2025 there would be around 44 million inhabitants in the region under study. If the number of square kilometers occupied by the 7 states is a little less than 100,000, that means that about one-third of the total population lives in one-twentieth of the territory. If there are no significant changes in population growth, development policies and deconcentration plans, by the middle of this decade (2020) we would be around 44 million inhabitants in the region.
Below is an optimistic, conservative and pessimistic extrapolation of the population situation for 2025:
Table 3: Population forecast to 2025 of the región under study Source: Authors' own elaboration based on INEGI data as of 2020
| State | Population as of 2020 | Population as of 2025 | ||
| Pessimisti forecast | Conservative forecast | Optimisticforecast | ||
| Hidalgo | 3,082,841 | 3,391,125 | 3,236,983 | 3,144,498 |
| México | 16,992,418 | 18,691,660 | 17,842,039 | 17,332,266 |
| Ciudad de México | 9,209,944 | 10,130,938 | 9,670,441 | 9,394,143 |
| Morelos | 1,971,520 | 2,168,672 | 2,070,096 | 2,010,950 |
| Tlaxcala | 1,342,977 | 1,477,275 | 1,410,126 | 1,369,837 |
| Querétaro | 2,368,467 | 2,605,314 | 2,486,890 | 2,415,836 |
| Puebla | 6,583,278 | 7,241,606 | 6,912,442 | 6,714,944 |
| 41,551,445 | 45,706,590 | 43,629,017 | 42,382,474 | |
Table 4: Projection of population density by metropolitan area to 2025
| Metropolitanarea | Km.cuadrados | 1990 | 1995 | 2000 | 2005 | 2010 | 2015 | 2020 | 2025 | densitybyr $Km^2/ZM$ (2020) | DensitybyK $m^2/ZM$ (2025) |
| ZM de Pachuca | 1,196.50 | 276,512 | 330,838 | 375,022 | 438,692 | 512,196 | 560,419 | 618,341 | 649,258 | 517 | 543 |
| ZM de Toluca | 2,203.20 | 1,061,065 | 1,272,301 | 1,471,146 | 1,633,052 | 1,936,126 | 2,106,473 | 2,317,052 | 2,432,905 | 1,052 | 1,104 |
| ZM de Puebla-Tl axcala | 2,392.40 | 1,735,657 | 2,016,775 | 2,220,533 | 2,470,206 | 2,728,790 | 2,958,485 | 3,199,850 | 3,359,843 | 1,338 | 1,404 |
| ZM del Valle de México | 7,866.10 | 15,563,795 | 17,297,539 | 18,396,677 | 19,239,910 | 20,116,842 | 21,403,089 | 22,496,468 | 23,621,291 | 2,860 | 3,003 |
| ZM de Querétaro | 2,053.40 | 579,597 | 706,566 | 816,481 | 950,828 | 1,097,025 | 1,198,304 | 1,321,039 | 1,387,091 | 643 | 676 |
| ZM de Cuernavaca | 1,189.90 | 549,998 | 685,896 | 753,510 | 802,371 | 924,964 | 992,520 | 1,075,577 | 1,129,356 | 904 | 949 |
| Sumas | 16,901.50 | 19,766,624 | 22,309,915 | 24,033,369 | 25,535,059 | 27,315,943 | 29,219,289 | 31,028,325 | 32,579,743 | 1,836 | 1,928 |
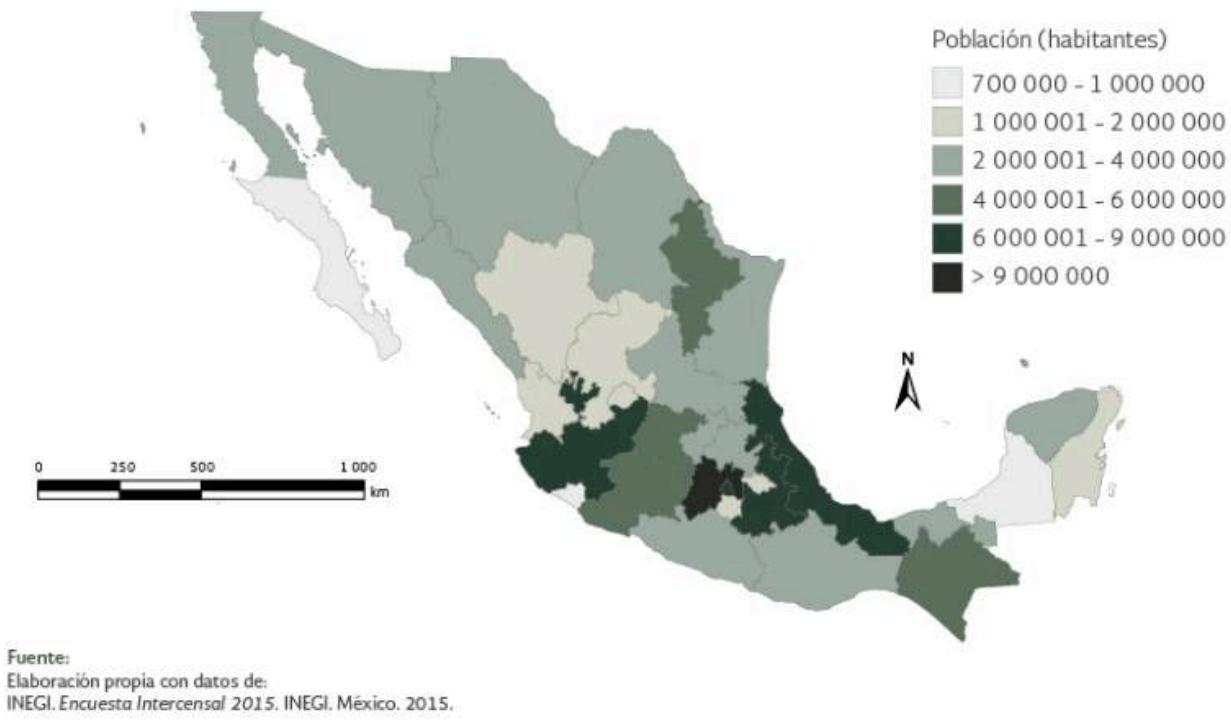 Mapa 1.1 | Población total por entidad federativa, 2015 Fuente: Elaboración propia con datos de: INEGI. Encuesta Intercensal 2015. INEGI. México.
2015. Source: INEGI. Intercensal Survey 2015)
Figure 2: Total population by state
It is important to note, the number of inhabitants of the 6 metropolitan areas in 2020 was 31 million in an area of 17 thousand square kilometers (in round figures). This means that less than one percent (0.0085) of the national territory was inhabited by 25 percent of the country's total population. This is an incredible figure for any citizen of a country that understands that growth is not synonymous with development. The situation will not improve by 2025.
In an exercise of authenticity unrelated to political or economic interests, this region cannot be considered, as has been the case until recently, as one of the most prosperous regions in the country. Paradoxical conception according to the reference factors.
If we consider economic factors, job options, social movement, housing development, commercial alternatives, opportunities for entrepreneurs, formal education, various services and other similar factors, it is reasonable to think that growth is positive and that should continue on the same path.
However, when other aspects are considered, what is reasonable becomes irrational: intolerance, violent traffic, very high pollution, alienation, serious disorders of character, epidemic diseases, cancer, hypertension and nervous diseases, family dysfunction, criminality, impiety, loneliness among the masses, official injustice, lack of time for coexistence, crowds, femicides, abuses of authority, corrupt authorities and impunity circumvented by the crowds.
Capra (1992)takes a similarview:
Our political leaders remain confined to the narrower thought structure of the old paradigm and think that the solution to particular cases adds up to an integrated whole and remain the fragmented approach that has become so characteristic of our political parties and government departments. But such an approach will never be able to solve any of the problems, but merely erratically shifts them, so that one year the number one problem is inflation; then, unemployment; next, drugs and crime; then some environmental problem and so on. But the real problem, deep down, is not faced; that is, the wrong perception of reality.
A couple of years ago, with the students of the master's degree in administration of the UAEMéx, based on the Systemic Approach (SE) and the Theory of Constraints (TOC), an exercise was carried out on the undesirable effects that they could mention as part of what they have perceived to be happening in their environment. As a result, a list of 100 undesirable effects was obtained, which was complemented by an improvised approach to the amounts of each effect. Of all of them, and as part of the exemplification of the consequences linked to the uncontrolled growth of the geographical area under study, some of them were chosen for brief commentary.
III. ECOLOGICAL IMPOVERISHMENT
A little more than half a century ago, in the basin of the Lerma River, the main aquifer of the region, there were areas and communities rich in plant and animal life on its banks and where people lived by taking advantage of the pastures and fertile lands on the humid banks and the multiple streams that beautified the region.
Suddenly, in a span of less than two decades, the Toluca-Lerma industrial zone developed at a dizzying pace, and the entire ecological system collapsed. The tributaries of the Lerma disappeared and the main river itself in part of its course became a dumping ground for industrial waste. In the government of Jiménez Cantú, a rescue plan was drawn up that was never carried out.
According to chronicles from previous centuries, the Toluca Valley and surrounding areas were rich in wildlife, typical of temperate regions. Deer, lynx, wolves, coyotes, foxes, gophers, badgers, owls, hawks, vultures, snakes, bobcats, carps, trout, and many other less remarkable species roamed the woods, hollows, lakes, rivers, and valleys. Nothing, absolutely none of the above exists today. Ecological awareness never manifested itself throughout the colonial era or in the beginnings of modern Mexico.
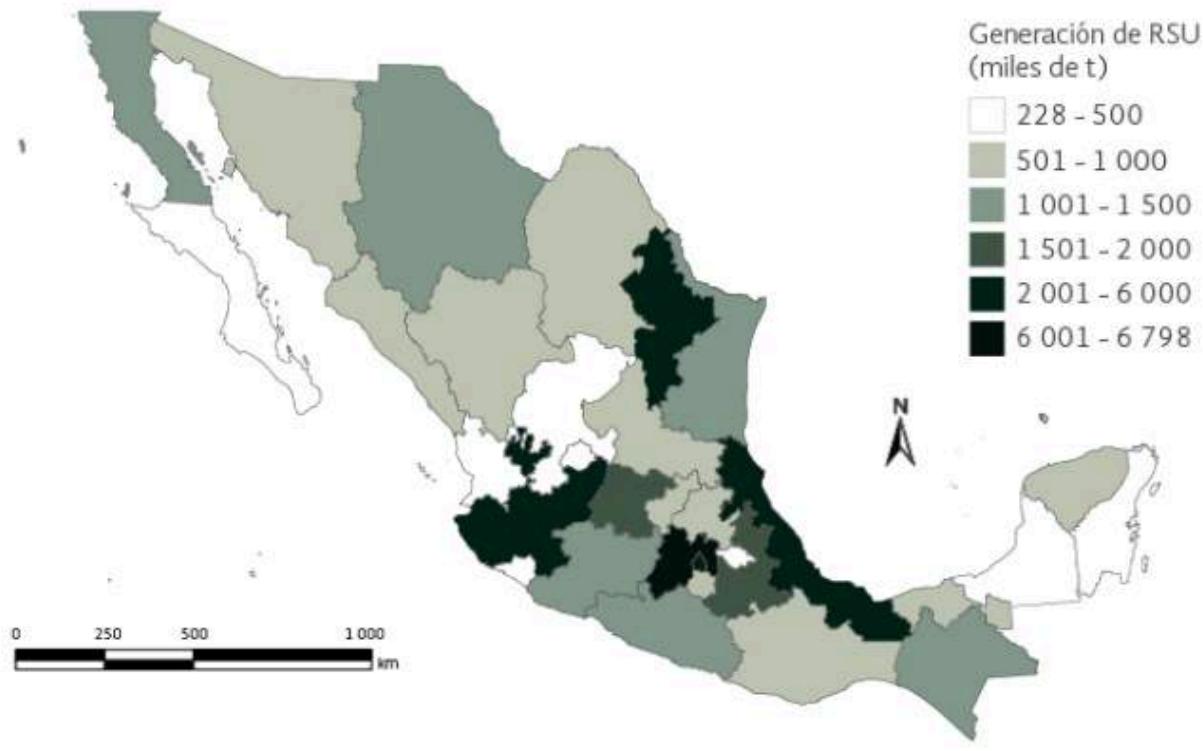 Mapa 7.2 | Generación de RSU por entidad federativa, 2012 Dirección General de Equipamiento e Infraestructura en Zonas Urbano-Marginadas, Sedesol. México.
Source: Directorate-General for Equipment in Marginalized Urban Areas. Sedesol
Figure 3: Solid Waste Generation (MSW)
IV. URBAN FUEL THEFT (MSW) BY STATE
It is no coincidence that sui generis phenomena such as the theft of fuel in the pipelines of the PEMEX company have been carried out in hundreds of clandestine taps located mainly in Hidalgo, Puebla, Tlaxcala and Mexico, states that are part of the area with the highest population density.
This illegal activity has been popularly referred to as "Huachicoleo". Last year, the huachicoleros managed to extract gasoline for an annual amount close to 3 billion euros. The situation is further aggravated by the fact that many of the ringleaders who organized this crime were officials of the same official oil agency. They had hundreds of tankers, disguised fuel depots, and gas stations. It takes the "creative imagination" proposed by Vico for the people of civilized countries to believe in the existence of a system of corruption of such magnitude.
V. COMMON LAW OFFENCES
In the middle of the last century, the civil life of the ordinary citizen went on without serious worries. He could have fun, go for walks, go to the countryside with his family, travel by bus, wander the streets, let his children go to school alone, do sports and athletic activities in parks and avenues. All this in this region of the country has almost entirely disappeared. Insecurity has settled in many cities and roads and people live in fear and many precautions. Almost no one dares to go out with their family after dusk and those who go to an amusement center at night know that the level of risk is high, and they must take extraordinary precautions. The new colonies are fenced and have guard booths that corroborate the identity of the neighbors.
There is no confidence in official figures related to crime. In a personal perception and without statistica foundations, we consider that in the region under study half a century ago there was one criminal for every thousand inhabitants. Now, instead of one criminal for every thousand inhabitants, there is one for every hundred. It is a minority that engages in crime if the total population is considered. Most of our fellow citizens earn an honest living. But if other indicators and empirical references are explored, the result can be frightening. That one percent Common Order Crimes by State means there are more than a million criminals on the streets. There is not an elderly person in the region that you talk to who does not express their experience of having been the object of a crime such as car theft, street robbery, burglary in the home or the kidnapping of a family member.
A separate case, due to the affliction and traumas it generates, is the crime of kidnapping. The state of Mexico has the highest figures in this area (with the exception of the state of Veracruz). The municipalities with the highest incidence of kidnappings in 2017 were the following: 32 in Ecatepec, 23 in Nezahualcóyotl, 22 in Toluca, 14 in Naucalpan de Juárez and 15 in Tecámac. (Rodríguez, 2017).
Table 5: Common law offences by State Fountain; INEGI 2022
| Federal state | 2011 | 2012 | 2013 | 2014 | 2015 | 2016 | 2017 | 2018 | 2019 | 2020 | 2021 | $2022^p$ |
| Aguascalientes | 82 | 45 | 45 | 46 | 45 | 46 | 84 | 82 | 120 | 93 | 103 | 87 |
| Baja California | 809 | 581 | 767 | 717 | 854 | 1 152 | 2 169 | 2 912 | 2 823 | 2 967 | 3 248 | 2 681 |
| Baja California Sur | 42 | 37 | 47 | 92 | 180 | 238 | 751 | 200 | 104 | 78 | 77 | 89 |
| Campeche | 47 | 80 | 71 | 78 | 67 | 93 | 78 | 79 | 83 | 76 | 107 | 110 |
| Coahuila de Zaragoza | 730 | 1 160 | 800 | 469 | 313 | 257 | 275 | 244 | 306 | 242 | 171 | 169 |
| Colima | 163 | 265 | 225 | 140 | 227 | 613 | 867 | 747 | 830 | 694 | 607 | 867 |
| Chiapas | 186 | 390 | 492 | 460 | 539 | 552 | 591 | 662 | 619 | 536 | 568 | 499 |
| Chihuahua | 4 500 | 2 772 | 2 133 | 1 755 | 1 540 | 1 788 | 2 248 | 2 978 | 2 936 | 3 468 | 2 739 | 2 016 |
| Ciudad de México | 1 101 | 1 086 | 1 111 | 1 099 | 1 080 | 1 279 | 1 320 | 1 469 | 1 301 | 1 340 | 1 076 | 742 |
| Durango | 1 063 | 822 | 473 | 348 | 198 | 214 | 200 | 178 | 175 | 168 | 143 | 125 |
| Guanajuato | 615 | 684 | 702 | 800 | 970 | 1 232 | 2 285 | 3 517 | 4 019 | 5 370 | 4 333 | 4 256 |
| Guerrero | 2 416 | 2 646 | 2 283 | 1 729 | 2 424 | 2 594 | 2 637 | 2 367 | 1 937 | 1 507 | 1 468 | 1 378 |
| Hidalgo | 211 | 162 | 167 | 210 | 233 | 219 | 314 | 340 | 479 | 366 | 287 | 380 |
| Jalisco | 1 529 | 1 560 | 1 491 | 1 038 | 1 230 | 1 300 | 1 586 | 2 928 | 2 525 | 2 241 | 2 274 | 1 845 |
| México | 2 623 | 2 907 | 3 311 | 2 908 | 2 693 | 2 768 | 3 076 | 3 170 | 3 242 | 3 089 | 3 119 | 3 226 |
| Michoacán de Ocampo | 855 | 827 | 922 | 932 | 874 | 1 428 | 1 732 | 2 076 | 2 462 | 2 400 | 2 696 | 2 292 |
| Morelos | 456 | 671 | 629 | 438 | 469 | 659 | 654 | 823 | 1 059 | 988 | 1 199 | 1 149 |
| Nayarit | 587 | 285 | 224 | 174 | 144 | 149 | 474 | 397 | 218 | 185 | 222 | 186 |
| Nuevo León | 2 174 | 1 832 | 926 | 574 | 473 | 627 | 664 | 850 | 987 | 919 | 1 070 | 1 391 |
| Oaxaca | 682 | 695 | 762 | 745 | 808 | 796 | 1 018 | 1 128 | 1 164 | 875 | 786 | 740 |
| Puebla | 437 | 465 | 557 | 568 | 632 | 735 | 1 083 | 1 249 | 1 274 | 1 031 | 847 | 1 061 |
| Querétaro | 109 | 112 | 119 | 106 | 140 | 137 | 218 | 229 | 224 | 227 | 231 | 187 |
| Quintana Roo | 163 | 154 | 164 | 125 | 145 | 193 | 455 | 841 | 750 | 628 | 677 | 635 |
| San Luis Potosí | 364 | 454 | 302 | 269 | 266 | 332 | 507 | 563 | 522 | 803 | 797 | 751 |
| Sinaloa | 1 990 | 1 395 | 1 220 | 1 156 | 1 098 | 1 303 | 1 640 | 1 214 | 1 133 | 866 | 635 | 558 |
| Sonora | 542 | 525 | 658 | 669 | 585 | 580 | 761 | 936 | 1 384 | 1 582 | 2 089 | 1 723 |
| Tabasco | 230 | 195 | 246 | 235 | 372 | 431 | 450 | 569 | 691 | 585 | 453 | 334 |
| Tamaulipas | 1 077 | 1 561 | 880 | 913 | 682 | 807 | 1 204 | 1 437 | 883 | 800 | 739 | 467 |
| Tlaxcala | 87 | 75 | 91 | 88 | 80 | 96 | 126 | 152 | 189 | 154 | 160 | 152 |
| Veracruz de Ignacio de la Llave | 1 000 | 1 019 | 765 | 883 | 1 006 | 1 293 | 1 851 | 1 516 | 1 493 | 1 179 | 948 | 641 |
| Yucatán | 53 | 41 | 49 | 47 | 58 | 64 | 52 | 59 | 46 | 72 | 55 | 54 |
| Zacatecas | 290 | 464 | 431 | 199 | 337 | 584 | 709 | 773 | 683 | 1 244 | 1 776 | 1 432 |
| Common Order Crimes by State | 27 213 | 25 967 | 23 063 | 20 010 | 20 762 | 24 559 | 32 079 | 36 685 | 36 661 | 36 773 | 35 700 | 32 223 |
VI. VEHICULAR TRAFFIC
The vehicle fleet of the Mexico City Metropolitan Area (ZMCM) more than doubled in a decade: it grew 159% and added more than 9.5 million motorized units in circulation in 2015 (the latest data updated by official sources), from the 3.7 million registered in 2005. This has aggravated the crisis of road traffic and polluting emissions in the megalopolis.
The dizzying growth is equivalent to more than three times the increase observed in the previous ten years (1995-2005), which was 45%, and meant that 587,000 vehicles were added to the circulation of the streets and avenues of Mexico City and the 18 conurbated municipalities of the State of Mexico that make up the megalopolis each year or 1,596 units per day or 57 per hour, depending on the unit of time taken as a reference.
Vehicular expansion has also been faster than that of the country as a whole, which was 81.6% in the period from 2005 to 2015, which caused a significant increase in the density of cars in the area, which went from concentrating 16% of the national car fleet in 2005, to 23.6% in 2015. according to figures from the National Institute of Statistics and Geography (INEGI).
Beyond the official statistics, the experience is exhausting and the mood becomes traumatic for those who need to travel in this area. Personally, the signatories of this document have recorded lines of more than five kilometers on the Mexico-Toluca highway and if it is rainy season there are frequent traffic jams in the low-lying areas where torrents accumulate. There are companies and institutions that have had to make working hours more flexible as the density of vehicles prevents the punctual arrival of personnel.
{"image_source":{"path":"images/07d58b430e8e7f5db971c725d4a8e79cd8d2237029d443c2f1a4bbc1524d2686.jpg"},"content":"","chart_caption":[{"type":"text","content":"Source: INEGI RAIAVL, January 2024. It includes the sale to the public of vehicles manufactured in Mexico plus those imported"}],"chart_footnote":[]}
Figure 4: Total retail sale of light vehicles (number of vehicles)
At the beginning of the work and as an epigraph a verse by Paul Geraldy was noted: "Habit becomes necessity". With it, we imply that people get used to everyday difficulties and may even miss them: crowds; the anonymity that crowds provide; driving in congested traffic; the "pride" of living in one of the most densely populated areas on the planet, as if it were a feat to which they have collaborated; the high probability of going unnoticed when you throw a "love slip" ("little song in the air"), etc. But if the quality of life is related to freedom, health, equality and coexistence with justice, a population density of such magnitude cannot be justified. A phenomenon that deserves specialized research is the conformity of many people who adapt to crowds. (Manzano, 2006).
But the most important thing is the long-term projection and the negative consequences that are already being experienced. Kidnappings, assaults, accidents, illnesses and mental disorders are everyday occurrences. It won't be long before this is not the most serious thing, but circumstances that affect the population globally, such as water scarcity, air pollution that produces mass deaths, as happened in London in 1952 (Bates, 2002), the degradation of public education and other services such as garbage collection, adulterated, contaminated and scarce food, etc.
According to Meawdows (2004), countries such as Mexico must examine the five basic factors that ultimately determine their role in the alarming exploitation of this planet: population, agricultural production, the depletion of non-renewable resources, industrial production, and the generation of pollution.
VII. PROPOSAL
The day when it is possible to build on love has not yet come.
This sentence sounds cheesy, excessively romantic, as a dream against violence, consumption, and economic push...
but it is the only way to justice, freedom and coexistence among all.
Although the two paradigms mentioned above have been very useful for the approach of the study, they are also appropriate tools for the elaboration of proposed solutions.
The Systemic Approach is a theoretical framework that underpins the interrelation of the objects that make up a project, whether they are people, programs, resources, policies or environmental conditions. The systemic approach must not only take a holistic view in order to preserve what exists but, as far as possible, to recover what no longer has its rightful place. Ecological preservation and rescue are obligatory references in any human activity. This requires a complete change in the way we live, work and make the most of resources. Something that seems like a utopia in this region, more unachievable than overcoming ethnic discrimination.
On the other hand, the Theory of Constraints (TOC) serves to create reality trees with which a complete vision of all the undesirable effects that an organization, project, community or plan could face (Goldratt, 2012). The reality tree is a schema with undesirable effects linked in cause-and-effect relationships that can be reciprocal, i.e., a cause produces an effect which in turn feeds back into the cause. Causes and effects can be multifaceted, that is, they can be linked to several causes and several effects, forming a kind of network. Once the schematization is completed, the undesirable effect to which most of the other effects point is the one that must be considered as a priority in terms of the efforts and resources to attack it and achieve its disappearance or at least its considerable reduction. When this is done successfully, it often happens that other undesirable effects disappear as a result of the actions taken against the priority effect. The schema is then reconstructed with the remaining undesirable effects and the process is repeated in a similar manner. This way of working really endorses continuous improvement, as it prioritizes the importance of restrictions and allows for an efficient strategy of planning, organization, execution, and control of operations.
In the present case, we would first have to draw up a list of undesirable effects or causes that have led to the unprecedented growth of the region. Among them we can mention the following:
-
Influence peddling to approve new subdivision projects
-
Lack of urban development plans and programmes
-
Ecological ignorance
-
Obsolete or inoperative legislation.
-
Sponsorship between builders and government officials
-
Corruption of the authorities
-
Social pressure for job creation in the construction industry
-
Speculation with the purchase and sale of land
-
Construction companies owned by the same officials
-
Lack of a long-term vision
-
Population pressure
-
And so on, and so on.
If we were to link all the effects together, we would find that most of them point to the corruption of the authorities. So, this would be the restriction whose nullification or significant reduction would allow real progress in halting the region's growth.
VIII. HOW CAN CHANGE BE BROUGHT ABOUT?
When corruption has become ingrained in the culture of many people, it is very difficult to achieve change without leaders changing. Fortunately, and at the time of writing, the authorities have been reiterating that the country's number one need is the eradication of corruption. We believe that his perception is correct. Nothing can be achieved with long-term benefits if corruption is mixed with economic projects and advances and other fundamental areas of national life such as health and education if they are not based on the honorability and honesty of those who make decisions.
If this premise is met, a programme of work based on priorities endorsed by the systems approach and the theory of constraints or other paradigms that provide epistemic, political, cultural and practical foundations for the path to be followed is immediately necessary. Conviction of the need for change is essential to achieve it.
Conflict of Interest
The authors declare no conflict of interest.
Ethical Approval
Not applicable
Data Availability
The datasets used in this study are openly available at [repository link] and the source code is available on GitHub at [GitHub link].
Funding
This work did not receive any external funding.
References
Cite this article
Related Research


Special Issue
Launch a focused special issue to highlight research, emerging trends, and expert insights in your academic field.
