




IntelliPaper
Abstract
The Toxicology Laboratory of the Instituto Nacional de Ciencias Forenses de Guatemala -INACIF- is responsible for analysing the biological signs in the search for chemical substances, among which drugs are found. Because Laboratories constantly need to update their technology, it was necessary to implement a new chemiluminescence immunoassay technique using the Randox Evidence Investigator TM kit. This technique is useful as it provides accurate and reproducible results. To implement this technique, 10 blood samples with a positive result for drugs habitually detected in the Toxicology Laboratory and 10 blood samples with a negative result for drugs were analysed, said analysis gave as a result the fulfilment of what was expected for positive and negative drugs. The time invested in analysis was also evaluated, which was approximately 4 to 4.5 hours.
Explore Digital Article Text
I. INTRODUCTION
The Law Against Narcotic Activities, Decree 48-92, in its Article 2, defines a drug as "any substance or pharmacological agent that, when introduced into the body of a living person, modifies its physiological functions and alters states of consciousness" (Congress of the Republic of Guatemala, 1992, Article 2). This definition is of great interest in Forensic Toxicology, as this field applies the medico-legal aspects of the harmful effects that drugs can have on humans (Bello and López, 2001).
The Toxicology Laboratory of INACIF is responsible for analyzing biological evidence for chemical substances, including volatile substances (ethanol, methanol, isopropanol, and acetone), pesticides, and drugs. The laboratory also performs analyses on biological fluid samples taken from living individuals or cadavers to determine the presence of substances that could cause harm or death.
Among the analyses performed in the Toxicology Laboratory is the drug immunoassay on various types of evidence. The Toxicology Laboratory is equipped with a RANDOX Evidence Investigator , acquired by INACIF in 2020 as a semi-automated option for screening tests in forensic investigations. It is recognized for its versatility, robustness, and effective report generation methods. Additionally, the equipment offers the chemiluminescence immunoassay technique, making its implementation necessary to produce precise and reproducible results that can support the justice system and clarify cases where drug consumption has medico-legal implications (Randox Laboratories Ltd, 2016).
The chemiluminescence immunoassay technique involves qualitatively detecting drugs or their metabolites using competitive chemiluminescent immunoassay. It uses a chemiluminescent substrate with a horseradish peroxidase (HRP) label to detect antibodies or analytes bound to the biochip surface (a solid substrate containing a matrix of discrete test regions with different immobilised antibodies specific to various classes of drugs). Therefore, a reduction in the emitted chemiluminescent signal will be observed (Randox Laboratories Ltd, 2016). As this is a presumptive technique, a positive drug result must be confirmed using instruments such as Gas Chromatography-Mass Spectrometry (GC/MS) or Ultra-High Performance Liquid Chromatography coupled to a QTof Mass Spectrometer (UPLC-QTof).
II. METHODS
The Evidence Investigator Analyzer is a benchtop diagnostic imaging system designed for biochip assays. Chemiluminescence immunoassay is performed manually on a 3 x 3 biochip carrier, which is then introduced into the Randox Evidence Investigator for analysis and image capture. To ensure the quality of the analysis, calibration curves and quality controls are developed. The EvInvest software is integrated into the system, enabling image detection to obtain results ready for printing (Randox Laboratories Ltd, 2016).
The implementation consisted of several stages. The first stage involved conducting ten positive controls, where various drugs commonly identified in the Toxicology Laboratory were evaluated. These drugs included cocaine, marijuana metabolite, benzodiazepines, and barbiturates, which were detected in blood samples and confirmed using GC/MS or UPLC-QTof equipment. The second stage involved evaluating ten negative controls in blood samples that had previously been analyzed using another immunoassay technique and yielded negative results for drugs, to determine the method's selectivity.
The third stage assessed the time required for the analysis, from blood sampling to printing the results report.
2.1 Materials
Blood samples from cadavers, previously analysed and confirmed according to the Toxicology Laboratory's protocol, were obtained from the INACIF Toxicology Laboratory. The reagents, controls, and calibration curves used during the analysis process were supplied by Randox.
2.2 Sample Preparation
Blood samples were diluted by a factor of four with sample diluent (DOA I WB P DIL SPE). Specifically, 50 microliters ( L) of the supernatant from each centrifuged blood sample was added to another set of labelled tubes containing 150 L of sample diluent.
2.3 Analysis Protocol
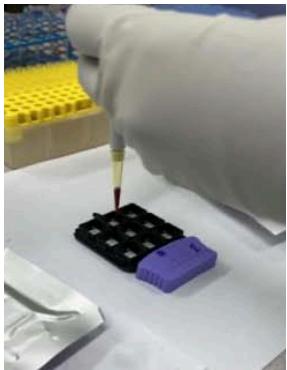
120 L of analysis diluent (DIL ASY) was pipetted per biochip. Subsequently, 60 L of calibrator, control, or diluted sample was added to each biochip, followed by 120 L of conjugate per biochip (image 1). The carrier tray was placed on the base plate of the thermo-shaker. Incubation was performed for 30 minutes at 37°C and 330 rpm (revolutions per minute). After incubation, the biochips' contents were discarded by quickly and precisely tilting the carrier tray.
Biochips were washed with buffer solution by gently tapping all edges of the carrier tray to dislodge reagents trapped beneath the biochip. This was followed by a quick and precise tilting motion to discard the wash. Six additional wash cycles of 2 minutes each were performed, with gentle taps before discarding the wash solution in each cycle.
2.4 Image Detection
The Evlnvest software was initiated, requiring the sequence to be loaded and the corresponding information for each biochip to be entered in the established order. On the dry carrier trays (image 2), 250 L of operational indicator reagent LUM-EV841/PX was added to each biochip. The carrier trays were covered to protect them from light for 2 minutes. Each carrier tray was then individually placed into the Evidence Investigator (image 3), and image detection was performed using the same software.
III. RESULTS
Table 1: Positive Controls in Blood Samples for Drugs Detected by Chemiluminescence Immunoassay.
| No. | Expected Results | Drug Detection Results in Image Analysis (Concentration) |
| 1 | THC-m*/Cocaine | THC-m (+90.38) /BZG (+53.37) |
| 2 | Cocaine y metabolites | BZG+ (>240) |
| 3 | THC-m | THC-m (+19.44) |
| 4 | Cocaine y metabolite | BZG + (>240) |
| 5 | Midazolam (BENZ) | BENZ1 + (>76) Y BENZ2 (+13.04) |
| 6 | THC-m/Clonazepam (BENZ) | THC-m (+65.52) / BENZ3 (+35.36) |
| 7 | Midazolam (BENZ) | BENZ1 (+65.52) |
| 8 | THC-m/Midazolam (BENZ) | THC-m (+43.39) / BENZ3 (+43.26) |
| 9 | Phenobarbital (BARB) / Midazolam (BENZ) | BARB (+63.21) / BENZ1 + (>76) |
| 10 | Phenobarbital/Cocaine | BARB (+63.21) / BZG + (>240) |
Table 2: Negative Controls Evaluated in Blood Samples Analyzed by Chemiluminescence Immunoassay.
| Drug | MX 1 | MX 2 | MX 3 | MX 4 | MX 5 | MX 6 | MX 7 | MX 8 | MX 9 | MX 10 |
| OXYC 1 | -0.24 | -0.3 | -0.08 | -0 | -0.07 | -0.14 | -0.02 | -0.15 | -0.18 | -0 |
| OXYC2 | -0 | -0 | -0 | -0 | -0 | -0 | -0 | -0 | -0 | -0 |
| DMP | -0.05 | -0.01 | -0 | -0 | -0.02 | -0.01 | -0.01 | -0.01 | -0.03 | -0 |
| MPB | -11 | -6.11 | -0 | -0 | -7.94 | -8.57 | -4.09 | -2.42 | -6.94 | -0 |
| MAMP | -0 | -0 | -0 | -0 | -0 | -0 | -0 | -0 | -0 | -0 |
| BARB | -0 | -1.42 | -0 | -0 | -0 | -0 | -0.72 | -0.67 | -1.41 | -0 |
| BENZ1 | -0.05 | -0.02 | -0 | -0 | -0.01 | -0 | -0 | -0 | -0.13 | -0 |
| BENZ2 | -0.29 | -0 | -0 | -0 | -0.01 | -0 | -0 | -0 | -0 | -0 |
| MDONE | -0 | -0.05 | -0 | -0 | -0 | -0 | -0 | -0 | -0 | -0 |
| OPIAT | -0 | -0 | -0 | -0 | -0 | -0 | -0 | -0 | -0 | -0 |
| PCP | -0.01 | -0.02 | -0.43 | -0 | -0 | -0 | -0 | -0 | -0 | -0 |
| BZG | -10 | -2.73 | -0.76 | -1.83 | -0.99 | -0.92 | -4.59 | -0.82 | -0.79 | -0.99 |
| ZOL | -0.18 | -0.02 | -0.01 | -0 | -0.08 | -0.01 | -0.03 | -0 | -0.08 | -0 |
| TCA | -4.01 | -1.12 | -0 | -0 | -4.25 | -0 | -0 | -0 | -4.16 | -0 |
| THC | -7.89 | -1.9 | -11.3 | -0 | -1.44 | -1.78 | -1.39 | -1.61 | -1.89 | -0 |
| TRM | -0 | -0 | -0 | -0 | -0 | -0 | -0 | -0 | -0 | -0 |
| AMPH | -8.25 | -7.48 | -6.06 | -6.68 | -10.3 | -6.68 | -5.98 | -4.53 | -7.18 | -0 |
| FENT | -0.12 | -0.06 | -0.09 | -0 | -0.08 | -0.08 | -0.03 | -0.07 | -0.1 | -0 |
| BUP | -0 | -0.04 | -0 | -0 | -0 | -0 | -0 | -0 | -0.04 | -0 |
| BENZ3 | -0.32 | -0.23 | -0.22 | -0.06 | -0.28 | -0.27 | -0.05 | -0.16 | -0.18 | -0 |
| OPDS | -0.25 | -0 | -0 | -0 | -0.03 | -0 | -0.03 | -0 | -0.04 | -0 |
Table 3: Time Spent During the Chemiluminescence Immunoassay Analysis Process Source: Toxicology Laboratory - INACIF
| Number of Samples Processed | Laboratory Technician Support | Time Range (in hours) |
| 54 samples | Yes | 3.00 to 3.30 |
| 54 samples | No | 4.30 to 4.50 |
Consideration must be given to the preparation of calibration curves, samples, and controls, in addition to incubation in the thermo-shaker. The time taken by the equipment to perform image detection is 2.40 minutes, which is included in Table 3.
IV. DISCUSSION
In the first stage, the most detected drugs in the Toxicology Laboratory were evaluated; positive samples previously confirmed by GC/MS and UPLC-QTof equipment were considered. The detection of the drugs listed in Table 1 is due to the luminescent signal generated in each analysis zone of the biochip, which is performed using digital imaging technology. The method employed allows for the detection of biological samples with a cutoff point of: oxycodone (OXYC) 10 ng/mL, opiates and opioids (OPIAT and OPDS) 10 ng/mL, dextromethorphan (DMP) 5 ng/mL, meprobamate (MPB) 100 ng/mL, amphetamine (AMPH) 20 ng/mL, methamphetamine (MAMP) 20 ng/mL, barbiturates (BARB) 50 ng/mL, benzodiazepines (BENZ 1, 2, and 3) 10 ng/mL, methadone (MDONE) 10 ng/mL, phencyclidine (PCP) 5 ng/mL, cocaine metabolite (BZG) 50 ng/mL, zolpidem (ZOL) 10 ng/mL, tricyclic antidepressants (TCA) 60 ng/mL, cannabinoids (THC marijuana metabolite) 10 ng/mL, tramadol (TRM) 5 ng/mL, fentanyl (FENT) 1 ng/mL, and buprenorphine (BUP) 1 ng/mL. The samples used in Table 1 have a concentration (value in parentheses) that exceeds the drug's cutoff point, thus showing a positive result in image detection, meeting the expected outcome for the analysis.
In the second stage, negative controls were evaluated, and the detected image determined a concentration observed in Table 2. This concentration has a negative value, indicating that it is below the cutoff point, resulting in a negative outcome for the entire list of drugs detected by the technique, thus meeting the expected outcome for this analysis.
In Table 3, the time spent during the analysis was evaluated. It should be noted that with the support of a technician, the time spent decreases by approximately one hour. This reduction is due to the need for organization, input of specific information into the software, and protocol review for the number of samples analysed per carrier tray.
ACKNOWLEDGEMENTS
We extend our gratitude to the staff of the INACIF Toxicology Laboratory for their daily support of the justice system,
FIGURES
 Source: Toxicology Laboratory - INACIF - 2022 Figure 1: Carrier tray in the process of sample placement
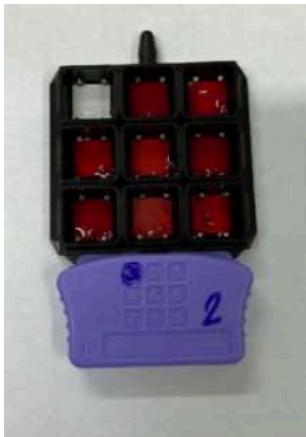
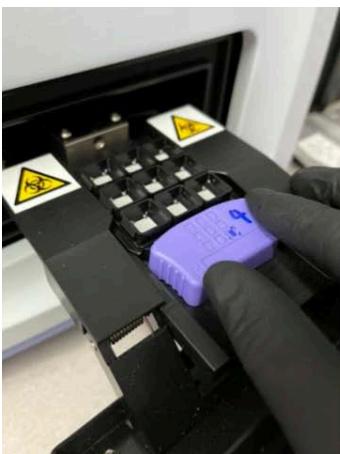 Source: Toxicology Laboratory - INACIF - 2022 Figure 2: Biochip carrier tray with blood sample Source: Toxicology Laboratory - INACIF - 2022 Figure 3: Placement of carrier tray in the equipment
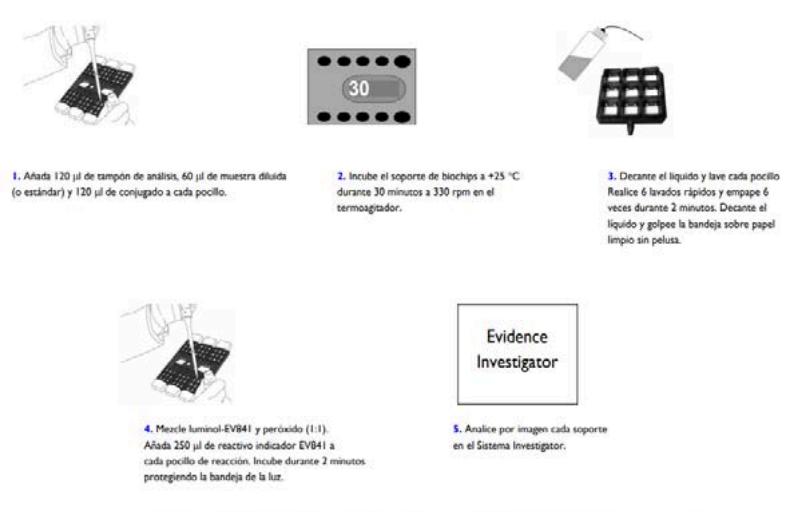
Figure 4: Chemiluminescence immunoassay analysis protocol in blood samples
| Sample Code | DF | BENZ1 | BENZ2 | MDONE | OPIAT | PCP | BZG |
| TESMX01ND | 4 | -0.05(<75) | -0.29(<75) | -(0) | -(0) | -0.01(<20) | -10(<50) |
| TESMX02ND | 4 | -0.02(<75) | -(0) | -0.05(<40) | -(0) | -0.02(<20) | -2.73(<50) |
| TESMX03ND | 4 | -(0) | -(0) | -(0) | -(0) | -0.43(<20) | -0.76(<50) |
| TESMX04ND | 4 | -(0) | -(0) | -(0) | -(0) | -(0) | -1.83(<50) |
| TESMX05ND | 4 | -0.01(<75) | -0.01(<75) | -(0) | -(0) | -(0) | -0.99(<50) |
| TESMX06ND | 4 | -(0) | -(0) | -(0) | -(0) | -(0) | -0.92(<50) |
| TESMX07ND | 4 | -(0) | -(0) | -(0) | -(0) | -(0) | -4.59(<50) |
| TESMX08ND | 4 | -(0) | -(0) | -(0) | -(0) | -(0) | -0.82(<50) |
| TESMX09ND | 4 | -0.13(<75) | -(0) | -(0) | -(0) | -(0) | -0.79(<50) |
| TESKT121120 | 4 | -1.21(<10) | -0.01(<10) | -0.34(<5) | -39.62(<100) | -1.08(<20) | -18.4(<50) |
| Sample Code | DF | BENZ1 | BENZ2 | MDONE | OPIAT | PCP | BZG |
| TESMX01ND | 4 | -0.05(<75) | -0.29(<75) | -(0) | -(0) | -0.01(<20) | -10(<50) |
| TESMX02ND | 4 | -0.02(<75) | -(0) | -0.05(<40) | -(0) | -0.02(<20) | -2.73(<50) |
| TESMX03ND | 4 | -(0) | -(0) | -(0) | -(0) | -0.43(<20) | -0.76(<50) |
| TESMX04ND | 4 | -(0) | -(0) | -(0) | -(0) | -(0) | -1.83(<50) |
| TESMX05ND | 4 | -0.01(<75) | -0.01(<75) | -(0) | -(0) | -(0) | -0.99(<50) |
| TESMX06ND | 4 | -(0) | -(0) | -(0) | -(0) | -(0) | -0.92(<50) |
| TESMX07ND | 4 | -(0) | -(0) | -(0) | -(0) | -(0) | -4.59(<50) |
| TESMX08ND | 4 | -(0) | -(0) | -(0) | -(0) | -(0) | -0.82(<50) |
| TESMX09ND | 4 | -0.13(<75) | -(0) | -(0) | -(0) | -(0) | -0.79(<50) |
| TESKT121120 | 4 | -1.21(<10) | -0.01(<10) | -0.34(<5) | -39.62(<100) | -1.08(<20) | -18.4(<50) |
Figure 5: Reading of image detection on the Randox Evidence Investigator TM equipment.
Conflict of Interest
The authors declare no conflict of interest.
Ethical Approval
Not applicable
Data Availability
The datasets used in this study are openly available at [repository link] and the source code is available on GitHub at [GitHub link].
Funding
This work did not receive any external funding.
References
Cite this article
Related Research


Special Issue
Launch a focused special issue to highlight research, emerging trends, and expert insights in your academic field.
