




IntelliPaper
Abstract
Large-scale road construction in mountainous areas inevitably leads to numerous excavation slopes, particularly in the Loess Plateau, characterized by abundant ancient landslides and complex stratigraphy. Excavation-induced stress relief can easily reactivate these ancient landslides, posing significant threats to engineering safety. This study takes an ancient landslide in the Loess Plateau as a case example. Field investigations clarified the lithological characteristics of the strata. Indoor triaxial unloading tests were conducted to examine the unloading creep behavior of silty soil and clay located near the sliding zone. Finally, numerical simulations were employed to analyze the evolution process of landslide reactivation induced by excavation. The study revealed the following findings: (1) The primary factor inducing the landslide is the differential unloading creep behavior of silty soil and clay. Silty soil readily reaches an accelerated creep state under unloading conditions, whereas clay remains relatively stable with smaller deformation. The creep behavior of the soil can be well described using the Nishihara model. (2) Comparison of two unloading stress paths showed that vertical stress unloading causes minor rebound deformation with minimal impact on overall deformation. In contrast, lateral stress unloading results in significant soil deformation, which is the main cause of the landslide. (3) During the landslide, there was an abrupt change in pore water pressure within the soil, which can be combined with deep soil deformation as a key indicator for monitoring and early warning of this type of landslide.
Explore Digital Article Text
I. INTRODUCTION
The construction of highways in mountainous regions involves extensive excavation projects. Large-scale excavation can easily disrupt the original topography and geomorphology of the mountains, altering the initial stress state and subsequently inducing slope deformation and failure. The Loess Plateau, an important industrial and agricultural base in China, has a dense transportation network. In recent years, over 100,000 kilometers of roads have been constructed, involving extensive high-fill and deep excavation projects in mountainous areas. Due to the unique properties of loess and the diversity of geological layers, numerous landslides have occurred during construction (figure 1). Extensive research indicates that rainfall is the primary factor inducing loess landslides (Chang et al. 2021). In addition, excavation during the construction process also affects slope stability (Wang et al. 2014, Meng et al. 2021). Landslides during the construction process severely impact project progress, increase construction costs, and pose significant threats to the safety of engineering personnel.
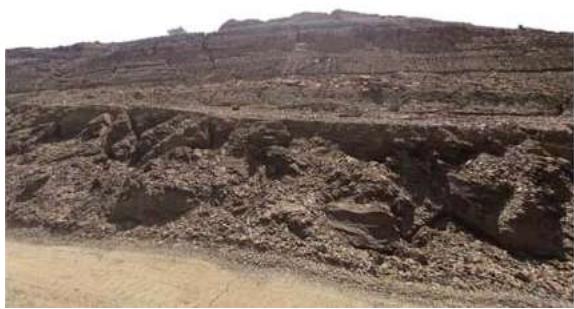 (a) Jinyang highway landslide
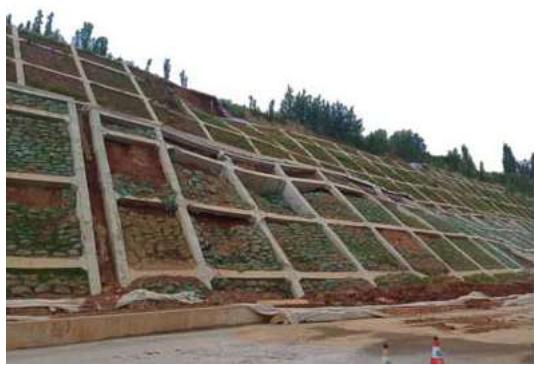 (b) Lixi highway landslide Fig. 1: Landslide because of excavation on Loess Plateau
The Loess Plateau exhibits typical stratification (Chen et al. 2024), resulting in the presence of various soil types within the same slope. The significant differences in the properties of these soils, combined with changes in stress states, lead to differential deformation, which is the intrinsic mechanical mechanism of landslides. Silty soil and clay are the most widely distributed soil types in the Loess Plateau. Due to their different origins, they exhibit significant differences in particle size, composition, hydraulic properties, and mechanical characteristics (Sun et al. 2024). However, these two soil types often appear as continuous layers. Once the external stress field changes, they are highly susceptible to differential deformation. Numerous studies indicate that loess landslides often exhibit significant creep characteristics (Chang et al. 2020, Lian et al. 2022, Wang et al. 2023, Duan et al. 2024). Compared to rock creep, soil creep deformation is more pronounced at the macroscopic level, resulting in larger deformations. Therefore, numerous fractures can be observed on slopes prior to landslide occurrence. Factors influencing soil creep behavior include not only the inherent properties of the soil but also external conditions such as water content, temperature, and stress. Water content alters the soil's microstructure, affecting its cohesion, internal friction angle, pore water pressure, and viscosity, thereby changing its mechanical behavior (Peng et al. 2022, Li et al. 2023, Duan et al. 2023, Guang et al. 2023).
Temperature indirectly affects soil properties by influencing soil water vapor migration (Kong et al. 2021, Xu et al. 2022, Sun et al. 2022). Stress state is a crucial external factor impacting soil creep behavior, encompassing stress history, stress path, and stress corrosion. In the research, factors such as pre-consolidation stress, loading paths, unloading paths, and cumulative damage of the soil were considered (Zhou et al. 2014, Pei et al. 2017, Yan et al. 2020). During highway excavation, the changes in the soil stress field under unloading conditions are the primary focus. The unloading path varies depending on the excavation method. Additionally, the Loess Plateau has a history of numerous ancient landslides, which are prone to reactivation under excavation influence (Yao et al. 2013, Zhu et al. 2022, Wu 2022). In summary, the excavation of slopes in the loess mountainous regions is characterized by diverse strata, climatic variations, and complex geological conditions. These factors determine the varied disaster mechanisms and failure modes, making it difficult to develop a unified landslide prediction model or method. Therefore, current landslide early warning systems primarily use rainfall as the main threshold.
In conclusion, rainfall is the primary factor inducing loess landslides. Thus, research on landslides triggered by highway excavation is closely linked to rainfall, with some studies also considering the effects of excavation unloading and construction vibration loads. The main research methods include numerical simulations, indoor model tests, and field case analyses (Zhang et al. 2020, Wang et al. 2022, Raouf et al. 2024). However, the majority of the Loess Plateau is located in a semi-arid climate zone, with rainfall concentrated between July and September. Extensive engineering practice has shown that landslides do not exclusively occur during the rainy season; they are also likely to happen in winter and spring (Wu et al. 2021, Xian et al. 2022). Therefore, studying the mechanisms and failure modes of non-rainfall-induced landslides is equally significant and can further enrich the landslide research system. As the period of maximum slope disturbance, the construction process is highly prone to landslides. However, there is relatively little focus on landslides during construction, especially research considering the differential unloading creep behavior of soils.
Therefore, this paper uses the reactivation of an ancient landslide in a silty-clay composite stratum during the construction period in the Loess Plateau as a case study. Through field investigations and laboratory tests, the differential creep behavior of silty soil and clay under different unloading paths was analyzed. Numerical simulations were conducted to invert the deformation of the landslide, proposing the corresponding failure mechanism and disaster evolution model. Based on the soil creep model, a stress attenuation-based landslide prediction model was developed. The research results can provide technical reference for related engineering projects and offer guidance for future studies.
II. LOCATION AND METHODS
2.1 Landslide Location and Characteristic
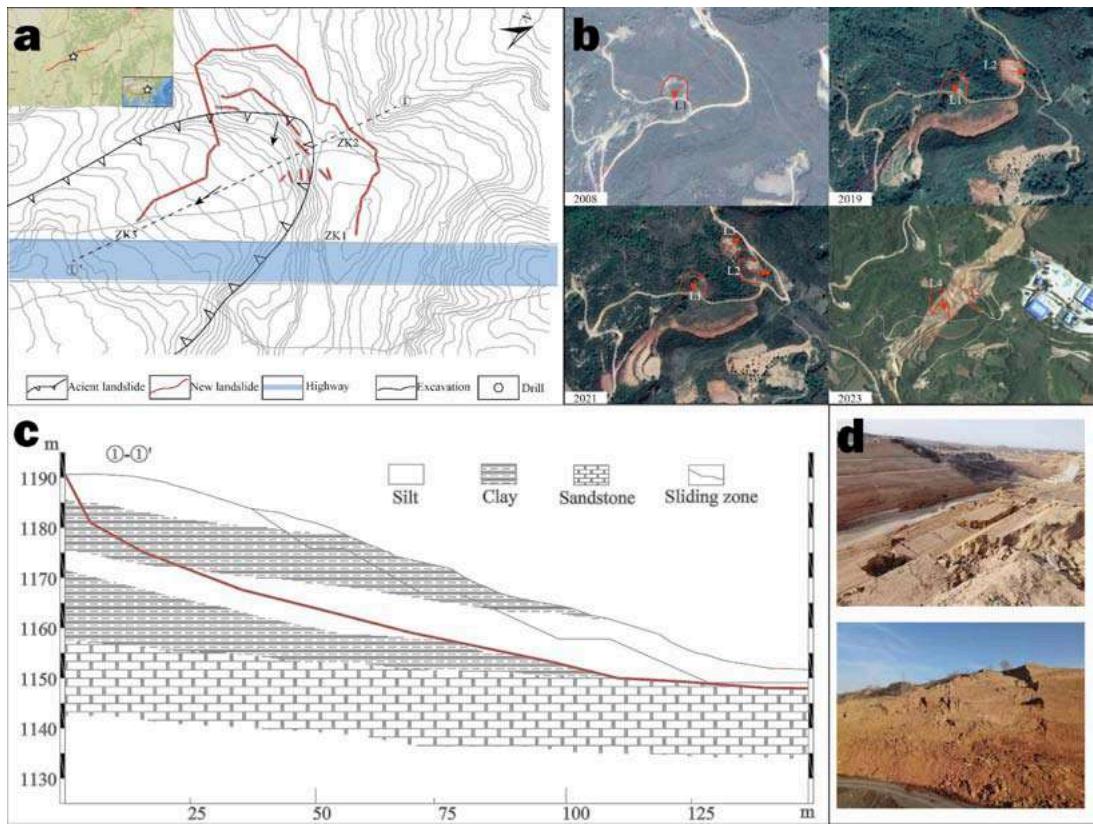
On December 1, 2022, a slope failure occurred on the Loess Plateau along the route of a highway under construction in Luliang City, Shanxi Province (111.44N, 37.08E), characterized by significant topographical relief. The landslide took place on an ancient landslide body, reactivated due to the impact of highway excavation. The sliding direction, influenced by the ancient landslide and unloading from excavation, developed towards the southeast. Arc-shaped cracks appeared at the rear edge of the ancient landslide, and feather-shaped cracks formed at the top of the excavated slope, indicating signs of reactivation of the ancient landslide. Additionally, the extent of this landslide has expanded compared to the ancient landslide, indicating that excavation unloading induced new sliding. To investigate the historical disaster characteristics of this area, nearly 20 years of remote sensing images from Google Earth were obtained, as shown in Figure 2b. The images reveal that this area, located at a protruding section of mountain extension, has experienced multiple landslides in recent years, indicating it is an unstable region.
Therefore, it is hypothesized that the current landslide is related to local lithology. To verify this, cores were drilled at different locations of the landslide to obtain rock layer information at various depths, and a cross-section along the main sliding direction was drawn (Figure 2c). The cross-section shows the stratigraphy from top to bottom as follows: silty soil, clay, silty soil, clay, and bedrock. The upper silty soil is yellowish-brown, uniform in texture, and contains mica and oxides. The lower silty soil is impure, interspersed with silty clay. The upper clay is light red, with a rough surface, low ductility, and easily fragmented. The lower clay is reddish-brown, with a smoother surface and fractures within the cores.
The bedrock is mainly sandstone, brownish-yellow in color, with moderate weathering, and the cores appear as fragments.
The sliding zone of the ancient landslide is located at the interface between the lower clay and bedrock, while the sliding zone of the current landslide is within the lower silty soil. The overall slope is moving downward, exhibiting multiple segments of sliding, characteristic of a traction landslide (Figure 2d).
 Fig. 2: Landslide Location and Characteristics
Numerous studies have shown that loess landslides are closely related to moisture. However, during the investigation, no significant increase in moisture content was observed near the sliding zone. To further clarify the relationship between moisture and the landslide, rainfall data for 2022 from the landslide location was analyzed. The results indicated that no rainfall occurred at the time of the landslide, which took place in winter when temperatures were low. According to Yang and Chen (2024), low temperatures can slow down moisture migration rates, reducing the likelihood of landslides. Therefore, it can be concluded that rainfall had a minimal impact on the occurrence of this landslide.
{"image_source":{"path":"images/aae4712b14fec6d3d32f9fa4e6cd33facbc8464cb4a2a029f06b1c71f69d443f.jpg"},"content":"","chart_caption":[{"type":"text","content":"Fig. 3: Rainfall Distribution at Landslide Area"}],"chart_footnote":[]}
2.2 Materials and Methods
Based on the above analysis, the primary cause of the landslide is the change in slope stress state induced by excavation unloading. However, no landslides occurred on other sections of the same highway using the same excavation method. A comparative analysis revealed that the unique stratigraphic structure of this area might be an intrinsic factor leading to the landslide. Therefore, indoor tests were conducted on silty soil and clay samples taken from near the sliding zone to further reveal the internal mechanisms by which the stratigraphy controls landslide deformation.
Tab. 1 Basic properties of soil sample
| Sample | Dry Density $\rho_{d}/(g/cm^{3})$ | Water Content w/(%) | Specific Gravity Gs | Liquid Limit $w_{L}/(\%)$ | Grain Size | ||
| >2mm | 0.075~2mm | <0.075mm | |||||
| Silt soil | 1.63 | 10.5 | 2.53 | 18.6 | 0.3% | 65% | 34.7% |
| Clay | 1.74 | 15.7 | 2.67 | 22.3 | 0% | 37% | 63% |
To simulate the changes in stress state at the site, the indoor tests used a stress path method to study the deformation patterns of the two soil types under different unloading conditions. Soil samples collected from the site were dried and prepared into cylindrical specimens with the field-measured moisture content. First, the specimens were subjected to an axial pressure and confining pressure of 300 kPa for isotropic consolidation. After the deformation stabilized, the axial pressure (Path 1) and confining pressure (Path 2) were unloaded to 0 kPa at a rate of 10 kPa/min, while recording the axial deformation of the specimens.
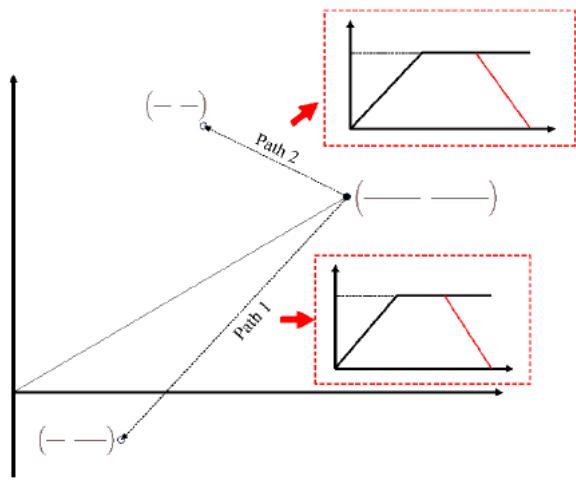 Fig. 4: Stress Path Laboratory Test Method
III. RESULTS
3.1 Axial Strain Test Results
The experiment yielded axial deformations of the two soil types under different stress path conditions, as shown in Figure 5. During the experiment, the specimens were compressed, resulting in increased axial deformation, and vice versa, decreased axial deformation. Under stress path condition 1, during the initial isotropic consolidation phase, the axial strain of the soil rapidly increased and then stabilized. Under the same consolidation stress conditions, the axial strain of the silty soil was 14.5%, slightly higher than the clay's 12.5%. Both exhibited similar overall trends in deformation. As the axial stress was gradually unloaded while maintaining confining pressure, the axial strain gradually decreased by approximately 0.5%, indicating some degree of elastic rebound deformation in the specimens. This phenomenon manifests in engineering as slight rebound deformation of the soil due to unloading at the top of slopes, which is negligible and has a minimal impact on overall slope stability.
Under stress path condition 2, with constant axial stress and gradual unloading of confining pressure, significant differences in deformation were observed between the two soil types. Initially (at 3000 seconds), a slight increase in axial strain of approximately 0.5% was noted. As unloading progressed, the silty soil exhibited a gradual increase in axial strain, while the clay-maintained stability in axial deformation. During the later stages of unloading (4000 to 4800 seconds), the silty soil experienced a sudden and pronounced increase in axial strain, accompanied by severe lateral deformation and eventual failure of the specimen. Conversely, the clay specimen remained stable with minimal strain and no failure observed. This phenomenon illustrates how lateral excavation of slopes reduces lateral earth pressure, causing differential deformation in distinct strata, which can lead to significant deformation along weak planes of the slope and trigger landslides.
{"image_source":{"path":"images/23ba763be7dfa1d72c78d5c17d8908b8377b5708110ceea46506b5126d69cfcd.jpg"},"content":"","chart_caption":[{"type":"text","content":"(a) Axial strain of stress path 1"}],"chart_footnote":[]} {"image_source":{"path":"images/de40877b262bec77a30ade95f6772e9ca661873e01fbcab943657e2c340d9b27.jpg"},"content":"","chart_caption":[{"type":"text","content":"(b) Axial strain of stress path 2"},{"type":"text","content":"Fig. 5: Axial strain test results"}],"chart_footnote":[]}
The axial strain results clearly demonstrate the differential deformation behavior of different soil types under the same stress path. Both soil types exhibited a certain degree of creep deformation. The distinction lies in that the clay showed sustained steady-state creep, while the silty soil exhibited initial steady-state creep followed by accelerated creep in later stages. The Nishihara model effectively captures creep behavior and can be expressed as follows:
Among formula (1), , are elastic module; , are dynamic viscosity coefficient; is the critical stress at which the sample undergoes plastic deformation and failure. These parameters can all be obtained through uniaxial compression tests. The specific testing procedures are not detailed here; the indicators for silty soil and clay are listed in Table 2.
Tab. 2: Strength parameters of soil
| E(MPa) | $\eta$ (kPa·s) | $\sigma_s$ (kPa) | |
| Silt soil(w=10%) | 18 | 0.0026 | 235 |
| Clay(w=15%) | 45 | 0.0035 | 561 |
By incorporating the parameters from Table 2 into the equation, theoretical solutions were computed and compared with experimental results, as shown in Figure 6. The comparison reveals a good fit between experimental and theoretical values, indicating that the model is capable of describing the creep deformation of both silty soil and clay.
{"image_source":{"path":"images/bd01c3946f5a25719d0bac501456771e1e236d12af2a301953ea69a3df475a14.jpg"},"content":"","chart_caption":[{"type":"text","content":"Fig. 6: Compare between Test and Theory Results"}],"chart_footnote":[]}
It is important to note that the Nishihara model assumes constant stress. However, in this experiment, the deviator stress gradually decreases, indicating a stress relaxation process. Stress relaxation is time-dependent, and thus the Nishihara model can be expressed in the form of Equation (2). When considering stress relaxation effects in three-dimensional space, the soil deformation surface is illustrated as shown in
Figure 7. Stress relaxation leads to an increase in soil strain, and greater relaxation amplitudes result in earlier strain increases. By performing a second derivative of Equation (2), inflection points in the curve can be identified, which correspond to sudden changes in strain over time. This characteristic serves as a significant indicator for landslide prediction.
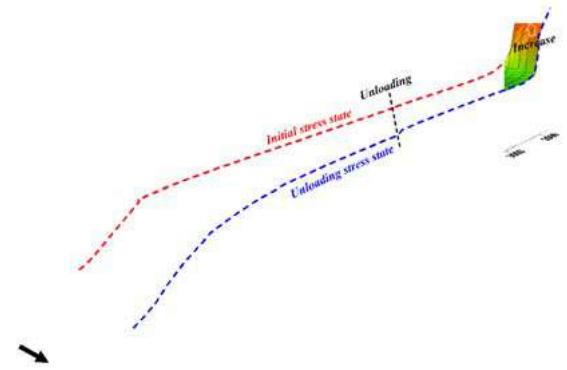 Fig. 7: Nishihara model theory solution by considering stress decrease
The above study mentioned that by performing a second derivative of the stress-strain-time model for critical soil layers, key deformation thresholds for slopes can be determined. Therefore, by solving the second derivative of Equation (2), assuming a homogeneous soil layer where the elastic modulus and viscosity coefficient are constant everywhere, the following results were obtained through calculations:
Assuming stress attenuation varies linearly with time, the first derivative of stress with respect to time represents the stress change rate, which is a constant value. Consequently, its second derivative is zero. Therefore, the above equation can be simplified to:
By solving Equation (4), we can obtain the analytical solution for the critical failure time of the soil layer.
3.2 Pore Stress Results
The response characteristics of silt and clay to moisture can be distinguished through pore pressure test results. Clay exhibits strong water retention capabilities; during testing, moisture within the soil mass is difficult to expel, thus resulting in minimal variations in pore pressure.
Under Stress Path 2 conditions, there is a decreasing trend in pore pressure, yet it generally remains at stress levels from earlier consolidation stages. In contrast, silt shows more pronounced changes in pore pressure. Under Stress Path 1 conditions during the initial consolidation phase, pore pressure steadily declines as moisture is expelled. Upon unloading axial stress, the soil experiences rebound, increasing pore size, which slows down the drainage rate of pore water. This leads to a sudden increase in pore pressure, followed by a continued decrease. Under Stress Path 2 conditions, as the confining pressure is unloaded, the soil undergoes compression deformation under axial stress, resulting in smaller pores and accelerated drainage of pore water. Pore pressure rapidly decreases upon completion of unloading, gradually approaching zero, indicating loss of strength in the soil mass.
{"image_source":{"path":"images/a3395422f850a4b7a16447e9f42f1067f35ce4356c601bf90cf2a09e72c74822.jpg"},"content":"","chart_caption":[{"type":"text","content":"(a) Pore pressure of stress path 1"}],"chart_footnote":[]} {"image_source":{"path":"images/c293ef522280df630261b48718c256481d0df36872dfec920ded5fe9254398cf.jpg"},"content":"","chart_caption":[{"type":"text","content":"(b) Pore pressure of stress path 2"},{"type":"text","content":"Fig. 8: Pore Stress Result"}],"chart_footnote":[]}
VI. NUMERICAL SIMULATION
To further investigate the process of reactivation and deformation of ancient landslides induced by highway excavation, finite element numerical analysis was conducted on-site slopes. Based on 2-meter resolution contour lines from previous surveys, a three-dimensional numerical model was constructed. Different stratigraphic layers (as shown in Figure 9) were defined using borehole data, and soil and rock parameters were assigned based on field surveys and laboratory tests. Both clay and silt were modeled using the modified Cam-Clay constitutive model, while the bedrock was modeled with an elastic constitutive model. The model consisted of 23,071 nodes and 110,815 elements, with boundary displacement constraints applied to the perimeter and base. The numerical simulation was divided into two stages: consolidation and excavation. Initially, the model was subjected to the initial gravitational field, computed until reaching equilibrium to establish the initial stress field of the ancient landslide. Subsequently, displacements of all nodes were reset to zero while maintaining the existing stress state unchanged, simulating the excavation process and recording displacement changes until reaching equilibrium again. The excavation was conducted in stages to reflect engineering practice, divided into three phases. Monitoring points were strategically placed within the rock layers at the shear zones to observe landslide deformation characteristics throughout the construction process.
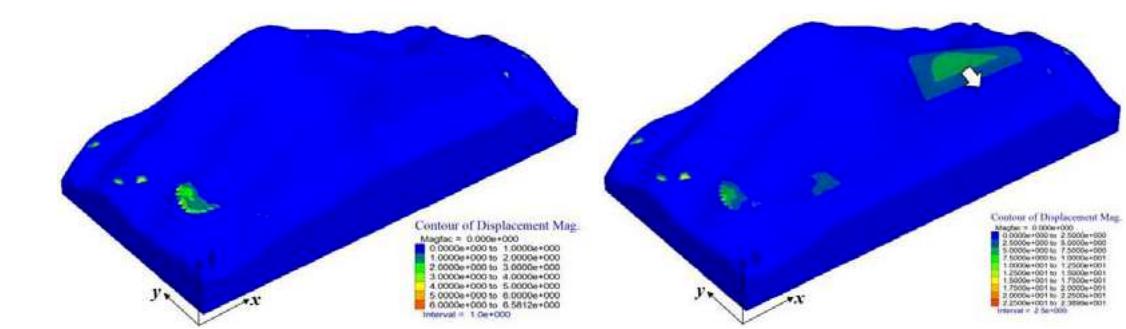
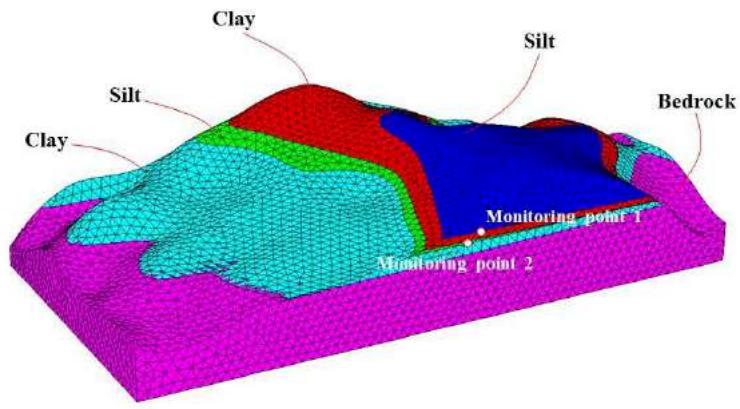 Fig. 9: Three-Dimensional Mesh Division Diagram of Landslide
Displacement contour maps for different stages were obtained through calculations (Figure 10). Under initial stress conditions, the overall deformation of the slope mass occurred towards the direction of the ancient landslide, with the deformation zone located on the ancient landslide mass. The maximum deformation occurred at the front edge of the landslide, reaching up to 2 meters. After the first excavation, lateral unloading resulted in a tendency for the slope to slide towards the open space, with topsoil displacement reaching a maximum of 2 meters.
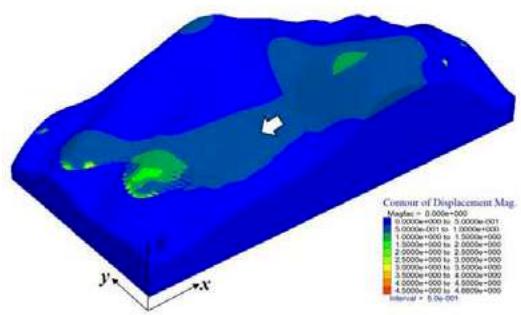
Following the second excavation, where the excavation reached the clay layer, the slope did not exhibit significant deformation. Upon completion of the third excavation, continued displacement occurred in the silt layer at the top of the slope, with maximum displacements reaching up to 7 meters. Compared to the initial excavation phase, the displacement at the end of excavation exceeded three times, indicating a significant impact of excavation unloading on the landslide.
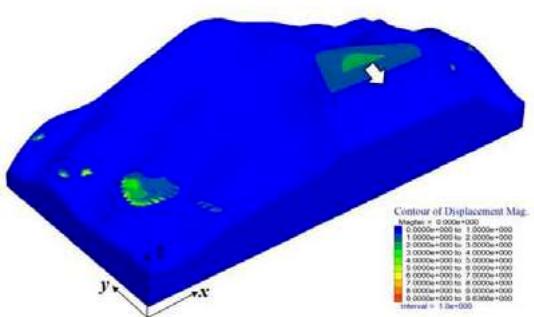 (a) Displacement contour of original slope (b) Displacement contour after first excavation (c) Displacement contour after 2nd excavation (d) Displacement contour after 3rd excavation
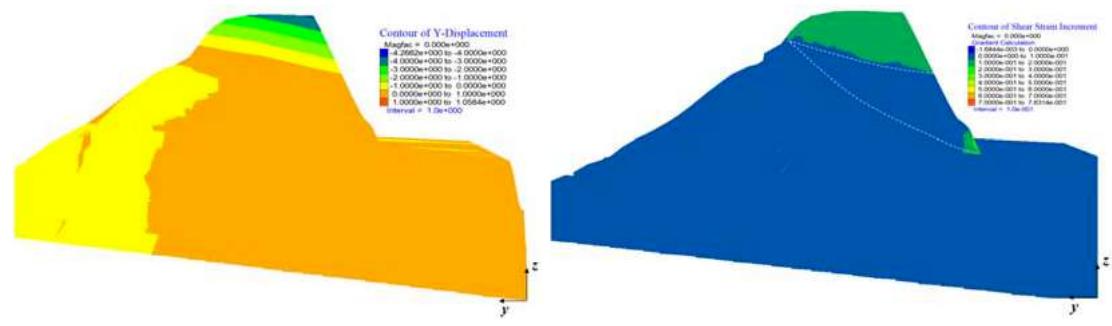 (e) Y Displacement contour of 1-1' profile (f) Shear strain increment of 1-1' profile Fig. 10: Displacement Contour of Landslide To further investigate the deformation characteristics of the soil mass within the sliding zone induced by excavation, monitoring of deformations in clay and silt located on the sliding zone was conducted in different directions. The monitoring results are shown in Figure 11.
In the x-direction, during the consolidation stage, silt exhibited greater displacement than clay, with maximum displacements of 0.125 meters for silt and 0.06 meters for clay upon completion of consolidation. This indicates that under the same stress conditions, silt is more prone to significant deformation, potentially leading to the formation of weak interlayers prone to sliding within the landslide mass. After consolidation, excavation simulation began. Following the first excavation, silt and clay exhibited opposite displacement directions, with clay showing larger displacements post-excavation, reaching up to 0.05 meters, while silt exhibited smaller displacements, maximum at 0.01 meters. The displacement curves showed two stages: stable deformation and accelerated deformation. Over time, clay's displacement gradually stabilized, whereas silt continued to show increasing trends. After the second excavation, soil displacement decreased compared to the first excavation, with clay reaching a maximum displacement of 0.025 meters and silt showing negligible deformation.
Following the third excavation, lateral constraints on the slope were completely lost, resulting in significantly increased soil displacements, with silt reaching a maximum of 0.05 meters and silt showing features of accelerated creep deformation.
In the y-direction, overall, clay exhibited smaller overall displacements compared to significant displacements in silt. After initial consolidation, silt exhibited a maximum displacement of 0.8 meters. Post-first excavation, silt moved towards the open face and continued to increase, reaching a maximum of 2 meters. After the second excavation, silt displacement decreased to 0.5 meters compared to the first excavation. Following the third excavation, silt displacement rapidly increased, entering a phase of accelerated deformation, with a maximum displacement of 6 meters.
In the z-direction, settlement deformation occurred in the soil mass, where overall, clay displacement was slightly lower than silt displacement. After the first excavation, silt continued to deform, reaching a maximum displacement of 1 meter, while clay initially deformed with a displacement of 0.75 meters, stabilizing subsequently. Following the second excavation, clay exhibited minimal deformation, while silt displaced 0.25 meters in the z-direction. With the third excavation, silt continued deforming, with a noticeable increase in the slope of the displacement curve, reaching a maximum displacement of 2.7 meters. Clay stabilized after reaching a displacement of 1.75 meters.
Based on the above calculation results, it is evident that during the excavation process, the silt layer near the sliding zone undergoes continuous deformation, whereas the clay layer reaches a stable state after deformation. Additionally, the displacement of clay is significantly lower than that of silt, which is a key factor contributing to the convergence of the calculation results. The displacement curves indicate that silt exhibits distinct characteristics of unloading creep, including stable creep and accelerated creep processes. Overall, the numerical calculation results align with the patterns observed in indoor unloading creep tests.
{"image_source":{"path":"images/74c0b2f5f9262368c96c615e0238cea6d60441d433ac9834988bd4ea1daaaecd.jpg"},"content":"","chart_caption":[{"type":"text","content":"(a) Displacement of x direction"}],"chart_footnote":[]} {"image_source":{"path":"images/ae8ef16b2eb10863c83f391e75e5a3e1852270c33c02e09e03ca50bc08ca0e83.jpg"},"content":"","chart_caption":[{"type":"text","content":"(b) Displacement of y direction"}],"chart_footnote":[]}
{"image_source":{"path":"images/dacf57645b656a28b696aef794a5f84de5596d2ab3aedb619962337765c8629e.jpg"},"content":"","chart_caption":[{"type":"text","content":"(c) Displacement of z direction"},{"type":"text","content":"Fig. 11: Displacement Monitoring Results of the Soil Layers in the Sliding Zone"}],"chart_footnote":[]}
V. DISCUSSION
5.1 Mechanics Mechanism of Landslide under Excavation
During slope excavation, two types of unloading modes are encountered: axial stress unloading and lateral stress unloading, corresponding to Stress Path 1 and Stress Path 2 in this study, respectively. According to the above research, Stress Path 2 has a more significant impact on slope stability, primarily manifesting as deformation and instability induced by excavation unloading. In this paper, the clay and silt layers located in the sliding zone are relatively thin and close to the surface, resulting in their identical initial stress conditions (Figure 12). In practical engineering, excavation progresses downward in stages, initially dominated by axial stress unloading where the lateral stress on the soil remains unchanged. This leads to a gradual decrease in the Mohr circle radius, placing it below the strength envelope, thereby maintaining slope stability. As excavation approaches the sliding zone, lateral stress begins to decrease, transitioning the soil into Stress Path 2. The Mohr circle radius gradually increases, and when it exceeds the strength envelope of silt but not that of clay, the silt fails, resulting in deformation failure along the silt layer. Following slope instability, the stress field redistributes, with the energy accumulated in the upper clay layer slowly released, reducing the likelihood of further deformation failure. Eventually, this process forms a landslide primarily along the silt layer, establishing it as the main sliding zone.
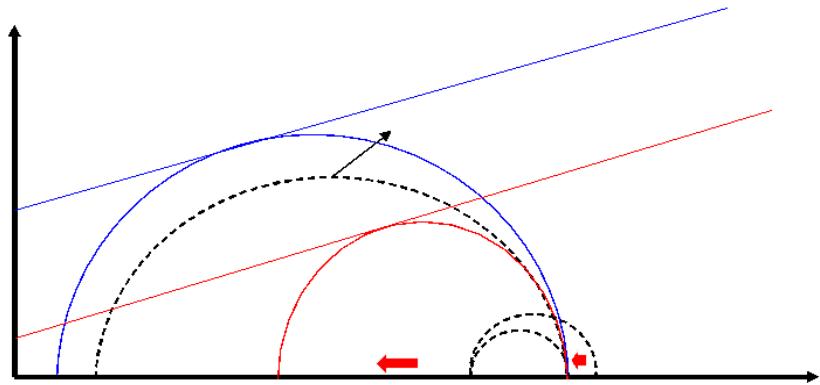 Fig. 12: Changes in Mohr Circles during Excavation Unloading
Furthermore, due to the significantly lower matrix suction of silt compared to clay, its water retention capacity is weaker. During unloading in Stress Path 1, characterized by axial stress release, the soil undergoes minor rebound deformation. At this stage, the lateral stress constraint becomes more pronounced, leading to increased pore water pressure. In Stress Path 2, characterized by lateral stress unloading, the soil undergoes compression deformation under axial stress. However, the loss of lateral constraint causes lateral expansion and dilation of the soil, resulting in increased pore space. As soil particles rearrange, they tend to lose water, leading to a decrease in pore water pressure. Clay, with its higher water retention capacity and larger elastic modulus, experiences less significant changes in pore water pressure.
It is noteworthy that significant time-dependent behavior occurs during deformation. After unloading is completed, immediate failure does not occur, which is closely related to the viscous resistance between soil particles. The dynamic viscosity coefficient of silt is 0.0026, while for clay it is 0.0035. A higher dynamic viscosity coefficient indicates a greater ability of the soil to resist time-dependent deformation. Therefore, time-dependent deformation is more pronounced in silt. The viscosity coefficient is not constant during stress changes but varies with the moisture content of the soil. As natural unloading creep occurs under drained conditions, the soil moisture content gradually decreases, leading to a reduction in the viscosity coefficient. This reduction is also a factor contributing to significant late-stage deformation.
5.2 Evolutionary Pattern of Landslide Triggered by Excavation
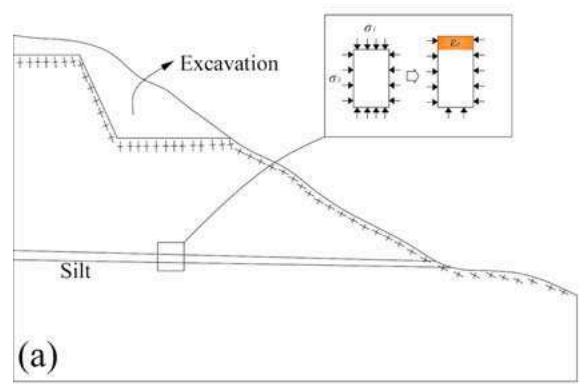
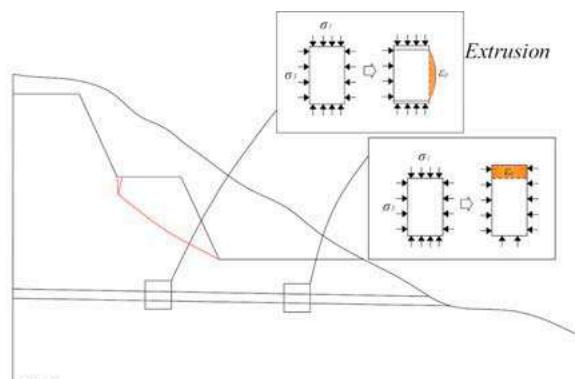
This study examines the multi-scale deformation characteristics of slope soil during the entire excavation process using a specific landslide as a case study. Initially, at the onset of excavation, the topsoil undergoes unloading, resulting in slight rebound deformation in the silt layer due to the unloading process. This redistribution of stress fields on the slope indicates initial stability (Figure 13a). As excavation progresses to the second terrace phase, reduced lateral stress in the rear silt layer causes it to extrude towards open space. Simultaneously, the front silt layer exhibits some rebound deformation under top unloading. Differential deformation patterns between the front and rear soils contribute to an uplift trend towards the slope's leading edge. Consequently, potential sliding zones become evident on the second terrace, accompanied by tension cracks appearing at the rear (Figure 13b).
Excavation through the silt layer induces lateral squeezing deformation in the front silt layer under lateral stress unloading, resulting in tension cracks and potential sliding surfaces on the first terrace (Figure 13c). Post-excavation, exposure of slope soil to atmospheric conditions triggers changes in soil properties influenced by rainfall and temperature variations. The critical interface depth between loess and the atmosphere, typically around 3 meters (Hou et al., 2019; Huang et al., 2019), is extended by the development of tension cracks, providing a basis for deep-seated sliding.
Following excavation, the silt layer remains unsaturated, with voids filled by water and air between soil particles. Evaporation of soil moisture due to changing dry climates leads to structural alterations among soil particles, forming interconnected voids within the soil matrix (Yang and Wang, 2020; Mu et al., 2023).
This substitution of water with air reduces the viscosity coefficient, accelerating soil creep deformation. Shear deformation along interconnected voids among soil particles leads to lateral expansion and vertical compression, observed macroscopically as squeezing creep deformation of the silt layer. Subsequently, this process induces the development of slope cracks, with stress concentrating at crack tips, thereby forming interconnected sliding surfaces and triggering deep-seated sliding (Figure 13d).
 (b)
(b)
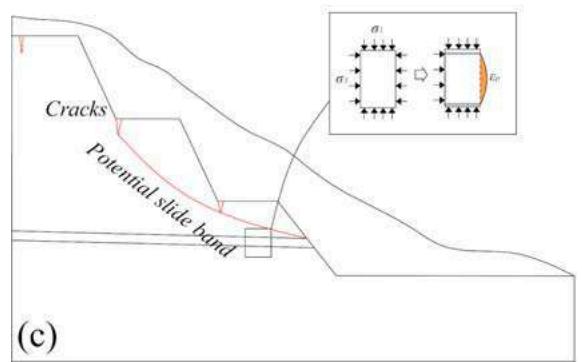
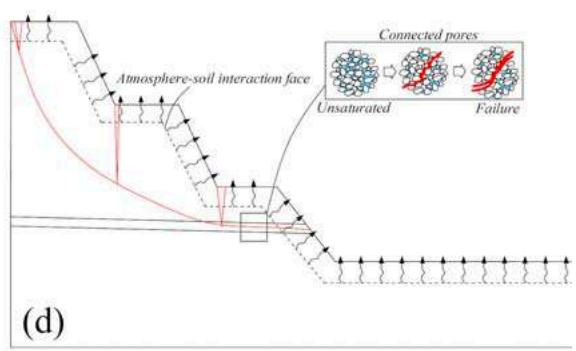 Fig. 13: Schematic diagram of landslide induced by excavation unloading
N engineering construction involving excavation and unloading of slopes containing weak interlayers, it is advisable to conduct comprehensive monitoring of dynamic deformations throughout the construction process. Concurrently, continuous on-site tracking of post-excavation crack development on the slopes is essential. Timely implementation of temporary support measures such as toe pressure, crack sealing, and anchoring reinforcement is recommended upon crack formation. After excavation completion, covering the slope's surface with geogrid can effectively mitigate water, vapor, and heat exchange between the soil and atmosphere. This practice helps maintain soil stability and reduces construction-related dust emissions, thereby improving on-site air quality.
IV. CONCLUSION
The study focuses on a landslide along a highway in the Loess Plateau, field surveys, laboratory experiments, and numerical simulations were conducted to investigate triggering factors and deformation mechanisms. The findings are summarized as follows:
- The highway landslide was primarily triggered by excavation-induced reactivation of an ancient landslide, with the slip zone located within deep layers of silt. Differential soil properties led to varying deformations, particularly with silt experiencing significant extrusion deformations under unloading stress paths, resulting in extensive deformations in the upper soil layers and triggering the landslide.
Two stress paths were identified during excavation: axial stress unloading and lateral stress unloading. Lateral stress unloading was identified as the primary cause of landslide occurrence. The Westergaard creep constitutive model, accounting for stress relaxation, effectively described soil deformation under unloading conditions. 3. Sudden changes in pore water pressure and soil deformation were critical precursors to landslide occurrence. For accurate prediction of landslides induced by excavation and unloading, monitoring pore water pressure changes in high-risk areas of the slope is crucial. This should be integrated with evaluations of soil elastic modulus, viscosity coefficient, critical plastic stress, and theoretical failure time to facilitate scientifically grounded early warnings.
Declarations of interests: The authors declare that they have no known competing financial interests or personal relationships that could have appeared to influence the work reported in this paper.
ACKNOWLEDGEMENT
This research is supported by the Technology project of the Shanxi communications holding group (Grant No. 22-JKKJ-01, 22-JKKJ-05, 21-JKKJ-11). Shanxi transportation science research institute Technology project (Grant No. 21-JKCF-58). Shanxi Provincial Basic Research Program (Grant No. 202103021223463, 202203021222426, 202203021222428). National Natural Science Foundation of China (Grant No. 52127815).
Conflict of Interest
The authors declare no conflict of interest.
Ethical Approval
Not applicable
Data Availability
The datasets used in this study are openly available at [repository link] and the source code is available on GitHub at [GitHub link].
Funding
This work did not receive any external funding.
References
Cite this article
Related Research



Special Issue
Launch a focused special issue to highlight research, emerging trends, and expert insights in your academic field.
