




IntelliPaper
Abstract
Glioblastoma (GBM) is one of the most aggressive and difficult-to-treat tumors in humans. The low efficacy of treatment is due to the molecular and cellular heterogeneity of the tumor, as well as disruption of biochemical mechanisms of the innate immune system, including peptides such as cathelicidin LL-37 and protegrin-1 (PG-1).
The objective: to establish the effect of the combined use of LL-37, PG-1 and chemotherapy drugs on the expression of p53, GFAP, ATRX, Ki-67, TF, PDPN and EGFR proteins in GBM patient cell cultures, as well as their relationship to overall survival (OS) and life expectancy (LE) of patients.
Materials and Methods: Cells were isolated from GBM biopsies obtained from patients (n = 30) and grown under standard conditions for 2 days. The cells were treated with different doses of the following chemotherapy drugs: temozolomide (TMZ), doxorubicin (DOX), carboplatin (CARB), cisplatin (CIS), etoposide (ETO) as well as peptides LL-37, PG-1, to determine the 50% inhibitory concentration (IC50) using the MTT assay. The expression of p53, isocitrate dehydrogenase-1 (IDH1), glial fibrillary acidic protein (GFAP), ATP helicase chromatin (ATRX), proliferation antigen (Ki-67), transferrin (TF), podoplanin (PDPN), and epidermal growth factor receptor (EGFR) proteins in GBM cells analyzed using immunohistochemical (ICH) staining with specific antibodies. Associations between these proteins and OS were analyzed using GraphPad Prism 8.0 software.
Results: Statistically significant correlations were found between the expression of TF (r= -0.556, p=0.04), EGFR (r=0.799, p=0.03) and Ki-67 (r= 0.651 p=0.002) and TF (r=-0.899, p=0.004) in GBM cells and the IC50 values of LL-37, PG-1 respectively. The low IC50 value of LL-37 (less than 7 μM) and the high expression of p53 protein (20%, 12 vs 6.5 months, p=0.0037), GFAP (40%, 12 vs 9 months, p=0.0019) were associated with a longer life expectancy for the patients. In contrast, low sensitivity of GBM cells to LL-37 (higher 7 μM) and high expression of Ki-67 (15% or higher) were associated with a shorter life expectancy for the patients (10 vs 14 months, p=0.0452). Conversely, low EGFR expression (below 40%) and a low IC50 for LL-37 were associated with a longer life expectancy (12 vs 6.5 months, p=0.0031). High sensitivity of GBM cells to PG-1 (less than 8 µM) and high expression of proteins p53 (20%, 12 vs 8 months, p=0.0126), GFAP (40%, 24 vs 10 months, p=0.0042), ATRX (higher 15%, 8 vs 14 months, p=0.0346), as well as low expression of Ki-67 (below 15%, 8 vs 14 months, p=0.0346) and EGFR (below 40%, 8 vs 12 months, p=0.0124) were associated with an increase life expectancy. Low EGFR expression (below 40%) and low sensitivity to PG-1 were associated with longer life expectancy (12 vs 8 months, p=0.0124).
Conclusions: The observed associations between the expression of p53, GFAP, Ki-67, and EGFR proteins in GBM cells, as well as ATRX expression and IC50 of LL-37 and PG-1 with OS of the patients may potentially be used to develop a chemoimmunotherapeutic scheme for evaluating the efficacy of treatment in GBM patients.
Explore Digital Article Text
I. INTRODUCTION
Glioblastoma (GBM) is one of the most aggressive and intractable tumours in humans . The overall 5-year survival rate (OS) of patients in the United States is 6.9% and life expectancy is only 8 months, with relapses occurring in 100% of cases . GBM therapy protocols include surgical resection of the tumour followed by radio- and chemotherapy with temozolomide (TMZ) . It is assumed that the main reason for the low effectiveness of GBM therapy is molecular and cellular heterogeneity of the tumour and its microenvironment.
GBMs include tumor and stem cells that differ in their degree of differentiation, proliferative activity, ability to invade, metastasis, DNA repair mechanisms, and expression of multidrug-resistant proteins. The most common molecular alterations in GBM involve: wild-type and mutant forms of isocitrate dehydrogenase (IDH-wt, IDH-mut), methylation of the MGMT gene promoter (O6-methylguanine DNA methyltransferase), ATRX, Ki-67, GFAP as well as mutations in genes encoding proteins such as: p53 (TP53), EGFR, and others [4]. Another reason associated with the progression of GBM and its resistance to therapy is the disruption of biochemical and molecular-cellular mechanisms of anti-cancer immunity. Cytotoxic T- and B-lymphocytes, plasmocytic cells and antibodies secreted by them, as well as proteins and peptides of innate immunity, such as defensins, cathelicidins, peroxidases, lactoferrin and lysozyme participate in its formation [5,6]. As components of the GBM microenvironment, they can determine the individual sensitivity of tumour cells to anti-cancer therapy. In this regard, the authors selected two peptides with different structures from the cathelicidin family: cathelicidin LL-37, with an -helical structure, from human neutrophil azurophil granules, and protegrin-1 (PG-1), a peptide with a -hairpin conformation, from pig neutrophils, to study their anti-cancer cer activity.
The Objective: to establish the effect of the combined use of LL-37, PG-1 and chemotherapy drugs on the expression of p53, GFAP, ATRX, Ki-67, TF, PDPN and EGFR proteins in GBM patient cell cultures, as well as relationship their to overall survival (OS) and life expectancy (LE) of patients.
II. MATERIAL AND METHODS
2.1 Patients
The study was conducted on 30 patients with GBM who were treated at the Polenov Neurosurgical Institute of the Almazov Centre (St. Petersburg, Russia) between 2021 and 2025. All patients underwent magnetic resonance imaging (MRI), tumor resection, and histological examination in a pathology laboratory. All patients underwent magnetic resonance imaging (MRI), tumour resection, and histological examination in a pathology laboratory. All patients received chemotherapy with TMZ or cisplatin, carboplatin, or etoposide for 2-8 courses from 2021 to 2025 at the Napalkov State Budgetary Healthcare Institution «Saint-Petersburg clinical scientific and practical center for specialised types of medical care (oncological)».
Inclusion Criteria: patients over 18 years old, primary histological diagnosis of GBM grade IV, availability of survival data and IHC expression markers.
Exclusion Criteria: patients under 18 years old, histological other brain tumour types than GBM, or unstable hemodynamics, severe somatic disease course, lack of life expectancy data or IHC markers. The primary endpoint of the study was neurosurgical surgery to remove the GBM. The final endpoint of the study was biological death.
The study was approved by the local ethics committee at the Institute of Experimental Medicine (no. 4/25 dated 25 December 2025).
2.2 Cell Culture
In sterile laminar flow conditions, GBM biopsies were cut into small fragments and treated with 0.25% trypsin-EDTA solution (Sigma-Aldrich, USA) at C for 5 minutes. Isolated cells were counted, and cells were transferred to each well of a 96-well plate (TPP, Switzerland), to which Dulbecco's modified Eagle medium (DMEM) containing 10% fetal calf serum (FCS) (Sigma Aldrich, USA) was added and incubated at C and 5.0% CO for two days [7].
2.3 MTT Analysis
To assess the anti-cancer effects of chemotherapy drugs, LL-37 and PG-1 on GBM cells, an MTT assay was performed [8]. We prepared 2-10-fold dilutions of chemotherapy drugs and a 2-fold dilution of LL-37 and PG-1 at a volume of 50 l of DMEM (Table 1), which were added to each well of cell culture plates containing GBM cells. The plates were incubated at 37.0°C and 5.0% CO for 24 hours. Then, 25 l of MTT solution (5 mg/mL) was added to each well and left for 3 hours under the same conditions. At the end of the incubation, 50 l of isopropanol (0.04 N) was added to all the wells. HCl was mixed, and the optical density of the solutions was measured using a SpectraMax
250 flat-bed spectrophotometer at wavelengths of 540 and 590 nm. The anti-cancer effect of the drug was determined by comparing the optical density of the wells containing GBM cells to those of positive and negative control wells, according to formula 1:
Where DC (%) is the percentage of dead cells, OD (test) is the optical density of wells with cells when a drug is added at a given dose, OD(o% VC) is the OD of the control wells with the nutrient medium, and OD (control) is the density of the cells in the wells without the addition of any drugs.
2.4 Determination of for Chemotherapy Drugs, LL-37 and PG-1
The in vitro anti-cancer effects of chemotherapy drugs and LL-37, PG-1 were evaluated based on the calculation of their 50% inhibitory concentration ( ). GBM cells were incubated with doxorubicin (DOX, Doxorubicin-LANS®, 2 mg/ml, Veropharm, Russia), etoposide (ETO, 20 mg/ml, Ebewe Pharma, Austria), carboplatin (CARB, Carboplatin-LANs®, 10 mg/ml, Veropharm, Russia), temozolomide (TMZ, Temodal capsules, 100 mg, Orion Pharma, Finland), cisplatin (CIS, Cisplatin-LANS®, 0.5 mg/ml, Veropharm, Russia), as well as human cathelicidin LL-37 (LL-37, Anaspec, USA), and porcine protegrin-1 (PG-1, SynPep, USA). The cells were incubated with each drug at different concentrations, as shown in Table 1.
Table 1: The doses of chemotherapy drugs and LL-37, PG-1 used to calculate IC
| Drugs | Dose, μM |
| DOX | 7.3; 18.4; 36.8; 73.6; 460.0; 920.0 |
| CARB | 134; 269; 673; 1 350; 2.690; 26.900 |
| TMZ | 155; 386; 773; 1.550; 5.150; 15.500 |
| CIS | 16.1; 33.2; 83; 166; 332; 830; 1.660 |
| ETO | 0.8; 1.6; 3.3; 6.7; 13.5; 27 |
| LL-37 | 1.0; 2.0; 4.0; 8.0; 16.0; 32.0 |
| PG-1 | 2.0; 4.0; 8.0; 16.0; 32.0; 64.0 |
2.5 Immunohistochemical Analysis
GBM samples from 30 patients were immunohistochemically (IHC) tested for the expression of IDH1, GFAP, p53 (TP53), EGFR, Ki-67, ATRX, and PDPN in GBM tissues. The samples were fixed in 10% formalin and poured into paraffin blocks. Sections of 5 microns were prepared and de-waxed in xylene. They were then transferred to a 0.3% hydrogen peroxide solution with methanol for 30 minutes, after which they were washed in a phosphate buffer. All sections were incubated with primary antibodies for 12 hours to detect proteins. The primary antibodies used were IDH1-R132H (clone HMab-1.5 g/ml, Dako, Denmark) [9], p53 (clone DO7, 1:50, Dako, Denmark), EGFR (clone EP38Y, 1:100, Abcam plc, UK), and GFAP (ASTRO6, 1-2 g/ml, ThermoFisher, USA), Ki-67/MIB-1 (1:100, Immunotech, Germany), ATRX (0.5 mg/ml, Sigma-Aldrich, USA) [9,10,11]. Immunohistochemical analysis of ATRX, p53, GFAP, EGFR, and Ki-67/MIB-1 was performed using the streptavidin-biotin-peroxidase method with the LSAB2 kit from Dako Glostrup (Denmark) [12,13].
2.6 Statistical Analysis
All experiments were performed in triplicate. The data are presented as an average and standard deviation, and were considered significant at p < 0.05. A nonparametric Mann–Whitney U test was used to compare differences between two independent groups with a small sample size (\<30) [14]. Descriptive statistics and Kaplan–Meier survival analysis were performed using GraphPad Prism version 8.0.1 (21/09/2020, San Diego, CA, USA).
III. RESULTS
First, an IHC staining was conducted to examine the expression levels of marker proteins p53, GFAP, ATRX, Ki-67, and EGFR in GBM cells from patients as well as their in vitro sensitivity to chemotherapy drugs, LL-37 and PG-1 (Table 2).
Table 2: Determination of the Effectiveness of Chemotherapy and Peptides on Gbm Cells of the Patients
| ID patients | $IC_{50}, \mu M$ | ||||||
| DOX | CARB | TMZ | CIS | ETO | LL-37 | PG-1 | |
| 11081 | 290.4 | 29,431.0 | 16,179.5 | 2,448.4 | 27.0 | 10.3 | 16.0 |
| 11961 | 3,350.3 | 39,792.9 | 43,539.3 | 11,919.7 | 86.5 | 32.2 | 123.6 |
| 6770 | 850.0 | 4,000.0 | 14,000.0 | 10,90.0 | 26.3 | 9.5 | 8.7 |
| 7934 | 50.9 | 2,000.0 | 7,491.0 | 200.0 | 7.5 | 2.0 | 1.2 |
| 49142 | 548.3 | 2,708.4 | 11,056.0 | 776.0 | 11.4 | 6.6 | 7.4 |
| 25873 | 560.0 | 888.8 | 8,619.2 | 300.0 | 8.9 | 24.1 | 30.1 |
| 57595 | 16.9 | 3,093.6 | 194.5 | 1,682.3 | 7.5 | 8.3 | 8.6 |
| 55068 | 546.5 | 27,574.5 | 4,789.5 | 11,04.8 | 11.8 | 6.4 | 3.9 |
| 15159 | 179.2 | 116.4 | 436.8 | 698.1 | 11.4 | 32.1 | 15.8 |
| 62642 | 20.3 | 42,495.1 | 24,015.7 | 1,158.5 | 32.3 | 28.1 | 34.3 |
| 60886 | 278.8 | 4,498.0 | 2,174.3 | >1,660.0 | 6.3 | 1.1 | 1.2 |
| 18871 | 2,682.8 | 24,031.9 | 11,976.9 | 1,776.4 | 30.9 | 24.3 | 23.8 |
| 114495 | 3,350.3 | 39,792.9 | 43,539.3 | 965.8 | 86.5 | 26.8 | 35.4 |
| 10677 | 1,180.1 | 20,471.8 | 1,309.1 | 2,448.4 | 3.4 | 3.5 | 7.4 |
| 1401 | 920.0 | 5,136.5 | 611.8 | 261.2 | 10.3 | 4.0 | 16.0 |
| 19872 | 2,682.8 | 24,031.9 | 11,976.9 | 1,776.3 | 30.9 | 24.3 | 23.8 |
| 8989 | 817.1 | 20,195.2 | 14,486.0 | 1,218.8 | 26.3 | 9.7 | 12.1 |
| 20939 | 920.0 | 17,861.9 | 15,500.0 | 476.5 | 38.0 | 11.8 | 19.3 |
| 39114 | 3,458.6 | 25,000.0 | 12,282.1 | 1,824.2 | 32.8 | 26.8 | 26.2 |
| 40906 | 1,083.2 | 38,147.6 | 1,4961.7 | 1,596.1 | 58.9 | 20.8 | 19.4 |
| 48993 | - | 1,126.8 | 15,407.5 | 120.4 | 38.7 | 3.1 | 14.1 |
| 48307 | 1,260.3 | 20,852.7 | 1,510.7 | 1,280.8 | 9.5 | 5.7 | 6.2 |
| 9439 | 1,513.2 | 26,116.5 | 22,206.3 | 1,784.9 | 41.3 | 7.2 | 0.8 |
| 10448 | 478.7 | 24,237.2 | 14,659.1 | 1,299.0 | 3.4 | 1.9 | 4.3 |
| 27980 | 733.4 | 2,223.4 | 5,345.6 | 835.3 | 9.3 | 17.5 | 1.9 |
| 12645 | 483.6 | 2,605.4 | 5,258.3 | 729.8 | 7.0 | 7.2 | 3.9 |
| 7593 | 1,123.9 | 2,110.4 | 14,905.5 | 298.9 | 26.8 | 8.6 | 13.2 |
All patients were categorized as wild-type (IDH1-wt). This data allowed for a correlation analysis between the expression of these markers in GBM cells and chemotherapy drugs, LL-37 and PG-1 IC values, Table 3.
Table 3: Correlations Between the Expression of Markers in GBM Cells and the Chemotherapy Drugs, LL-37 and PG-1 IC
| Drugs | ATRX | GFAP | Ki-67 | P53 | EGFR | PDPN | TF |
| DOX | 0.576p=0.019 | -0.584p=0.01 | -0.101p=0.615 | -0.231p=0.446 | 0.395p=0.438 | 0.400p=0.251 | -0.421p=0.224 |
| CARB | 0.221p=0.411 | -0.075p=0.300 | 0.455p=0.016 | 0.231p=0.448 | -0.337p=0.513 | 0.247p=0.490 | -0.494p=0.146 |
| TMZ | 0.586p=0.017 | -0.580p=0.002 | 0.093p=0.643 | -0.203p=0.504 | 0.367p=0.474 | -0.197p=0.586 | -0.627p=0.04 |
| CIS | 0.094p=0.728 | -0.436p=0.02 | 0.179p=0.368 | -0.142p=0.642 | 0.237p=0.651 | 0.413p=0.235 | -0.433p=0.210 |
| ETO | 0.486p=0.05 | -0.358p=0.06 | 0.392p=0.04 | -0.185p=0.544 | 0.418p=0.409 | 0.036p=0.921 | -0.719p=0.019 |
| LL-37 | 0.483p=0.05 | -0.320p=0.103 | 0.268p=0.176 | -0.191p=0.532 | 0.799p=0.03 | 0.293p=0.411 | -0.556.p=0.04 |
| PG-1 | 0.190p=0.480 | -0.331p=0.09 | 0.651p=0.002 | -0.244p=0.420 | 0.550p=0.08 | -0.277p=0.437 | -0.899p=0.004 |
Statistically significant positive correlations were found between the degree of Ki-67 expression and in GBM cells for CARB (r=0.455, p=0.016), ETO (r=0.392, p=0.04), ATRX and DOX (r=0.576, p=0.019), TMZ (r=0.586, p=0.017). All these data show that the expression of Ki-67 and ATRX is associated with an increase in the chemotherapy drugs and the development of GBM chemoresistance. Statistically significant negative correlations were also found between the expression levels of GFAP and TMZ values (r=-0.580, p=0.002), DOX (r=-0.584, p=0.01); TF expression and TMZ (r=-0.627, p=0.04) and ETO (r=-0.719, p=0.019). The revealed correlations indicate the involvement of GFAP and TF in increasing the chemosensitivity of GBM cells. Statistically significant negative and positive correlations were found between the expression of TF (r=-0.556, p=0.04) and EGFR (r=0.799, p=0.03), and LL-37 . It indicates the involvement of these proteins in increasing and decreasing the sensitivity of GBM cells to a peptide. A significant positive correlation was found between PG-1 and Ki-67 expression (r=0.651, p=0.002). It shows that the expression of this marker is associated with an increase of PG-1 and the development of resistance to
PG-1 in GBM. There was also a statistically significant negative correlation between PG-1 IC and TF expression (r = -0.899, p = 0.04), indicating the involvement of TF in increasing sensitivity to the peptide in GBMs.
In the next stage, the associations between marker expression and the sensitivity of GBM cells to chemotherapy drugs, LL-37 and PG-1 with the OS of the patients were examined, Figures 1,2. We previously studied the sensitivity of GBM to chemotherapy drugs [15], and in this paper, we found that high DOX IC (13 versus 7.5 months; p=0.0446) and CARB (12 versus 5 months; p=0.0015) are associated with increased patient survival compared to low drug levels. In contrast, patients with high sensitivity to cisplatin (CIS) had more extended life expectancy (LE) than those with low sensitivity (12 vs 7 months, p=0.0293).
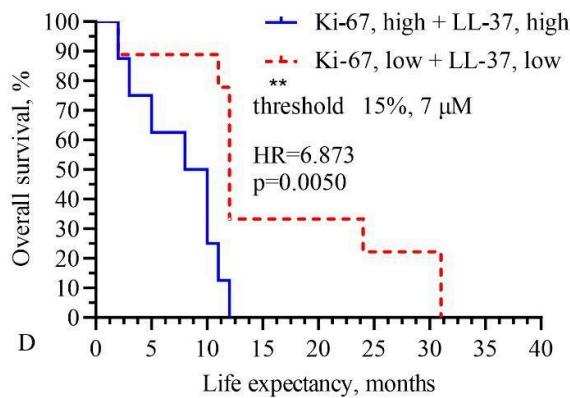
It should be noted that when combining LL-37 and PG-1 IC with the protein expression levels in GBM cells, significant associations between these indicators and the life expectancy of patients were revealed. The graphs in Figures 1A and 1B show that high sensitivity of GBM cells to LL-37 (20%, LE 12 vs 6.5 months, p=0.0037) and high p53 expression (40% vs. 9 months, p=0.0019) are associated with a longer life expectancy for patients. Interestingly, high expression of ATRX (>15%) and low LL-37 IC (\<7 μM) was associated with a more extended lifespan (12 vs. 6.5 months, p=0.0009), as compared to low expression of ATRX and a high value of the peptide, Fig. 1C. In contrast, low sensitivity to GBM cells of LL-37 (>7 μM), and high Ki-67 expression (>15%), were associated with shorter survival time in patients (9 vs. 12 months; p=0.05), Fig. D. Also, lower EGFR expression (\<40%) and lower LL-37 IC were associated with more extended survival time (12 versus 6.6 months, p=0.031), Fig. 1E. The median life expectancy of patients with a low LL-37 IC (less than 7 M) was statistically significantly higher than that of patients with high LL-37 IC (LE 14.0 versus 3 months, p=0.0147), Fig. 1F.
{"image_source":{"path":"images/05363539d71c88da6464e544ceb3838b925de5773ef4dea023e20b0362f95416.jpg"},"content":"","chart_caption":[],"chart_footnote":[]} {"image_source":{"path":"images/386d46b7a5f7f8a7e7fc77bfefee1bb217eb9a6a487854d79554a94f06da5321.jpg"},"content":"","chart_caption":[],"chart_footnote":[]}
{"image_source":{"path":"images/ab325383e083a22cde4eec7520f2232ac738bd1e3551ca2fa60c96c617b800db.jpg"},"content":"","chart_caption":[],"chart_footnote":[]} {"image_source":{"path":"images/b2006357fe8e8fe44bb49c70dd9a4da93696fea2414811d06696fe2ad4e9e001.jpg"},"content":"","chart_caption":[],"chart_footnote":[]}
{"image_source":{"path":"images/0c25fa79a6a3667ebfa301ca4f1fbc2a358d7b9476cb2f19e7a0a1dde97045d9.jpg"},"content":"","chart_caption":[],"chart_footnote":[]} {"image_source":{"path":"images/3072c8eb895fb440f7b4f740904399ff1e1e48afaa10a5122c233718965f0d77.jpg"},"content":"","chart_caption":,"chart_footnote":[]}
High sensitivity of GBM cells to PG-1 (less than 8 M) and high expression of p53 proteins (20%, LE 12 vs. 8 months, p=0.0126), GFAP (40%, LE 24 vs. 10 months, p=0.0042), ATRX (>15%, LE 8 vs. 14 months, p=0.0346), as well as low expression Ki-67 (\<15% LE 8 vs 14 months, p=0.0346) and EGFR (less than 40%, LE 8 vs 12 months, p=0.0124), were associated with increased OS in patients, Fig. 2.
{"image_source":{"path":"images/baabc076a8ca5b352f2e1169aefd887593aa18a2b64b82ec5554ab36787d6ae4.jpg"},"content":"","chart_caption":[],"chart_footnote":[]} {"image_source":{"path":"images/199c9dba720a904d8a8c3f8583135f1cfab7a2faebec31937e22deaa4a730e4b.jpg"},"content":"","chart_caption":[],"chart_footnote":[]}
{"image_source":{"path":"images/79edd6e8b1a92926325a999c76520f6140bd62677260af08dcf6e6bb37c3252d.jpg"},"content":"","chart_caption":[],"chart_footnote":[]} {"image_source":{"path":"images/39566b48916c853ec92f3aec62ebf04bf5fc56ff3a25b8a74018bc721b0d27e7.jpg"},"content":"","chart_caption":[],"chart_footnote":[]}
{"image_source":{"path":"images/22c5429f7696fcce2c7ab4d073a5d9d8a30106856233a372e2502441010ae207.jpg"},"content":"","chart_caption":[],"chart_footnote":[]} {"image_source":{"path":"images/c1960222ccf283b7309d4043eb08193af96e102347993f6df52106db42ad7d2f.jpg"},"content":"","chart_caption":[],"chart_footnote":[]}
Fig. 2: Associations of the combination of PG-1 IC and the expression of: A) p53, B) GFAP, C) ATRX, D) Ki-67, D) EGFR proteins in GBM cells with OS of the patients and E) Associations of PG-1 IC and the OS of the GBM patients. Mantel-Cox test, , *p\<0.05, **p\<0.01 and indicate statistically significant associations of the OS for the GBM patients with the combination of the proteins` expression and PG-1 IC .
Low EGFR expression (less than 40%) and low sensitivity to PG-1 were associated with more extended LE (12 vs. 8 months, p = 0.0124), Fig. 2D. The LE of patients with high sensitivity to
GBM cells for PG-1 (8 M threshold, 14.5 vs. 4 months, p=0.05) was on the verge of a statistical difference, Fig. 2F.
IV. DISCUSSION
The anti-cancer effect of LL-37 has also been established in other cancer models. For example, it was found by Mader J.S. et al that LL-37 induces apoptosis in Jurkat T-cell leukaemia cells as a result of the activation and translocation of mitochondrial AIF factor into the nucleus, where it induces chromatin condensation and DNA fragmentation . This mechanism suggests the involvement of LL-37 in epigenetic modifications of DNA histones . Fan R et al. found that LL-37 has a cytotoxic effect on colorectal cancer HCT116 cells and, in combination with docetaxel, suppresses angiogenesis and increases survival of BALB/c nude mice .
V. CONCLUSIONS
The results of the study indicate a statistically significant correlation between the expression of TF, EGFR and LL-37 IC in GBM cells, as well as the expression of Ki-67 and TF and PG-1 IC , indicating involvement of these marker proteins in modulating sensitivity of GBM to LL-37, PG-1. Associations were found between combinations of p53, GFAP, Ki-67, EGFR, ATRX proteins expression and LL-37, PG-1 IC in GBM cells with OS of patients, which could be used to predict efficacy of chemoimmunotherapy in GBM patients.
Conflict of Interest: The authors declare no conflict of interest.
Funding: It is funded under the state budget theme N° 075-03-025-640 (01/22/2025).
Compliance with Patient Rights and Principles Of Bioethics
Conflict of Interest
The authors declare no conflict of interest.
Ethical Approval
Not applicable
Data Availability
The datasets used in this study are openly available at [repository link] and the source code is available on GitHub at [GitHub link].
Funding
This work did not receive any external funding.
References
Cite this article
Related Research


Special Issue
Launch a focused special issue to highlight research, emerging trends, and expert insights in your academic field.
