


IntelliPaper
Abstract
Traditional Land Use systems play a key role in environmental degradation. Cultural practices involving
agriculture, fuel wood supply and health care delivery thrive under the law of capture. They lack
sustainable production and exploitation process due to constraints posed by land and tree tenure,
population increase and the importance of living biotic resources in the market economy. The solution for a
stable environment under the multiple land use systems in natural ecosystems is not in sight. However,
rural land use practices should emphasize among others public education and conservative principles.
Explore Digital Article Text
I. INTRODUCTION
The current global trend in tropical forest conservation is to bridge gaps in information flow between rural resource users and decision makers. Because natural (biotic) resources are often utilized by governments to address issues arising from food security and foreign exchange earnings. Macro-economic policies have imposed negative impact on environmental conservation yet the rural communities who live by, own and utilize natural resources are also driven by poverty, thus, both the government and rural communities depend on the natural ecosystems for survival.(1,4,7,13,18,24,32)
Traditional land use system is influenced by life styles: the culture of a people in relation to the environment. Because traditional land use systems are shaped by the diversity of natural resources, increasing human population and loss of natural' forests have substantive impact on ecosystem stability. (2,10,15,17,21,27) Lack of information for long term planning has made national policies to ignore resource utilization at the local level. It is argued that for effective management of natural resources, adequate data are required on: (a) level of resource exploitation (flora, fauna and minerals); (b) response of rural communities to changes in life styles; and (c) specialization in use of resources. The study on which this paper is based examines the Impact of rural land use on the natural ecosystems. Specifically, it addresses the following questions: at what level do traditional land use systems degrade the environment? What are the causes of negative approach to environmental degradation in relation to agriculture, healthcare delivery and fuelwood exploitation? (3,6,11,30)
II. TRADITIONAL LAND USE SYSTEMS
In every sphere of life, there are rules and regulations which keep people together to maintain order and security to lives and property. The complexities of rules and regulations determine the level of cultural advancement and hence the life style patterns. The traditional land use system therefore, is a reflection of the lifestyles which are nevertheless influenced by changes in the social and economic well being of the people. The Cultural forms of agricultural production perpetrate subsistence needs of the people. The major practices are in vogue: food and livestock production. Food crops involve shifting cultivation and intensive semi-permanent cultivation in fadamas. The livestock production is nomadic. The two major practices apply fire to clear the natural vegetation particularly in the savanna areas in the production process. (5,9,19,31)
Fadama cultivation is a dry season farming system that thrives in wetlands both in the savanna and rainforest ecosystems. The products are mainly vegetables, early grain crop or in a stabilized stage, the fadamas are used to cultivate crops like sugarcane and other perennial food crops. Shifting cultivation is a system in which relatively short periods of continuous cultivation are followed by relatively long periods of fallow" (8,12,20,22) The system employs simple technology and operates under uncontiguous farm units and inadequate farm labour. land allocation for farming is dictated by the indigenous tenure system and clear felling system of natural vegetation.
Shifting cultivation thrives best under low population density that guarantees sufficient fallow periods; and undeveloped agricultural based industries (Ruthenberg, 1974). Unfortunately, these conditions are absent in the country at moment due to factors of high population density, presence of agro-based industries, high rate of deforestation tor tree crop production (cocoa, rubber, oil palm and forestry plantations) and unequal land tenure systems (23,25,26,28). Under the present conditions, shifting cultivation is still the main source of food supply in Nigeria accounting for about 95% of total food production and employing about 80% of the rural labour.
Livestock production is a major land use practice in the savanna ecosystems. The practice is by small holder and is free-ranged. Rearing of livestock is by nomadic herdsmen and it involves a southwards and a northwards movement of cattle in the dry and raining seasons respectively. The herdsmen face some problems: (a) extensive grazing routes, (b) uncontrolled number of cattle per unit area of land; (c) lack of range conservation practices and (d) rearing of animals beyond traditional land rights of herdsmen. Because of these problems, the sub-sector had experienced mounting deficits which ranged from 122,810 tonnes in beef supply in 1982. to 183,230 tonnes in 1985 (1,3,5,28,29). Over 75% of the Nigerian population depends on traditional health care delivery.
The traditional health care relies heavily on wild biotic resources. Virtually all plant parts from leaf buds to mature leaves, exudates, barks, roots, flowers, nuts, fruits, wood through plant materials in the litter form are used for health care (3,7,15,20,26). However, the traditional health care is administered in three formal levels. These are: (a) preventive; this involves epidemic, rainfall, flood and others; (b) curatives: cure of ailments, diseases of infertility, body pains, warding off bad spirits, snake bites, (c) despoil; to instill sanity into the society such as unfaithfulness in married people (magun), oppression of the poor and deprivation of social rights. (Traditional titles etc). Fuelwood is the main source of domestic energy supply accounting for 90% of total requirements in rural areas. Fuelwood had in the past been gathered by women. Because of the scarcity of fuelwood particularly in the savanna zones of Sokoto, Katsina, Bauchi, Borno, Adamawa and others, the supply of the commodity has been commercialized. At present, fuelwood production is not limited to dead wood: Living trees are cut down and stacked for commercial purposes. This occupation has endangered the diversity of indigenous tree species beyond regeneration levels.
Many wooded savanna ecosystems have degenerated into grass land areas because of excessive felling of trees for fuelwood. (2,8,18,23,29)
III. ENVIRONMENTAL IMPACT OF TRADITIONAL LAND USE SYSTEMS
3.1 Fire on the Environment
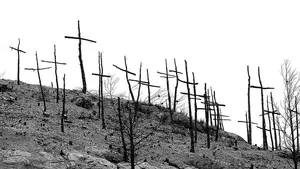
The application of fire on the natural ecosystem serves several purposes. It is used to clear the vegetation for farming, hunting and to stimulate the growth of swards of grass for grazing. The cultural use of fire is indiscriminate, regular and Intensive. The Impact of fire on the ecosystem vary over time and space. The severity of fire depends on the amount of vegetative matter, the dryness of vegetation and the soil and the frequency of fire on a unit area of land. In Nigeria, the use of fire is detrimental to the stability of the natural forests. In the semi-arid areas, frequent fire leads to a breakdown of biomass formation, The impact of Indiscriminate use of fire is a deterioration of the ecological process (4,6,14,22, 25) as given in Table 1.
3.2 Livestock Production
Free ranged livestock depletes the environment in several ways. These include: (a) massive destruction of the environment by Introduced exotic species which did not evolve with the natural environment. In particular, exotic goats, worse than the native ones, are pernicious, create ruinous effect on degraded vegetation and accelerate the destruction of the plant cover (4,16,21,28); (b) Localized grazing lead to trampling of the soils in grazing routes, increased soil compaction, exposed soils and cause soil erosion; (c) overgrazing of the vegetation beyond carrying capacities due to lack of control of animals over a unit area of land. This decreases biomass for both the livestock and native wild animal species; (d) lopping of tree branches by herdsmen to provide fodder reduce total biomass production and energy capture by trees through photosynthesis; (e) loss of native species which provide fodder in evergreen tree species in the semi-arid areas (Balanitesaegyptiaca and Maerua Crassifolia) due to overharvesting and misuse; and (f) use of farm residues by livestock in the dry season deprives the environment from effective circulation of nutrients from vegetative matter and hereby marginalize the soil for vegetative regeneration.
3.3 Food Crop Production
Traditional food crops production degrades the environment through devegetation of actual environment. Over 75% of the total natural vegetation in the country was lost before 1985 due largely to agricultural production (9,11,18,24,28). The causes of agricultural land depletion are: (a) unequal land tenure systems. This creates migrant tenant farmers who mine the soils beyond conservation levels; (b) lack of a third party control on land use under the individual land ownership; (c) economic incentives derived from producing crops for the market (root crops and grains); and (d) a land extensive system of land cultivation under the traditional food crop production. Massive devegetation of the natural ecosystems is harmful to the stability of the environment. For example, it leads to reduction in species diversity and extinction of indigenous species of plants. Habitat loss for wild animals makes them vulnerable to disease organisms and hunting. As in some parts of Borno State, habitat destruction for elephants in their traditional routes for over centuries make them turn up in human settlements and get killed in the process. Again, watershed destruction decrease water levels in streams and thereby endanger the aquatic life.(4,8,11,17,22,28)
3.4 Traditional Health Care
The destructive effects of traditional health care on the environment result from established trade in the sales of herbs and wild animal parts in urban areas throughout the country. The exploitation process of biotic resources is in three tiers.
First, are exploiters of herbs and wild animals from natural forests. Second are middle men who procure these products from exploiters from rural areas. Third are the traders of these products in urban centres.
Aside from these are established herbal homes with prepared drugs for patients. Some of these categories establish herbal gardens to sustain their business. Nevertheless, most raw materials are derived from the natural forests in haphazard ways perhaps because of dominant user rights over trees and land under the tenure systems. Because all parts of wild plants are utilized for traditional medicine most tree species are destroyed by de-barking, up-'rooting removal of leaves or by felling. The impact is massive as many of the species involved hardly coppice or regenerate after harvest. (7,15,24,31)
3.5 Fuelwood Supply
The causal factors for high dependence on fuelwood as domestic energy supply are cultural. Some of these are: (a) poverty among rural and urban dwellers who cannot afford alternative domestic energy sources: kerosene, electricity and liquefied petroleum gas; (b) traditional attachment to firewood usage creating preference for food cooked from wood to other means; (c) social attitudes of the people in ceremonies and festivals promoting open-air preparation for participants; and (d) traditional taboos restricting some rulers and traditional title holder to eat food prepared only with firewood. Because firewood supports about 90% and 50% of rural and urban settlers in domestic energy supply and because 95% of the fuel wood needs is derived from the natural forests, it poses a threat to the stability of the ecosystem. In a recent survey, (4,8,11,20,21,30,) showed that in commercial fuelwood logging sites, 81% and 93% of indigenous trees of 25cm and above at diameter breast height were respectively felled per hectare in the savanna and rainforest ecosystems. In the same study, 52% of the felled trees died and only 10% coppiced in the savanna while in the rainforest 38% of the felled trees died and 16% coppiced. These data therefore, depict that the natural forests in the commercial logging zones are in the state of instability as the diversity index fell from 14.9 to 11.8 in the savanna and from 17.8 to 7.2 in the rainforest respectively before and after felling of timber for fuelwood.
| Ecological Process | Effect |
| Natural Succession | Curtailment of natural succession and erosion evolutionCreation of bare area which facilitates Invasion of weeds and exotic.sppLocal break·down of ecological balance between speciesProgressive reduction In species diversityMigration of wild animals to areas of nutritious plant growth |
| Organic Production and decomposition | Loss of biomassReduced primary production and energy capture due to leaf lossReduced secondary production until new flush of plant growthDivrsion of photosynthate to plant shootsReduction In organic turnover by decomposition |
| Nutrient Circulation | Loss of elements by windblow ash, smoke and volatizationDiminuiton and simplification of nutrient cycleEnhanced loss of elements by surface run-off and leachingReduced retention of nutrient capital in organic maIt.rChanged rate of nitrogen fixation |
| Water Circulation | Reduction in Interpretation of precipitationReduction In transpirationIncrease In surface run offIncrease In water dischargeIncrease in soil moisture and htgher water table |
| Soil Development | Increase in soil erosion with loss of vegetation coverFormation of a base rich soil surface layerIncrease in field soil surface layer affecting microorganisms (e g nitrifers)Death and decomposition of plant rootsIncrease in nutrient by leaching |
| Vegetation Type | Land area (%) | Land area km2 |
| Mangrove forest | 1 | 12,783 |
| Freshwater swamp | 3 | 25,563 |
| Tropical Rainforest | 10 | 95,566 |
| Derived Savanna | 8 | 75,786 |
| Guinea Savanna | 40 | 400,158 |
| Sudan Savanna | 35 | 342,156 |
| Sahel | 3 | 31,453 |
| Vegetation zone | Mean annual Rainfall | Duration of Dry season |
| Sahel | 250 -500mm | 7-8 months |
| Sudan | 500 -1140mm | 5-7 months |
| Northern Guinea Savanna | 1070-1270mm | 5-6 months |
| Southern Guinea Savanna | 1140-1520mm | 4-5 months |
| Derived Savanna | 1140-1770mm | 3-4 months |
| Forest zone | 2780-4000mm | 3 months |
| 1140-1770mm | 3-4 months | |
| 2780-4000mm | 3 months |
| Forest Land Designation | Forest Type | Area (ha) | Gross Volume ( ) |
| Forest Reserve | Lowland Rainforest | 788,053 | 140,682,489.73 |
| Freshwater swamp | 186,621 | 24,397,003.35 | |
| Sub-total | 974,674 | 165,079,493.08 | |
| Free Area | Lowland Rain Forest | 905,930 | 120,7422,644.93 |
| Freshwater swamp | 1,424,995 | 187,474,508.28 | |
| Mangrove Forest | 948,430 | 212,613.14 | |
| Sub Total | 2,342,147 | 308,429,366.35 | |
| Sum total | Gross Total | 3,316,821 | 473,509,259.43 |
3.6 Present status of the forestry sector of Nigeria
A recent forest resources study carried out by the Federal Department of Forestry, revealed that the forest estate of Nigeria has been very highly depleted. It was estimated that only about 974,674 hectares of the forest reserves is productive while another 2,342,147 hectares of free areas is partially productive.
Table 5. High forest gross timber volumes, excluding bark by forest designation and forest types Sawn wood Sawn wood is produced by 11,684,000 m per year in log equivalent (Alviar, sawmills in Nigeria whose capacity is estimated at 1980).
| TYPE | NUMBER | CAPACITY (m3) | PRODUCTION (m3) |
| CDs & Carriages | 1,600 | 5,500,000 | 2,531,000 |
| Portables | 100 | 57,000 | 30,000 |
| Pit Sawing | 1,000 | 285,000 | 150,000 |
| Total | 2,700 | 5,842,000 | 2,711,000 |
3.7 Wildlife conservation
The main problems facing wildlife conservation in Nigeria include poaching, over exploitation, lack of accurate data, bush burning which destroys wildlife habitat especially in the savannah, overgrazing, poor funding of management and research and low managerial capability. The Federal Government has responded with the creation of 8 National Parks distributed across the major ecological zones viz
| Chad Basin | 45,696 1991 |
| Cross River | 422,688 1991 |
| Gashaka/Gumti | 636,300 1991 |
| Kainji Lake | 534,082 1975 |
| Old Oyo | 251,230 1991 |
| Yankari | 224,400 1991 |
| Kamuku | 112,700 1999 |
| Okomu | 11,200 1999 |
| Total | 2,238,296 |
3.8 Demand for Forest Products
Unlike the predictions by most past studies, the demand for most forest wood products have stabilized, except for round wood, fuel wood and saw log and veneer logs. With 95% certainly we are accurate in predicting that the following wood products will stabilize. Demand for some wood products. Source: FDF(1988) Forest Resource Study
| Wood Products | Annual Demand |
| Industrial Round wood (m3) | 7,523,772 |
| Sawn wood (m3) | 2,429,870 |
| Particle board (m3) | 30,948 |
| Paper and Paper Board Imports (M.T.) | 108,451 |
The prospect for wood products in Nigeria is bleak and Nigeria will of necessity become import dependent in respect of wood products. The demand estimate for the current study has been based on simple projection of trends of the form .
Where = Demand for a particular product in year t
Lagged demand a = parameter estimate
A comparison between the current and past demand estimates is presented in Tables 4 and 5. The individual forecasts are close.
t = time
D = change
| STUDIES | 1985 | 1995 | 2000 | 2010 | 2020 |
| FDF (2000) Round wood | 113,602 | 126,887 | 153,458 | 180,008 | |
| Fuel wood | 93,544 | 104,244 | 125,644 | 147,044 | |
| Industrial R/wood | 7,524 | 7,524 | 7,524 | 7,524 | |
| Saw Log/V. log | 598 | 1,073 | 2,118 | 2,973 | |
| Gen. Woods (1994) Fuel wood | 128,495 | 156,634 | |||
| Pulp wood | 135 | 135 | |||
| Saw log | 7,558 | 10,935 | |||
| Veneer logs | 618 | 618 | |||
| IBRD (1992)* Fuel wood | 109,966 | 111,102 | |||
| Poles | 2,874 | 3,441 | |||
| Pulp wood | 539 | 959 | |||
| Saw log | 4,199 | 6,432 | |||
| Veneer log | 858 | 1,359 | |||
| Round wood equivalent |
| STUDIES | 1985 | 1995 | 2000 | 2010 | 2020 |
| FDF (2000)Sawn wood ( ) | 2,430 | 2,430 | 2,430 | 2,430 | |
| Particle Board ( ) | 31 | 31 | 31 | 31 | |
| Paper & Paper bd. Imputs(M.T.) | 108 | 108 | 108 | 108 | |
| IBRD (1992)Sawn wood ( ) | 4,199 | 6,432 | |||
| Plywood ( ) | 286 | 453 | |||
| Particle board ( ) | 111 | 230 | |||
| Newsprint (M.T.) | 93 | 166 | |||
| Printing & Writing paper(M.T.) | 11 | 21 | |||
| Other paper & Paper board(M.T.) | 50 | 87 |
Past studies indicate that demand for wood products will continue to increase as opposed to the current study which predicts a stable demand.
IV. ANTICIPATED CHANGES IN THE FORESTRY SECTOR TO YEAR 2020
4.1 Land Use Dynamics
An analysis of land use in Nigeria shows the annual changes as indicated in Table 6.
| Land use category | Annual Rate of Change (ha/year) |
| Agriculture (Intensive/ Extensive) | 554,657.10 |
| Floodplain Agriculture | 67,616.10 |
| Grass land | 131,224.60 |
| Dominantly trees/woodlands/shrubs | -858,720.40 |
| Dominantly shrubs and grasses | -104,974.30 |
| Dominantly grasses | 6166.16 |
| Forest | -104,231.00 |
| Freshwater marsh/swamp | -69,453.05 |
| Forested freshwater swamp | 1707.86 |
| Mangrove forest | -14,982.77 |
| Water | 45,474.02 |
| Bare surface | 129,113.70 |
Agricultural cropland is consuming the largest chunk of 554,657.10 ha annually while dominant category of trees/woodlands and shrubs is loosing the largest chunk of 858,720.40 ha annually.
| Land use category | Base Year 1995 | Year 2010 | Year 2020 | Steady State |
| Agric.Crop land | 61,900,000 | 68,063,519.12 | 70,652,157.4 | 87,408,772.80 |
| Flood plain Agriculture | 2,400,000 | 3,141,000.30 | 3,390,061.50 | 479,782.74 |
| Grassland | 3,150,000 | 4,398,237.70 | 4,765,522.33 | 1,071,156.36 |
| Dominantly trees/wood land and shrub | 9,000,000 | 3,866,595.70 | 2,276,169.60 | 7309.53 |
| Dominant shrubs & grass | 7,100,000 | 4,290,518.19 | 3,017,151.27 | 102,582.79 |
| Dominantly grasses | 1,100,000 | 1,065,057.36 | 1,040,003.02 | 227,529.66 |
| Forest | 2,650,000 | 1,436,848.03 | 938,066.41 | 928.69 |
| Freshwater mash/swamp | 620,000 | 181,072.05 | 100,943.30 | 3534.37 |
| Forested freshwater Swamp | 1,800,000 | 1,820,088.57 | 1,834,929.55 | 3,134,485.64 |
| Mangrove forest | 1,190,000 | 978,706.18 | 845,074.30 | 701.26 |
| Water | 680,000 | 1,065,985.97 | 1,144,629.79 | 172,307.77 |
| Bare surface | 1,892,000 | 3,174,370.71 | 3,477,292.00 | 872,908.43 |
| Total | 93,482,000 | 93,482,000.00 | 93,482,000 | 93,482.000 |
The consequences of the present land use trend on forestry development need no further elaboration. It will be catastrophic to say the least unless urgent steps are taken to reverse the situation.
4.2 Game Reserves
The following are some of the existing game reserves.
Falgore Game Reserves, Akpaka Game Reserves, Lame-burra Game Reserves, Kwaiambana Game Reserves Dagidda Game Reserves, Ibi Game Reserves, Pai River Game Reserves, Ankwe Game Reserves, Wase Game Santurary, Wase Rock Game Reserves Bakono Game Reserves.
4.3 National Parks
At present there are eight National Parks, they all derive their origins from previous Game Reserves. These are: Kainji Lake National Park, Yankari National Park, Old Oyo National Park, Cross River National Park, Chad Basin National Park, Gashaka Gumti National Park, Okomu National Park, Kamuku National Park.
| Geo-political zones | Total land Areas (sq.km) | Area of Reserves Forest (sq.km) | % of land Area Reserved as Forest | |
| 1 | North-West | 205,096.03 | 31,190.19 | 15.21% |
| 2 | North East | 278,148.03 | 18215.36 | 6.55% |
| 3 | North Central | 234,754.96 | 24,084.95 | 10.26% |
| 4 | South West | 77,656.44 | 12,958.77 | 16.69% |
| 5 | South East | 28,612.55 | 446.31 | 1.63% |
| 6 | South South | 83.784.50 | 13,075.94 | 15.61% |
| Nigeria | 90,055.61 | 99,991.92 | 10.992% |
As a result of high population density in the South East zone, ithas the smallest areas of reserved forest. Other forest reserves are listed below viz: Olokemeji forest reserves, Gambari forest reserves, Omo forest reserves, Akure/Ofosu forest reserves, Idanre forest reserves, Ifon/Owo forest reserves, Eba forest reserves, Ofogbo forest reserves, Obiaruku forest reserves, Ngel-Nyaki forest reserves, Afi River Forest Reserve, forest reserves, Ibadan, Kagoro-Nindam forest reserves, Donga River Basin forest reserves, Upper Orashi forest reserves, Biseni forest reserves, Akassa forest reserves.
V. CONCLUSION
The traditional land use supporting domestic and commercial requirements for food, livestock and fuelwood sustain the rural and national economy but at great risks to the natural environment. The solution for a stable natural ecosystem is not at sight because the control and management of the factors responsible for environmental degradation are difficult to put in place. It is suggested that government should maximize opportunities of global concern for tropical rainforest conservation to raise funds for resource sustenance through public education and productive program.
3. Environmental law and land use in nigeria. (2015) https://www.linkedin.com/.../environmental-law-land-use-nigeria-prof-prosper-ayawei
4. National Policy On Environment - nesrea (2017) www.nesrea.gov.ng/wp-content/uploads/2017/.../National-Policy-on-Environment.pdf
6. The Devastating Effects of Environmental Degradation (2007) https://www.fig.net/resources/proceedings/fig.../papers/.../ts01d_etuonovbe_3386.pdf
Environ Angela K. Etuonovbe. (2009) Government and Land Use Planning. The Devastating Effects of Environmental Degradation - A Case Study of the Niger Delta Region of Nigeria. FIG Working Week 2009. Surveyors Key Role in Accelerated Development. Eilat
S Chakravarty (2012) Deforestation: Causes, Effects and Control Strategies https://cdn.intechopen.com/.../InTechDeforestation_causes_effects_and_control_strate...
9. CS Ezeonu (2012) Biotechnological Tools for Environmental Sustainability: Prospects. https://www.hindawi.com/journals/btri/2012/450802/
Conflict of Interest
The authors declare no conflict of interest.
Ethical Approval
Not applicable
Data Availability
The datasets used in this study are openly available at [repository link] and the source code is available on GitHub at [GitHub link].
Funding
This work did not receive any external funding.
References
Cite this article
Related Research

Special Issue
Launch a focused special issue to highlight research, emerging trends, and expert insights in your academic field.