





IntelliPaper
Abstract
The paper presented considers the ordering method of outcome set for multi-stage testing (MST) of 1-2-3-4 model. The ordering method of outcome set is used for the estimation of results of computerized adaptive testing (CAT). This method is not tied to a specific testing procedure.
Acknowledgment of this is its usage for the 1-2-3-4 model, which is described in the paper. To sort the set of testing outcomes, the function-criteria described in the initial article are used here and a comparative analysis of obtained results is performed. The ordered outcome set is estimated by a hundred-point system according to the normal distribution.
Applied results of our scientific research is developed as “Adaptester” portal andavailable on the following address: ttps://adaptester.com
Explore Digital Article Text
I. INTRODUCTION
Computerized adaptive testing implies the test adaptation to the level of knowledge of the test. During the testing process the system analyzes the answers and uses them to choose each following question based on the best correspondence to the level of examinee so that the questions gradually become complicated for a well-prepared examinee and simpler for a poorly prepared person. The process of test adaptation for an individual user is mentioned.
This means that the tests must be pre-calibrated according to their level of difficulty.
The modern computerized adaptive testing (CAT) is based on item response theory (IRT). IRT is a family of mathematical models that describe how people interact with test items (Embretson & Reise, 2000). According to this theory test items are described by their characteristics of difficulty and discrimination. Discrimination is independent of difficulty and shows how the probability of a positive response is distributed between different levels of examination. In addition, they can have a so-called “pseudo-guessing” parameter that reflects the probability that an examinee with a very low trait level will correctly answer an item solely by guessing (Baker, 2001).
The combination of these three parameters allows us to evaluate the knowledge of an examinee via the Maximum Likelihood Estimation (MLE) method. The MLE method is much more flexible than the so-called “The Number Correct” assessment, which implies the number of correct answers from the questions asked (perhaps, considering question weight). For example, number-correct scoring of a 10-item conventional test can result in at most 11 scores (0 to 10); MLE for the same test can result in . MLE also provides an individualized standard error of measurement (SEM) for each examinee.
Despite the above and other advantages, the MLE method requires extensive preliminary work to determine with appropriate accuracy the difficulty, discrimination, and guessing parameter for each issue of the test. The most common method of determining these parameters is the preliminary testing. To get real results via the preliminary testing, it is necessary to examine hundreds and thousands of users, which is not easy.
In general, to obtain the advantages of the Item Response Theory (IRT), the tests should be designed, constructed, analyzed and interpreted within the framework of the given theory. Particularly, IRT implies that the ability of the particular examinee is known in advance, and based on these data, the parameters of the characteristic curve of items (difficulty, discrimination, guessing parameter) are determined (Baker, 2001).
In the considered model a set of items of the test is divided into several parts, depending on complexity. Subsequently, there is no other information available about the items on a test. In other words, the difficulty, discrimination and parameter of guessing for each item separately are not available. The model under discussion does not present the preliminary estimate parameter of an examinee's abilities. True, the lack of information decreases the accuracy of the result, but the big advantage of a simple model is that its practical application is easy.
We will try to create a test assessment system that makes it easy for the test creator to use a computer-adaptive method for creating one's own test. For this purpose, let us not discuss IRT but another traditional approach to testing—Stradaptive Testing. The term “Stradaptive” is derived from the “Stratified Adaptive”, and it belongs to D. J. Weiss (Betz & Weiss, 1973; Betz & Weiss, 1974).
Stradaptive testing considers different strategies of the leveling, which were fundamentally discussed and studied earlier. These strategies are:
-
Two-stage approach (Betz & Weiss, 1973; Betz & Weiss, 1974; Larkin & Weiss, 1975);
-
Multi-Stage Approach:
-
Fixed Branching Models:
-
Pyramidal Strategy (Larkin & Weiss, 1975);
-
Flexilevel (Lord, 1970; Betz & Weiss, 1975; Pyper, Lilley, Wernick, Jefferies, 2014);
-
Stradaptive Testing (Weiss 1973; Weiss, 1974; Waters, 1977);
-
Variable Branching Models:
-
Bayesian (Weiss, 1974; McBridge & Weiss, 1976);
-
Maximum likelihood approach (Weiss, 1974).
In the given paper we consider multistage testing.
II. MULTISTAGE ADAPTIVE TESTING
“Recently, multistage testing (MST) has been adopted by several important large-scale testing programs and become popular among practitioners and researchers” (Zheng & Chang, 2015, p. 104).
“MST is a balanced compromise between linear test forms (i.e., paper-and-pencil testing and computer-based testing) and traditional item-level computer-adaptive testing (CAT)” (Zheng, Nozawa, Gao & Chang, 2012, p. ii).
The multistage adaptive test represents a structured adaptive test, which uses pre-designed subtests as the main unit of testing control.
“In contrast to item-level CAT designs, which result in different test forms for each test taker, MST designs use a modularized configuration of pre-designed subtests and embedded score-routing schemes to prepackage validated test forms” (Melican, Breithaupt & Zhang, 2010, p. 171).
The “stage” in multistage testing is an administrative division of the test that facilitates the adapting of the test to the examinee. Each examinee is administered modules for a minimum of two stages, where the exact number of stages is a test design decision affected by the extent of desired content coverage and measurement precision. In each stage, an examinee receives a module that is targeted in difficulty at the examinee’s provisional ability estimated, computed from the latter’s performance on modules administered during the previous stage(s). Within a stage, there are typically two or more modules that vary from one another based on average difficulty. Because the modules vary this way, the particular sequence of item sets that any examinee is presented with is adaptively chosen based on the examinee’s temporary assessment. After an examinee finishes each item set, his or her ability estimate is updated to reflect the new measurement information obtained about his ability. The next module is chosen to provide an optimal level of measurement information for a person at that computed proficiency level. High-performing examinees receive modules of higher average difficulty, while less able examinees are presented with modules that are comparatively easier (Zenisky, Hambleton & Luecht, 2010).
Thus, traditional CAT selects items for a test adaptively, while a multistage testing (MST) is an analogous approach that uses sets of items (modules, testlets) as the “building blocks” for a test. In MST terminology, these sets of items have come to be termed modules (Luecht & Nungester, 1998; Crotts, Sireci & Zenisky, 2012; Kim & Moses, 2014) or testlets (Wainer & Kiely, 1987; Wang, Bradlow & Wainer, 2002) and can be characterized as short versions of linear test forms where some specified number of individual items are administered together to meet particular test specifications and provide a certain proportion of the total test information.
III. ORDERING METHOD OF OUTCOME SET
The initial article Razmadze et al. (2017) considers an original method of CAT result estimation for multistage testing strategy.
In contrast to the classical item response theory (IRT) concepts (Embretson & Reise, 2000; Van der Linden & Hambleton, 1997; Baker, 2001), Rasch's model (Rasch, 1960/1980) or non-IRT (i.e. the Measurement Decision Theory) of CAT (Rudner, 2009), the model under discussion, does not present the preliminary estimate parameter of an examinee's abilities and the items of the same level have the same difficulty.
The method considers all possible variants of results, which is named an outcome set. The outcome set represents a non-typical unity of different dimensional elements. At Razmadze et al. (2017), article comparison criteria for these elements are defined, and principles of ordering of the set are described. The article shows how to receive the final score after ordering the outcome set. The ordered criteria of outcomes set may not be singular; this is confirmed by a comparative review of two examples presented in this work.
In multistage testing, to build a panel using modules, an author of a test uses a linear programming or heuristic methods. Apart from this, Fisher's Maximum Information Method is used for obtaining the classification cut-points for the optimization of the information of a module (Zheng et al., 2012). All the methods mentioned above requires specific knowledge. Our model does not have such limitations for a test author because such specific work is performed by an “automatic system of testing” compiler, while the author of a test has only to divide the testing items into several levels according to difficulty. This procedure should not be complicated because we assume that the author of this test is a professional in the field for which the appropriate test is created.
To express the ordering method of outcomes set, a specific procedure for testing is used in Razmadze et al.'s (2017) article. This procedure has an illustrative purpose for the evaluation method. The method described can be used for other similar strategies as well as for multistage testing, one of the models was discussed in the article „The Set Ordering Method for Scoring the Outcomes of 1-2-4 Multistage Model of Computerized Adaptive Testing“ (Razmadze, 2019).
The current article discusses similar model, although unlike the three-stage 1-2-4 model, described in previous paper, there is the four-stage 1-2-3-4 model.
Thus, the paper presented is devoted to the realization of an ordering method of the outcome set, in particular on the example of a four-stage 1-2-3-4 model.
4.1 The scheme of 1-2-3-4 model
Now let us consider the usage of the ordering of testing result scores in case of multistage adaptive testing. For this purpose, we will discuss the four-stage 1-2-3-4 model, which is presented in the following scheme (Zheng et al., 2012):
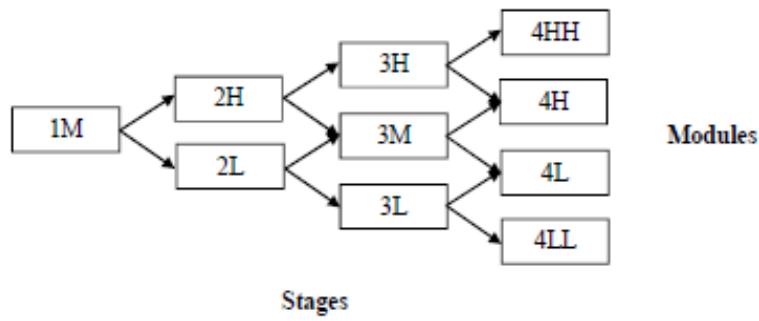
Figure 1: The 1-2-3-4 MST model
The number indicated in the rectangle of the module corresponds to the stage; the letters correspond to comparative difficulty (H: high; M: medium; L: low; HH: higher than H; LL: lower than L). Let us number the medium difficulties of modules. Each of these numbers can be considered as the weight of a corresponding module item:
Table 1: Comparative difficulty
| Difficulty | LL | L | M | H | HH |
| Weight | 1 | 2 | 3 | 4 | 5 |
In this case comparative difficulties are numbered although it is possible to assign different weights for modules at different stages with the same comparative difficulties:
Table 2: The item weights of the four-stage 1-2-3-4 model
| # | 1 | 2 | 3 | 4 | 5 | 6 | 7 | 8 | 9 | 10 |
| Difficulty | 4LL | 3L | 4L | 2L | 1M | 3M | 2H | 4H | 3H | 4HH |
| Weight | 1 | 2 | 3 | 3 | 4 | 4 | 5 | 5 | 6 | 7 |
The displayed classification can be considered as an analogy to the one used in the item response theory (IRT) (-3; 3) range, where the examinees' abilities are measured (Baker, 2001). But in this case instead of (-3; 3) range we use the weights provided in Table 2. This does not distort the achievement of the initial task. By considering the weights, the scheme from Figure 1 will transform into the following:
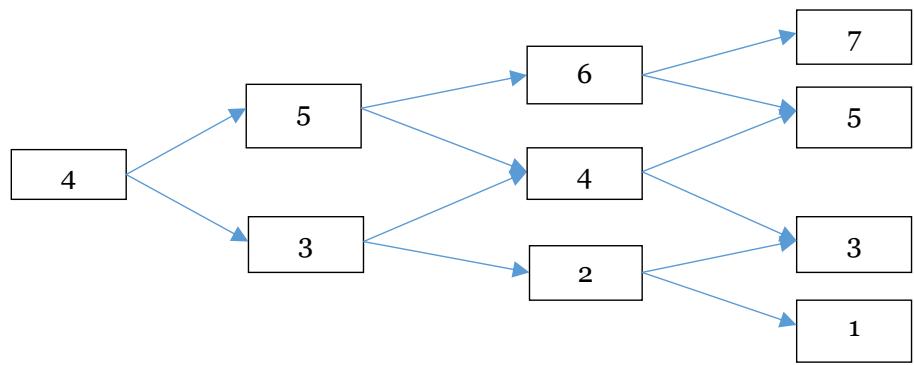
Figure 2: The 1-2-3-4 MST model with weights
4.2 Outcome of 1-2-3-4 model
In the first row of Table 2, all modules are numbered from 1 to 10. We will be using the given numbering for defining the test outcome. Taking into account the complexity levels of the modules, the outcome is expressed as a ten-dimensional vector: , where represents the number of correct answers of module, . Due to the fact each testee performs only one item on each stage, there can be only 4 components out of a given 10 that are different from 0 in each test outcome. In addition, each component, , has a weight, predefined according to Table 2.
In Razmadze et al.'s (2017, p. 1656) article, the outcome was defined as a vector drawn from the corresponding numbers of the levels of items obtained during the testing process. In this case, by definition, the outcome vector consists of the components that correspond to the number of correct answers in each module. This is more convenient for using the set ordering method for multistage adaptive tests.
Let us look at how many items there are per module. According to the module given by Zheng et al. (2012), the examinee is given 21 items that can be distributed among the stages differently:
Table 3: Amount of items according to stages
| 1-2-3-4 model | ||||
| Stage 1 | Stage 2 | Stage 3 | Stage 4 | |
| Model condition A | 6 | 5 | 5 | 5 |
| Model condition B | 7 | 6 | 4 | 4 |
| Model condition C | 4 | 6 | 6 | 5 |
| Model condition D | 4 | 4 | 6 | 7 |
Let us choose one of the model conditions, for example, model condition C. In only 4 components are able to obtain whole values different from 0 within the ranges [0–4], [0–6], [0–6] and [0–5]. These components may have 5, 7, 7 and 6 different answers, respectively; other components are always zero. The total amount of outcomes would be N = .
4.3 Outcome route
Modules of the first, second and third stages have classification cut-points that define the route of the testing outcome; in other words, choosing the second, third and fourth stage modules. Classification cut-point is the amount of correct answers within the module that defines the branching — next stage module. Despite where the classification cut-points are chosen, the total amount of the testing outcomes is constant and N = 1470.
An example discussed in this article on the first stage of 1M module cut-point equals to 2. This means that in case of less than 2 correct answers (0 or 1) an examinee will be given the easier 2L module of the second stage, and in case of two or more correct answers (2, 3 or 4) the more difficult 2H module of the second stage.
In the second stage 2L module cut-point is 3, in 2H module it is 4. This means:
-
In 2L module, if the number of correct answers is less than 3 (0, 1 or 2), an examinee will be provided with the stage easy 3L module and in case of 3 or more correct answers (3, 4, 5 or 6) - the stage medium 3M module items;
-
In 2H module if the number of correct answers are less than 4 (0, 1, 2, or 3), an examinee will be provided with the stage medium 3M module and for more than 4 correct answers (4, 5, or 6) - the stage difficult 3H module items;
On the stage modules 3L and 3M, the cut-point is 3 and for 3H it is 4. This means the following:
-
In 3L module if the number of correct answers is less than 3 (0, 1 or 2) an examinee will be provided with the stage easiest 4LL module and in case of 3 or more correct answers (3, 4, 5, or 6) the stage easy 4L module items;
-
In 3M module if the number of correct answers is less than 3 (0, 1, or 2) an examinee will be provided with the stage easy 4L module and in case of 3 or more correct answers (3, 4, 5, or 6) the stage difficult 4H module items;
-
In 3H module if the number of correct answers is less than 4 (0, 1, 2, or 3) an examinee will be provided with the stage difficult 4H module and in case of 4 or more correct answer (4, 5, or 6) the stage most difficult module 4HH items.
V. THE SET ORDERING METHOD FOR SCORING THE OUTCOMES OF THE 1-2-3-4 MODEL
5.1 Ordering according to the S(n) criterion
Let us discuss the first criterion from the initial article Razmadze et al. (2017, p. 1658, Formula (4)):
where R is a weighted sum of scores of correct answers and M is a weighted sum of scores of incorrect answers.
The corresponding formulas for calculating R and M are given in the article Razmadze et al. (2017, p. 1657, Formulas (1) and (2)). Based on these formulas, in case of the 1-2-3-4 MST model, we will obtain the following:
where is a number of mistakes in i module, .
The Formula (1), which should be used for outcome estimation, is now used in the ten-module case. The structure of outcome set of the four-stage model discussed in this article is different from the one discussed in the initial article by Razmadze et al. (2017, p. 1656). This means that the domain of a function S(n) is different. Despite this, S(n) function will provide a complete ordering of set N in the given case too.
The result is provided in Table 4, where , , , , , , , , , values are given in the columns B, C, D, E, F, G, H, I, J, K, respectively. The values calculated using Formula (1) are shown in column P. The data is sorted according to P column decreasing order. The table shows the first 10 (left half) and last 10 (right half) testing outcomes' estimation results.
Table 4: 1-2-3-4 Model's Outcome Estimation by S (n) Criterion
| B | C | D | E | F | G | H | I | J | K | P | |
| 1 | 4LL | 3L | 4L | 2L | 1M | 3M | 2H | 4H | 3H | 4HH | S(n) |
| 2 | C1 | C2 | C3 | C4 | C5 | C6 | C7 | C8 | C9 | C10 | (4) |
| 3 | 4 | 6 | 6 | 5 | 117.00 | ||||||
| 4 | 4 | 6 | 6 | 4 | 55.00 | ||||||
| 5 | 4 | 6 | 5 | 5 | 37.00 | ||||||
| 6 | 4 | 6 | 6 | 3 | 34.33 | ||||||
| 7 | 4 | 5 | 6 | 5 | 28.00 | ||||||
| 8 | 4 | 6 | 5 | 4 | 26.00 | ||||||
| 9 | 4 | 6 | 6 | 2 | 24.00 | ||||||
| 10 | 3 | 6 | 6 | 5 | 22.60 | ||||||
| 11 | 4 | 6 | 4 | 5 | 21.00 | ||||||
| 12 | 4 | 5 | 6 | 4 | 21.00 |
| B | C | D | E | F | G | H | I | J | K | P | |
| 1 | 4LL | 3L | 4L | 2L | 1M | 3M | 2H | 4H | 3H | 4HH | S(n) |
| 2 | C1 | C2 | C3 | C4 | C5 | C6 | C7 | C8 | C9 | C10 | (4) |
| ↓ | |||||||||||
| 1463 | 1 | 0 | 1 | 0 | 0.04 | ||||||
| 1464 | 0 | 2 | 0 | 0 | 0.04 | ||||||
| 1465 | 0 | 0 | 0 | 1 | 0.04 | ||||||
| 1466 | 3 | 0 | 0 | 0 | 0.03 | ||||||
| 1467 | 1 | 1 | 0 | 0 | 0.03 | ||||||
| 1468 | 0 | 0 | 1 | 0 | 0.03 | ||||||
| 1469 | 2 | 0 | 0 | 0 | 0.02 | ||||||
| 1470 | 0 | 1 | 0 | 0 | 0.02 | ||||||
| 1471 | 1 | 0 | 0 | 0 | 0.01 | ||||||
| 1472 | 0 | 0 | 0 | 0 | 0.00 |
Let us discuss the second criterion from the initial article Razmadze et al. (2017, p. 1658, Formula (9)):
where R is a weighted sum of scores of correct answers, A is an average complexity of incorrect answers and - the number of mistakes.
The corresponding formulas for calculating R and A are given in the initial article by
Razmadze et al. (2017, p. 1657, Formulas (1) and (3)). Based on these formulas, in the case of the 1-2-3-4 MST model, we will obtain the following:
where – is a number of mistakes in i module, .
The Formula (2), which should be used for outcome estimation, is now used in the ten-module case. The structure of the outcome set of the four-stage model discussed in this article is different from the one discussed in the initial article by Razmadze et al. (2017, p. 1656). This means that the domain of a function is different. Although it is easy to check that despite this, function will provide a complete ordering of set N in the given case too.
The results obtained by using criterion are shown in Table 5, where , , , , , , , , , values are given in the columns B, C, D, E, F, G, H, I, J, K, respectively. The values calculated using Formula (2) are shown in column Q. The data is sorted according to Q Column decreasing order. Table 5 shows the first 10 (left half) and the last 10 (right half) testing outcomes' estimation results.
Table 5: 1-2-3-4 Model's outcome estimation by F(n) criterion
| B | C | D | E | F | G | H | I | J | K | Q | |
| 1 | 4LL | 3L | 4L | 2L | 1M | 3M | 2H | 4H | 3H | 4HH | F(n) |
| 2 | C1 | C2 | C3 | C4 | C5 | C6 | C7 | C8 | C9 | C10 | (9) |
| 3 | 4 | 6 | 6 | 5 | 819.00 | ||||||
| 4 | 4 | 6 | 6 | 4 | 770.00 | ||||||
| 5 | 4 | 6 | 5 | 5 | 666.00 | ||||||
| 6 | 4 | 5 | 6 | 5 | 560.00 | ||||||
| 7 | 3 | 6 | 6 | 5 | 452.00 | ||||||
| 8 | 4 | 6 | 6 | 3 | 360.50 | ||||||
| 9 | 4 | 6 | 5 | 4 | 338.00 | ||||||
| 10 | 4 | 6 | 4 | 5 | 315.00 | ||||||
| 11 | 4 | 5 | 6 | 4 | 315.00 | ||||||
| 12 | 4 | 5 | 5 | 5 | 291.50 |
| B | C | D | E | F | G | H | I | J | K | Q | |
| 1 | 4LL | 3L | 4L | 2L | 1M | 3M | 2H | 4H | 3H | 4HH | F(n) |
| 2 | C1 | C2 | C3 | C4 | C5 | C6 | C7 | C8 | C9 | C10 | (9) |
| $\downarrow$ | $\downarrow$ | $\downarrow$ | $\downarrow$ | $\downarrow$ | $\downarrow$ | $\downarrow$ | $\downarrow$ | $\downarrow$ | $\downarrow$ | $\downarrow$ | |
| 1463 | 1 | 0 | 1 | 0 | 0.52 | ||||||
| 1464 | 0 | 2 | 0 | 0 | 0.52 | ||||||
| 1465 | 0 | 0 | 0 | 1 | 0.47 | ||||||
| 1466 | 3 | 0 | 0 | 0 | 0.44 | ||||||
| 1467 | 1 | 1 | 0 | 0 | 0.40 | ||||||
| 1468 | 0 | 0 | 1 | 0 | 0.36 | ||||||
| 1469 | 2 | 0 | 0 | 0 | 0.27 | ||||||
| 1470 | 0 | 1 | 0 | 0 | 0.25 | ||||||
| 1471 | 1 | 0 | 0 | 0 | 0.13 | ||||||
| 1472 | 0 | 0 | 0 | 0 | 0.00 |
Comparative analysis of Tables 4 and 5 shows different sequences of outcome sets after ordering them. Thus, the creator of an automatized system of testing can choose the needed criterion on one's own. Furthermore, he can create a new, different criteria, which could be better suited to one's own requirements and assessments.
5.3 The final score of outcome
Now let us transform the points obtained in Tables 4 and 5 into integer numbers [0; 100] segment. While ordering the data obtained by the first and the second criteria in Razmadze et al.'s (2017, pp. 1659, 1660) article, the point correction was performed. In case of the first criterion, the first 90 points, and in case of the second criterion, the first 30 points. This felt somewhat artificial.
Now let us act differently. The criteriaand, used in Tables 4 and 5, have fulfilled their mission and ordered the set of testing outcomes N. The resulting points do not have essential importance. They can be substituted by any decreasing sequence of 1470 numbers. The decreasing order ensures to keep the ordering of the testing outcomes so that the better testing result corresponds to the higher point.
It will be natural if we distribute the scores within the whole number segment [0; 100] using the normal distribution:
Table 6 illustrates the testing outcome scores with normal distribution for 1-2-3-4 MST model ordered by criterion, where ; . The table shows the first 25 and the last 25 testing outcomes' scores.
The fact of the point and times of usage is visible from the following graph (Fig. 4): Table 6: Testing outcomes for 1-2-3-4 MST model scores with a normal distribution
| B | C | D | E | F | G | H | I | J | K | W | |
| 1 | 4LL | 3L | 4L | 2L | 1M | 3M | 2H | 4H | 3H | 4HH | F(n) |
| 2 | C1 | C2 | C3 | C4 | C5 | C6 | C7 | C8 | C9 | C10 | Normal |
| 3 | 4 | 6 | 6 | 5 | 100 | ||||||
| 4 | 4 | 6 | 6 | 4 | 100 | ||||||
| 5 | 4 | 6 | 5 | 5 | 100 | ||||||
| 6 | 4 | 5 | 6 | 5 | 100 | ||||||
| 7 | 3 | 6 | 6 | 5 | 100 | ||||||
| 8 | 4 | 6 | 6 | 3 | 100 | ||||||
| 9 | 4 | 6 | 5 | 4 | 100 | ||||||
| 10 | 4 | 6 | 4 | 5 | 100 | ||||||
| 11 | 4 | 5 | 6 | 4 | 100 | ||||||
| 12 | 4 | 5 | 5 | 5 | 100 | ||||||
| 13 | 3 | 6 | 6 | 4 | 99 | ||||||
| 14 | 4 | 4 | 6 | 5 | 99 | ||||||
| 15 | 3 | 6 | 5 | 5 | 99 | ||||||
| 16 | 3 | 5 | 6 | 5 | 99 | ||||||
| 17 | 4 | 6 | 6 | 2 | 99 | ||||||
| 18 | 2 | 6 | 6 | 5 | 99 | ||||||
| 19 | 4 | 6 | 5 | 3 | 99 | ||||||
| 20 | 4 | 6 | 4 | 4 | 99 | ||||||
| 21 | 4 | 5 | 6 | 3 | 99 | ||||||
| 22 | 4 | 5 | 5 | 4 | 99 | ||||||
| 23 | 3 | 6 | 6 | 3 | 98 | ||||||
| 24 | 4 | 5 | 4 | 5 | 98 | ||||||
| 25 | 4 | 4 | 6 | 4 | 98 | ||||||
| 26 | 3 | 6 | 5 | 4 | 98 | ||||||
| 27 | 4 | 4 | 5 | 5 | 98 |
The whole table graphically looks as follows (Fig. 3):
| B | C | D | E | F | G | H | I | J | K | W | |
| 1 | 4LL | 3L | 4L | 2L | 1M | 3M | 2H | 4H | 3H | 4HH | F(n) |
| 2 | C1 | C2 | C3 | C4 | C5 | C6 | C7 | C8 | C9 | C10 | Normal |
| 1448 | 3 | 0 | 1 | 0 | 9 | ||||||
| 1449 | 2 | 2 | 0 | 0 | 9 | ||||||
| 1450 | 5 | 0 | 0 | 0 | 9 | ||||||
| 1451 | 0 | 0 | 1 | 1 | 8 | ||||||
| 1452 | 2 | 0 | 0 | 1 | 8 | ||||||
| 1453 | 1 | 1 | 1 | 0 | 8 | ||||||
| 1454 | 3 | 1 | 0 | 0 | 7 | ||||||
| 1455 | 0 | 1 | 0 | 1 | 7 | ||||||
| 1456 | 0 | 0 | 2 | 0 | 7 | ||||||
| 1457 | 2 | 0 | 1 | 0 | 6 | ||||||
| 1458 | 1 | 2 | 0 | 0 | 6 | ||||||
| 1459 | 4 | 0 | 0 | 0 | 6 | ||||||
| 1460 | 1 | 0 | 0 | 1 | 5 | ||||||
| 1461 | 0 | 1 | 1 | 0 | 5 | ||||||
| 1462 | 2 | 1 | 0 | 0 | 5 | ||||||
| 1463 | 1 | 0 | 1 | 0 | 4 | ||||||
| 1464 | 0 | 2 | 0 | 0 | 4 | ||||||
| 1465 | 0 | 0 | 0 | 1 | 3 | ||||||
| 1466 | 3 | 0 | 0 | 0 | 3 | ||||||
| 1467 | 1 | 1 | 0 | 0 | 2 | ||||||
| 1468 | 0 | 0 | 1 | 0 | 2 | ||||||
| 1469 | 2 | 0 | 0 | 0 | 1 | ||||||
| 1470 | 0 | 1 | 0 | 0 | 1 | ||||||
| 1471 | 1 | 0 | 0 | 0 | 0 | ||||||
| 1472 | 0 | 0 | 0 | 0 | 0 |
{"image_source":{"path":"images/af4ebbc2bac834d70ecdcd43f2068817dfbdacf70574741232c81b1e075477b0.jpg"},"content":"","chart_caption":[{"type":"text","content":"Figure 3: Graph of 1-2-3-4 MST model testing outcomes' score's normal distribution"}],"chart_footnote":[]}
{"image_source":{"path":"images/44c2e225e61b21cd82502f054a53eabfe11ad1b64faba1b3d1ed761d15dea2c0.jpg"},"content":"","chart_caption":[{"type":"text","content":"Figure 4: Normal distribution of the testing outcome points"}],"chart_footnote":[]}
VI. CONCLUSION
The ordering method of the outcome set can be used in case of different testing procedures. The obvious example of this is the realization of the method for multistage adaptive testing's (MST) 1-2-3-4 model, which is described in the presented paper.
The author of a test has no direct contact with this method and its specific nuances because the realization of the method is a one-time procedure carried out during the computerized adaptive testing portal formation.
The method does not require a detailed calibration of the item pool or preliminary testing of examinees to create a calibration sample. The ordering method of outcome set is oriented on the test author; it helps him avoid the problem of preliminary adaptation of test items for the examinee's knowledge level and simplifies the workload at maximum. Preliminary work for the test author might only include the division of test items into several difficulty levels based on expert assessment.
In the situation where there is a lack of information about test item's and examinee's level, the method maximally uses the existing information for an examinee estimation: it takes into account all the answers to the questions provided to the examinee, and the set of received answers is compared to all the possible variants and placed on a corresponding level in the estimation hierarchy.
The paper presents the usage of the ordering method of outcomes set for multistage adaptive testing (MST) model as a sample. The method can be used for different modern testing models, but it is the subject of further research.
Conflict of Interest
The authors declare no conflict of interest.
Ethical Approval
Not applicable
Data Availability
The datasets used in this study are openly available at [repository link] and the source code is available on GitHub at [GitHub link].
Funding
This work did not receive any external funding.
References
Cite this article
Related Research


Special Issue
Launch a focused special issue to highlight research, emerging trends, and expert insights in your academic field.
