


IntelliPaper
Abstract
This study aims to evaluate atmospheric and terrestrial solar barriers using photovoltaic installations in arid regions. Solar barriers, such as desert aerosols and dust deposits, can significantly affect the performance of photovoltaic systems. The impact of these barriers on solar radiation was analyzed through aerosol optical depth (AOD) and the thickness of dust deposits on solar modules. The results show that solar barriers reduce the amount of solar radiation reaching the photovoltaic cells, thus affecting their performance. The variations in AOD and deposit thickness were measured under different atmospheric conditions, demonstrating a significant correlation with the decrease in global solar radiation. The study utilizes two solar systems installed side by side, one being kept clean and the other left with deposits to simulate the effects of solar barriers. Observations show that simultaneous solar barriers, such as hazy skies and dusty surfaces, have a greater impact than each barrier taken individually. The findings from this research provide valuable insights for optimizing the location and maintenance of solar installations, thereby maximizing their energy efficiency. This study contributes to a better understanding of the effects of solar barriers and proposes mitigation strategies to improve solar radiation capture in arid environments.
Explore Digital Article Text
I. INTRODUCTION
Solar barriers, particularly desert aerosols, significantly influence the assessment of a surface's solar energy potential. Solar obstacles, particularly desert aerosols, play a vital role in assessing the solar energy potential of a surface. These airborne soil particles, characteristic of arid regions with sparse vegetation and strong winds, are especially significant due to their mass and optical depth. In addition to desert aerosols, other solar obstacles, whether atmospheric or terrestrial in origin, substantially affect solar radiation. These obstacles include dust plumes, cloud formations, volcanic eruptions, and dust deposits, which disrupt radiation at various temporal scales, from isolated events to monthly and annual variations. Understanding these phenomena is crucial for optimizing the use of photovoltaic systems in environments subject to these constraints.
In the atmosphere, the optical depth of aerosols indicates the extent to which these particles reduce the transmission of light. The higher the value, the more the light is absorbed or scattered by aerosols, thereby limiting its propagation. Aerosols scatter and absorb incoming solar light, thus reducing visibility. An aerosol optical depth (AOD) of less than 0.1 m corresponds to a "clean" atmosphere, with clear blue skies and maximum visibility. As the Aerosol Optical Depth (AOD) increases to values such as 0.5, 3, or even beyond 10 m, the concentration of aerosols becomes so dense that it obscures sunlight. The primary sources of these aerosols include industrial pollution, wildfire smoke, storm-generated dust, sea salt, volcanic ash, and urban smog.
In photovoltaic fields, dust deposits on the surface of solar modules reduce the efficiency of the cells by blocking sunlight from passing through the glass. A clean and intact surface corresponds to a zero deposit thickness (0 m), while deposit thicknesses of 0.5, 1, and 3 m indicate an increasing accumulation of dust, progressively diminishing the transparency of the glass and exposure to solar radiation.
To effectively assess aerosol optical depth and the thickness of dust deposit layers influencing global solar radiation on photovoltaic cells, specific conditions must be met. These include accounting for clear or hazy sky conditions, utilizing low-power photovoltaic modules operating in parallel, installing solar systems side by side and oriented to the south, and conducting comparisons between a module kept consistently clean and another intentionally left dirty.
| Latitude (degree) | Relative air mass | Optical Path Length | Annual sunlight duration (hours) | Direct Solar Radiation (W/m2) | Reflected Solar Radiation (W/m2) | Diffuse Solar Radiation (W/m2) | Global Solar Radiation (W/m2) |
| 0 | 2.5 | 0.27 | 4392 | 1000 | 0 | 0 | 1000 |
| 15 | 2.64 | 0.58 | 4348 | 697 | 42 | 36 | 775 |
| 30 | 2.78 | 0.97 | 4304 | 596 | 56 | 48 | 700 |
| 45 | 3.35 | 1.37 | 4260 | 500 | 70 | 60 | 630 |
| 60 | 3.93 | 2.53 | 4216 | 335 | 94 | 80 | 500 |
| 75 | 5.64 | 4.45 | 4172 | 165 | 117 | 100 | 382 |
| 90 | 7.36 | 6.99 | 4128 | 0 | 140 | 120 | 260 |
II. DESCRIPTION OF THE PHYSICAL MODEL
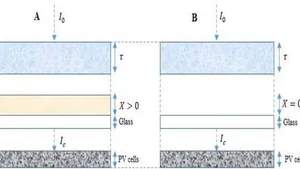
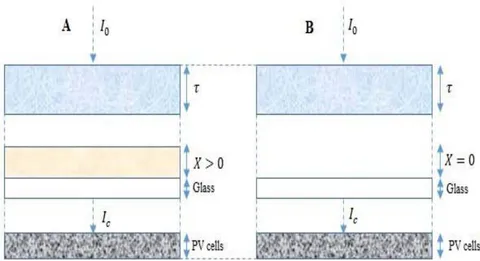
The analyzed physical model consists of two low-power solar systems, referred to as systems A and B. These systems are oriented due south at a angle and consist of two solar modules with identical peak power, installed side by side. Each system includes two inverters of equal capacity and two energy measurement devices. The surface of photovoltaic module 'A' will remain uncleaned throughout the study period, while the surface of photovoltaic module 'B' will be cleaned daily. System 'A' enables the measurement of daily, monthly, and semi-annual dust deposits while maintaining a null optical depth value. represents the daily extraterrestrial solar radiation, is the global solar radiation reaching the PV solar cells, is the optical thickness in the atmosphere, and X is the thickness of dust deposited on the surface of the PV module. At , it corresponds to a clear sky, while at , it corresponds to a sky loaded with desert aerosols or clouds. At X=0, the PV solar module is well-cleaned without dust on the surface, and at X>0, the solar module has a surface loaded with dust.
Numerical results
The optical depth equation is written as follows
The dust deposition equation is written as follows:
Discretization of the optical depth equation:
Discretization of the dust thickness equation:
With:
Where:
m: relative air mass;
k: extinction coefficient;
km: optical path length;
L: site latitude;
: real global solar radiation measured from solar system A;
: real global solar radiation measured from solar system B.
III. DISCUSSION
Solar obstacles refer to elements originating from both terrestrial and atmospheric sources that obstruct sunlight before it reaches the ground or a target surface. Understanding these obstacles is essential for accurately assessing the solar energy potential of a given area. Solar obstacles can be categorized into two main types: atmospheric obstacles and terrestrial obstacles.
Atmospheric solar obstacles are particles suspended in the atmosphere, such as clouds, precipitation, dust waves, and desert aerosols, which entirely or partially block sunlight before it reaches the ground. On the other hand, terrestrial solar obstacles consist of environmental elements, like desert dust, factories and fires, sea salt particles, volcanic ash, and smog, that settle on a solar surface and prevent the rays from reaching solar cells (Figure 2).
{"image_source":{"path":"images/638478e1055e98fd05579837566425cbb29cfa2c51332ca8032d4e596f211870.jpg"},"content":"","chart_caption":[{"type":"text","content":"a"}],"chart_footnote":[]} {"image_source":{"path":"images/c4fb8967f046b9168e79ffe6b21d9e6f5d29ecd16dcc91c4f3434af847c55fc3.jpg"},"content":"","chart_caption":[{"type":"text","content":"b"},{"type":"text","content":"Figure 2-a,b: Impact of atmospheric and terrestrial solar obstacles on solar radiation."}],"chart_footnote":[]}
The solar radiation received by a surface receives on the surrounding environment, which can vary at different times of the day. The impact of these obstacles on the performance of a solar installation can be substantial. Atmospheric solar obstacles, such as optical thickness, can affect performance rates by 86.64% to 98.77%, while terrestrial solar obstacles, such as dust deposits, can reduce performance by 58.83% to 84.85%.
Figure 3 demonstrates the direct and global solar radiation as a function of the sun's position in the northern and southern hemispheres. Positive signs (+) indicate the sun's position in the northern hemisphere, while negative signs (-) denote its position in the southern hemisphere. The Gaussian curve is used to observe the evolution of global solar radiation received by PV cells, regardless of the nature and thickness of atmospheric or terrestrial solar obstacles.
An analysis of Figure 3, the curve is divided into columns represented by standard deviations. The percentages indicate the values of global solar radiation corresponding to each standard deviation. The closer the global solar radiation is to the average, the more its value tends toward , signifying a significant presence of solar obstacles above the PV solar modules. Conversely, the farther the global solar radiation is from the average, the higher its value (greater than or equal to ), indicating a lower presence of solar obstacles.
Regarding radiation, the average standard deviation for dust deposits from terrestrial solar obstacles is 261.88 W/m , which influences solar radiation more than atmospheric solar obstacles, which average 442.45 W/m . The difference between the average standard deviations (atmospheric solar obstacle and terrestrial solar obstacle) is . A low average standard deviation indicates a significant impact on solar radiation. Therefore, in the case of simultaneity (dusty surface and hazy sky), the average standard deviation is , which is lower than individual solar obstacles. This shows that the combined effect of solar obstacles, both atmospheric and terrestrial, has a greater impact on solar radiation compared to when these obstacles are assessed individually.
{"image_source":{"path":"images/b4880068611176692a36ccc8f2588633a44179e00793a9db4daf7e4013db8679.jpg"},"content":"","chart_caption":[{"type":"text","content":"Figure 3: Gaussian curve illustrating the relationship between solar obstacles and global solar radiation."}],"chart_footnote":[]}
Relative air mass indicates the amount of atmosphere a light ray must traverse before reaching a target on the ground. In Figure 4, at latitude, solar rays pass through a thin atmosphere with a relative air mass (m) of 2.5. At above the equator, the rays pass through three (3) times more atmosphere to reach an observer at this latitude, with a relative air mass of 7.36. In the context of solar obstacles, the intensity of light reaching the target is influenced both by the atmospheric conditions between the Sun and the instrument, and by the quantity of obstacles present along its path.
The extinction or attenuation coefficient is a parameter that quantifies how the optical thickness (or optical depth in astrophysics) of an aerosol varies with wavelength. At latitude, solar radiation passes through a thin atmosphere, similar to relative air mass, giving an extinction coefficient of 0.11. In contrast, at from the Earth's poles, the extinction coefficient value is 0.95, nearly 9 times that of the equator. At the equator, the extinction coefficient and relative air mass exhibit lower values, gradually increasing as latitude rises.
{"image_source":{"path":"images/e2469ed99f2492a193404e064923782ba9be7b14cf909b5ca4d665c836359b2e.jpg"},"content":"","chart_caption":[{"type":"text","content":"Figure 4: Chart of m and k as a function of Earth's latitude"}],"chart_footnote":[]}
Under a cloudless sky, solar radiation decreases as the optical path length "km" increases with Earth's latitude. At latitude, the optical path length "km" is short, with a value of 0.274, explaining why global and direct solar radiation is maximum at the equator, with approximate values of (Table 1).
Direct solar radiation is more intense near the equator because solar light reaches it almost perpendicularly (Figure 5-a). These values gradually decrease as one moves away from the equator. Reflected solar radiation corresponds to a portion of the solar energy that, instead of being absorbed by the Earth's surface, is sent back into the atmosphere. This amount of reflected radiation increases with latitude, probably due to the increased snow cover and atmospheric reflection. Diffuse solar radiation results from the scattering of solar light by the atmosphere. Although generally stable, it can vary depending on local atmospheric conditions, such as cloud density or the presence of particles. Finally, global solar radiation, which combines direct, reflected, and diffuse radiation, demonstrates the decrease in direct radiation as latitude increases, a phenomenon partially compensated by diffuse and reflected radiation (Figure 5-b).
At the equator, diffuse solar radiation is almost zero, indicating that most solar light reaches the surface directly with minimal, tiny scattering. At a latitude of , a significant portion of solar radiation is scattered by the atmosphere, thus increasing diffuse radiation. At a latitude of , scattering becomes more intense, which significantly increases diffuse radiation. The combination of direct and diffuse radiation determines global solar radiation. Diffuse radiation values rise further from the equator because light travels through a thicker atmospheric layer, causing more scattering. At the equator, reflected radiation measures zero, likely due to the direct angle of solar incidence that minimizes reflected light. At a latitude of , a small portion of solar radiation is reflected, probably due to the increased reflective surfaces like clouds. And at, at latitude of , reflected radiation increases even more, possibly related to the presence of snow or ice and increased atmospheric reflection.
{"image_source":{"path":"images/f95a05c20dd358adad2c3bf3fe148ffe23f413129451639f4bfca9834085ea7d.jpg"},"content":"","chart_caption":[{"type":"text","content":"a"}],"chart_footnote":[]}
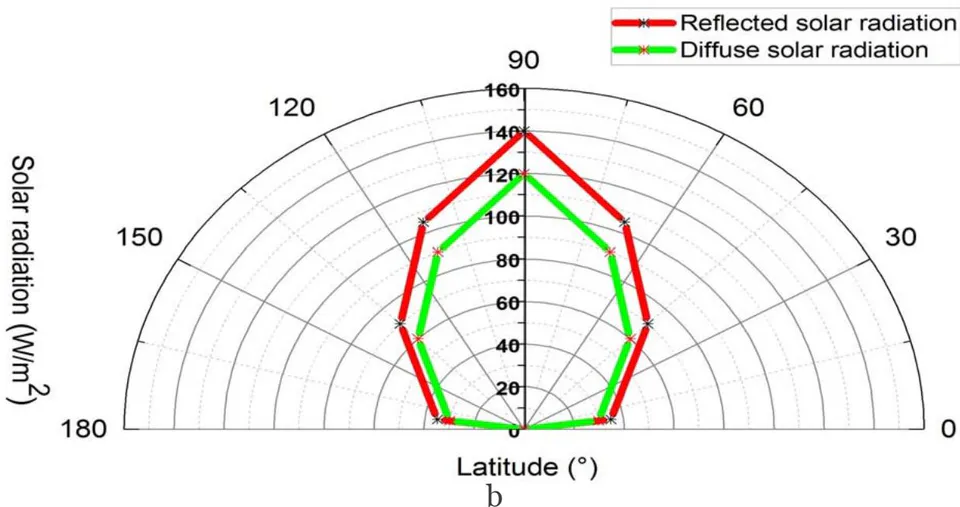
Reflected radiation, which represents a portion of solar energy redirected back into the atmosphere, increases with latitude due to greater snow cover and enhanced atmospheric reflection. At lower latitudes, minimal reflection contributes to higher levels of global solar radiation. However, as latitude rises, reflection intensifies, reducing the direct absorption of solar energy and thereby diminishing global solar radiation.
These analyses demonstrate how each component of solar radiation-direct, diffuse, and reflected-interacts to produce the observed variations in global radiation across different latitudes. The angle of incidence of solar light on the Earth's surface is directly influenced by latitude and the time of day. For a given latitude, this angle changes throughout the day due to the Earth's rotation and throughout the seasons due to the Earth's revolution around the Sun.
At high latitudes, the atmosphere absorbs and scatters a greater portion of solar radiation, which reduces direct radiation while increasing diffuse radiation. These changes significantly impact the climate patterns observed across different latitudes. Equatorial regions benefit from warmer and more stable temperatures, while polar areas are colder and experience more pronounced seasonal variations. For solar panel projects, these data are essential for optimizing the angle and position of the panels based on latitude to maximize solar radiation capture.
The optical path length is crucial in the intensity and diffusion of solar radiation with latitude. The observed variations are logical, as the angle of incidence of solar light in the atmosphere directly affects the optical path length. The more oblique the light penetrates the atmosphere, the longer the optical path, leading to increased absorption and scattering of solar rays.
From the equator, where the optical path is shortest, to higher latitudes, where it lengthens, this directly impacts the observed direct and global solar radiation. The values show a decrease in direct solar radiation with increasing latitude and variations in diffuse radiation. These data help to understand the distribution of solar energy by latitude, which is essential for understanding the differences in sunlight across the Earth.
Regarding calculations and modeling, it is crucial to consider the variations in optical path length and solar radiation according to Earth's latitude. These variations are essential for understanding how solar obstacles influence the amount of radiation reaching photovoltaic cells. The variation in extinction coefficients clearly demonstrates that polar regions undergo significantly higher attenuation of solar radiation compared to equatorial areas.
{"image_source":{"path":"images/7d69e2f70c644c797ea923a72f6da7e9d731d8e213a95400418a12b46f6c5b31.jpg"},"content":"","chart_caption":[{"type":"text","content":"Figure 6: Impact of Latitude on the Distribution of Solar Obstacles"}],"chart_footnote":[]}
It shows that as latitude increases, atmospheric and terrestrial solar obstacles become more significant, reducing the efficiency of solar installations. It is also interesting to note that seasonal fluctuations impact the amount of available solar radiation. For example, during winter, polar regions receive much less solar radiation due to the low angle of incidence and increased solar obstacles.
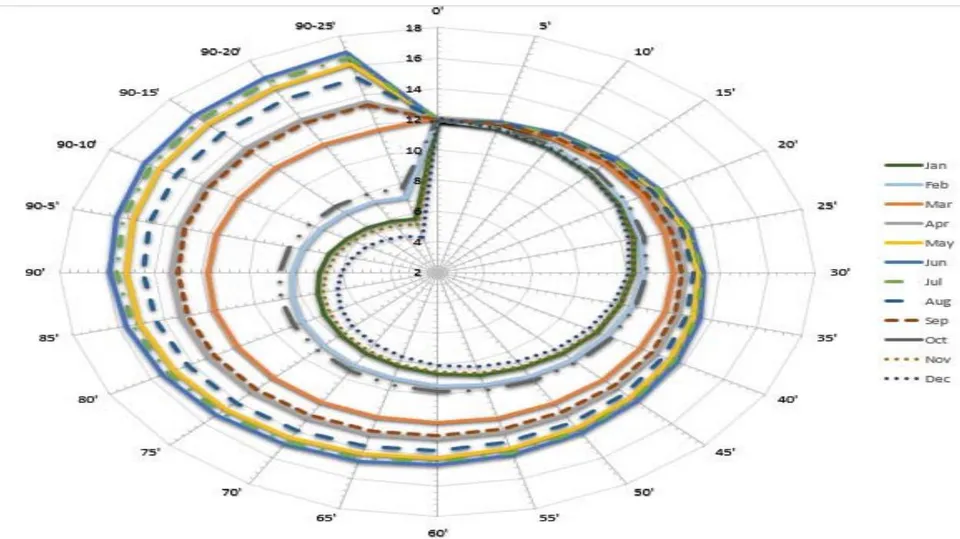
The Earth's elliptical orbit around the Sun directly affects both the intensity and distribution of solar radiation received on its surface. Indeed, the Earth's position in its orbit and the tilt of its rotational axis influence the amount of sunlight that reaches different regions throughout the year. This phenomenon is responsible for the seasonal variations in sunlight. In this annual round of 365 days, the Earth completes a full rotation on its axis in 24 hours. The curves in Fig. 7 shows the variation of daily sunlight duration from the equator to the Earth's poles. This north-south axis is tilted at an angle of relative to the perpendicular direction to the plane of the Earth's orbit around the Sun. This tilt remains constant throughout the Earth's orbit and is responsible for the seasonal variations, with opposite effects in the northern and southern hemispheres. Thus, during the winter months (December 21 to March 21) in the northern hemisphere, Sunlight is relatively short, and the Sun does not climb very high in the sky.
From March 21 to September 21, marking the summer months, the situation reversed: the northern hemisphere is tilted toward the Sun. The days are longer than the nights in the northern hemisphere, and the incident radiation is closer to vertical, giving a maximum sunlight duration of over 16 hours at the latitude of . At the spring and autumn equinoxes (March 21, September 21), the radiation is perpendicular to the equator (latitude ), and all around the globe, the days and nights are of equal length. At the summer solstice (June 21), the Earth is tilted toward the solar rays, and at noon, these rays are perpendicular to the Tropic of Cancer (latitude N). Sunlight duration is maximum in the northern hemisphere and minimum in the southern hemisphere (fig.1). The Sun never sets in the regions of the globe located within the Arctic Circle (which is below the latitude of the North Pole). The evolution of sunlight from the equator to the North and South Poles follows a spiral trajectory in the shape of a snail shell.
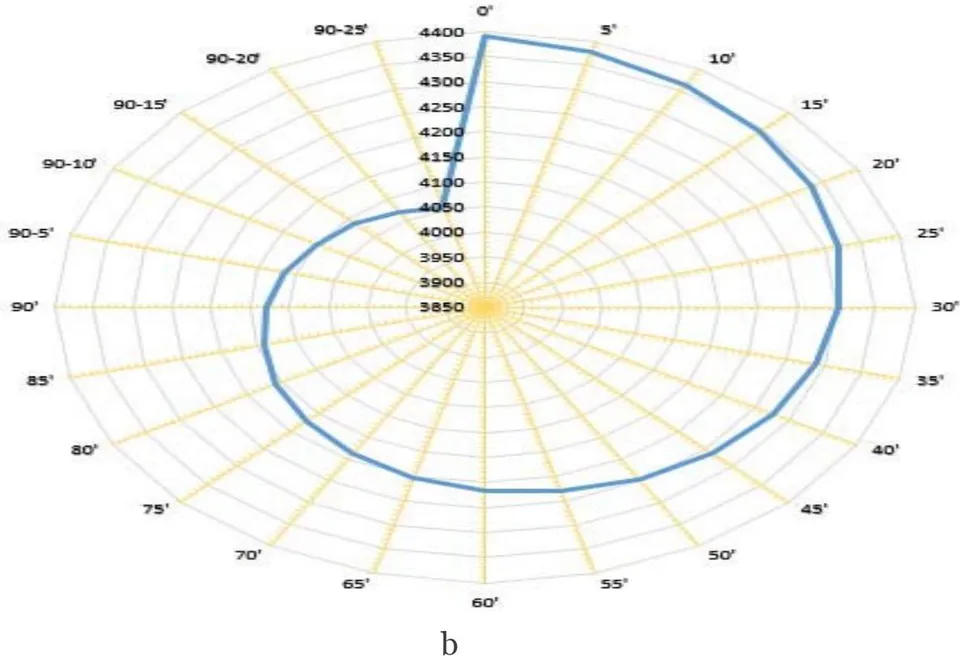
At the winter solstice, sunlight duration is shortest in the northern hemisphere and, conversely longest in the southern hemisphere. Thus, from the autumn equinox (September 21) at noon at latitude , the duration of sunlight decreases over the months until it reaches its shortest peak on December 21 in the northern hemisphere with 4 hours at , then increases again until the spring equinox. At the summer solstice, the progression of sunlight duration with latitude is the opposite of that in winter. Sunlight duration increases with latitude and peaks on June 21, marking the summer solstice, the longest day in the northern hemisphere with more than 16 hours at . The curve in Figure 8 illustrates the variation in annual sunlight duration, which decreases progressively from the equator toward the Earth's poles. At the equator, the annual sunlight duration reaches its maximum of 4,392 hours. The spiral shape of the curve shows a constant decrease from the equator to the North and South Poles. The shortest annual sunlight duration on Earth, totaling 4,055 hours, is observed at latitudes near the North and South Poles.
The study of solar obstacles has critical practical applications, particularly for optimizing solar panel projects. By considering the optical thickness of aerosols and dust deposits, it is possible to determine the ideal angles and positions of solar panels to maximize energy efficiency. Additionally, managing these obstacles, such as reducing industrial particle emissions or regularly cleaning solar surfaces, can significantly improve the performance of solar installations.
Taking into account both atmospheric and terrestrial solar obstacles is crucial for a precise assessment of a region's solar energy potential. Studies show that the impact of these obstacles varies by latitude, with more pronounced effects at higher latitudes. A better understanding of these phenomena allows for developing effective mitigation strategies and optimization of solar energy use, contributing to a more sustainable future.
IV. CONCLUSION
This study highlighted the importance of atmospheric and terrestrial solar obstacles in evaluating the performance of photovoltaic installations in arid regions. Using PV solar systems, we demonstrated that desert aerosols and dust deposits can significantly reduce the amount of solar radiation reaching photovoltaic cells.
The findings highlight that aerosol optical thickness and dust accumulation on solar surfaces are key factors in the reduction of global solar radiation. Simulations showed that solar obstacles impact energy performance differently depending on whether they occur individually or simultaneously. The combined presence of multiple obstacles results in a more pronounced reduction in energy performance.
These observations provide a solid foundation for optimizing photovoltaic systems, particularly concerning the location, orientation, and maintenance of solar panels. The proposed mitigation strategies can help maximize the efficiency of solar installations by reducing the negative impact of solar obstacles.
In conclusion, this research contributes to understanding the interactions between solar obstacles and photovoltaic systems, offering promising prospects for improving solar energy capture in arid environments.
Conflict of Interest
The authors declare no conflict of interest.
Ethical Approval
Not applicable
Data Availability
The datasets used in this study are openly available at [repository link] and the source code is available on GitHub at [GitHub link].
Funding
This work did not receive any external funding.
References
Cite this article
Related Research


Special Issue
Launch a focused special issue to highlight research, emerging trends, and expert insights in your academic field.