




IntelliPaper
Abstract
Climate change poses significant challenges that necessitate the development of policies aimed at managing aggregate inputs and social costs. For formulating such policies, an analysis of its factors and their current trends needs to be studied. This paper explores the factors influencing climate change and provides insights into their impact through changes in arable land and greenhouse gas (GHG) emissions in India from 1990 to 2020. Utilizing time series analysis, the study examines trends in GHG emissions from agriculture and develops a simulation model to estimate overall GHG emissions through methane and nitrous oxide emissions. Results indicate that enteric fermentation and agricultural soil are major contributors to methane and nitrous oxide emissions, respectively, with enteric fermentation contributing approximately 69.33% to methane emissions and agricultural soil contributing approximately 97.66% to nitrous oxide emissions. Additionally, a higher growth rate is observed for nitrous oxide emissions than methane emissions, with nitrous oxide emissions showing a 161% increase from 1960 to 2010. Furthermore, a positive correlation (i.e. r=0.587) between GHG emissions and changes in annual mean temperature underscores the direct impact of agricultural emissions on climate dynamics in India, with a regression coefficient factor of 0.176. It is estimated that the overall GHG emission from agriculture through methane and nitrous oxide emission will be approximately 695.87 to 818.73 MMTCDE in the year 2030; while the change in annual mean temperature is estimated to be about 1.65 ± 0.58o C from 1990 to 2030 in India. The findings highlight the urgent need for effective mitigation strategies within the agricultural sector to address the growing threat of climate change.
Explore Digital Article Text
I. INTRODUCTION
Agriculture, which accounts for approximately 42.86% of India's workforce (World Bank, 2022), contributes significantly to the country's economy, with its Gross Value Added (GVA) at current prices reaching about 18.3% in FY-23, and total food grain production reaching approximately 3296.87 lakh tonnes (PIB-Delhi, 2023). Not only does agriculture ensure self-sufficiency in feeding the population, but it also boosts exports. India has witnessed substantial growth in agricultural exports, with fruit and vegetable exports increasing by 18.94%, oilseed exports by 32.83%, oil meal exports by 34.24%, and rice exports by 5.38% in July 2023 compared to July 2022, underscoring the success of agricultural production in the country.
However, despite this growth, if the social costs were to be accounted for, the sustainability of this trajectory would be questioned. The exponential increase in production has led to a significant rise in Greenhouse Gas (GHG) emissions, primarily methane, nitrous oxide, and carbon dioxide (Lynch et al., 2021), emanating from the agriculture sector in India. Previous studies have shown that enteric fermentation by livestock and rice cultivation are major contributors to GHG emissions (Pathak, Bhatia & Jain, 2014). Similarly, recent assessments of GHG emissions from crop cultivation over the past 50 years in India indicate a staggering 161% increase from 1960 to 2010 (Sah & Devkumar, 2018).
Studies by Vetter et al. (2017) have highlighted the changing Indian diet and its implications on GHG emissions from food production, with rice cultivation and ruminant products being significant contributors. Additionally, the burning of agricultural residue and savannas has seen a 75% increase in GHG emissions since 2011 across India (Deshpande et al., 2023). Nitrogen fertilizers, a key component of agricultural practices, have been found to contribute significantly to GHG emissions, with a considerable portion lost to the environment (Gu & Yang, 2022; Coskun et al., 2017).
The surge in GHG emissions has led to observable climate change, with estimates suggesting a rise in Earth's temperature by 1.8-4.0°C by the end of the century (Aggarwal, 2008). Predictions also indicate an annual temperature increase of 0.7 to 1.0°C by 2040 compared to the 1980s, resulting in more frequent extreme weather events such as floods, droughts, and glacier melting (Lal et al., 1998).
This paper aims to analyze the trend and time-series data of GHG emissions in India in relation to changes in arable land. It also seeks to identify the factors driving the surge in nitrous oxide (N2O) and methane (CH4) emissions from agriculture, the two major GHGs. Furthermore, the study develops a model to understand the relationship between overall GHG production and emissions of nitrous oxide (N2O) and methane (CH4) from agricultural and allied activities in India. Finally, it correlates and estimates a model for the annual mean temperature changes in India with GHG emissions over the past 28 years (1990-2018). It is noteworthy that the study does not consider the parameters of carbon dioxide emissions (CO2) from agricultural activities due to its overall negative contribution to the total GHG emissions from agriculture.
II. METHODOLOGY
Greenhouse gases emitted per capita in Turkey were estimated to be about 7.2 to 8.0 tons in 2030 based on emissions from various sectors (Ozdemir, Pehlivan & Melikoglu, 2024). The study utilized both linear and logarithmic models to estimate the findings. Drawing from the references derived from the log-linear regression model developed by Gujarati & Porter (2009), expressed as:
Where represents quantities that are potential functions of variable X, and generally, a vector of values, while C and refer to the model parameters; a model for greenhouse gas (GHG) emissions from agriculture in India was subsequently developed. The study involves the analysis of secondary time-series data extracted from the Organization for Economic Cooperation and Development (OECD) for the years between 1990 and 2020, focusing on the Agri-Environment and other relevant indicators. The model transformed the data into logarithmic form and a linear regression model is fitted to derive a model for estimating total greenhouse gas emissions through agriculture ( ). The model is represented as follows:
Where represents total methane emissions from agriculture, and represents total nitrous oxide emissions from agriculture. For further analyzing the climate variables, a second model was estimated through the same process to examine the relationship between the annual mean temperature and . The secondary data for this model was extracted from the time-series data catalog accessed from the National Data Sharing and Accessibility Policy (NDSAP) for the years 1990 to 2018. The model is described as:
Both models were estimated with a confidence interval of 95% for accuracy
III. RESULTS & DISCUSSION
3.1 GHG emission and arable land in India
Graph 1 illustrates this relationship further, displaying a negative trend line for arable land and a positive trend line for GHG emissions. Additionally, Table 1 depicts a strong negative correlation (r = -0.986) between total arable land and overall GHG emissions. This indicates a significant decline in total arable land alongside an increase in GHG emissions from agriculture between 1990 and 2020. The reduction in arable land can be attributed to various factors, including increased livestock production (as estimated by increased enteric fermentation), excessive fertilizer usage, rice cultivation, and the burning of agricultural residue. It's important to note that the definition of arable land includes areas used for temporary crops, meadows, market or kitchen gardens, and temporary fallow land, excluding areas abandoned due to shifting cultivation.
{"image_source":{"path":"images/beafe68cc96f4b00c8b63a133938d6e2f54e5b6a1984996034809a4323d4708f.jpg"},"content":"","chart_caption":[{"type":"text","content":"Graph 1: Trend line between Total GHGs emission, Total agricultural land & ARABLE LAND from 1990-2020."}],"chart_footnote":[]}
Table 1: Partial Correlation between Total greenhouse gas emission from agriculture and ARABLE LAND
| ARABLE LAND | Total greenhouse gas emissions from agriculture | Total Agricultural Land area | ||
| ARABLE LAND | Pearson's r | — | ||
| p-value | — | |||
| Total greenhouse gas emissions from agriculture | Pearson's r | -0.986 | — | |
| p-value | <.001 | — | ||
| Total Agricultural Land area | Pearson's r | 0.979 | -0.965 | — |
| p-value | <.001 | <.001 | — |
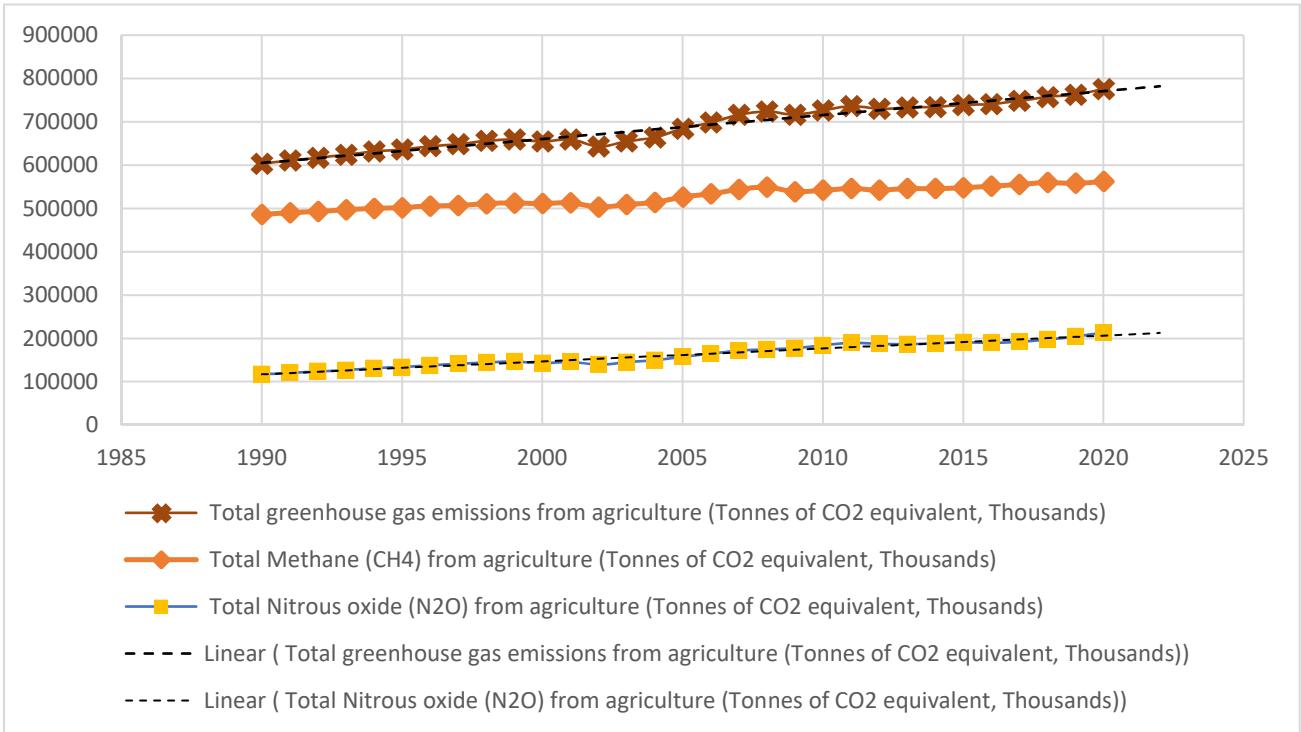
{"image_source":{"path":"images/78cda4da830568514c55888c0c5bf1762c6efa847419a5793e67ccdef8446fb7.jpg"},"content":"","chart_caption":[{"type":"text","content":"Graph 1.1: Trend lines of Total GHG emission, Total Methane (CH "},{"type":"equation_inline","content":"_4"},{"type":"text","content":") emission & Total Nitrous oxide (N "},{"type":"equation_inline","content":"_2"},{"type":"text","content":"O) emission in India from"}],"chart_footnote":[]}
However, Graph 1.1 revealed that the total emission through methane has been much greater while the trend line for nitrous oxide exhibited a steeper slope than methane emission ( ), indicating a higher rate of nitrous oxide emission growth between 1990 and 2020. This increase in nitrous oxide emissions can be attributed to excessive fertilizer and chemical usage in agricultural soil, leading to increased microbial activities such as denitrification and ammonification and other losses such as volatilization.
Table 1.1: Model Coefficients - TGHG_Agri - Transform Model Coefficients - TGHG_Agri - Transform 2
| Predictor | Estimate | SE | t | p |
| Intercept | 0.294 | 0.13089 | 2.25 | 0.034 |
| TCH4_Agri - Transform 3 ( $\beta 1$ ) | 0.757 | 0.02995 | 25.28 | <.001 |
| TN2O_Agri - Transform 3 (2) ( $\beta 2$ ) | 0.233 | 0.00791 | 29.45 | <.001 |
The analysis further identified specific sources contributing to methane and nitrous oxide emissions. Graph 1.2 illustrated an upward trend in methane emissions from field burning of agricultural residue and enteric fermentation, while emissions from rice cultivation and manure management remained relatively constant.
{"image_source":{"path":"images/3b1472d23ff6333f43e3037b060f5199b537f4cd71ae350d9d61a013a288c3f0.jpg"},"content":"","chart_caption":[{"type":"text","content":"Graph 1.2: Total Methane emission from different sources of agriculture in India (1990-2020)"}],"chart_footnote":[]}
Table 1.2: provided model coefficients indicating that enteric fermentation had the highest contribution to methane emissions (logEnteric_ferment = 0.6933), followed by rice cultivation (logRice-cult=0.2441) and burning of agricultural residue (logburning_agriResidues = 0.0106). These findings corroborated with previous studies indicating a shift in dietary habits towards increased consumption of animal-based products in India.
Table 1.2: Model Coefficients for logCH4
| Predictor | Estimate | SE | t | p |
| Intercept | 0.3549 | 0.01694 | 20.96 | <.001 |
| logEnteric_ferment | 0.6933 | 0.01020 | 67.96 | <.001 |
| logManure_mgt | 0.0503 | 0.01097 | 4.59 | <.001 |
| logRice_cult | 0.2441 | 0.00272 | 89.87 | <.001 |
| logburning_savannas | 4.75e-4 | 1.24e-4 | 3.83 | <.001 |
| logburning_agriResidues | 0.0106 | 0.00310 | 3.42 | 0.002 |
{"image_source":{"path":"images/45d5a8a03b3a96fe6fda6855349fb6d2be00b9a49b4c2de04cd14f963e090fd4.jpg"},"content":"","chart_caption":[{"type":"text","content":"Graph 1.3: depicts the total nitrous oxide emissions from various sources in Indian agriculture between 1990 and 2020. It showed an upward trend in emissions from agricultural soil and field burning of agricultural residue, with a significant increase observed over the period."},{"type":"text","content":"Graph 1.3: Total Nitrous oxide emission from different sources from agriculture in India (1990-2020)"}],"chart_footnote":[]}
The model coefficients from Table 1.3 confirmed that agricultural soil had the highest contribution to nitrous oxide emissions (logAgri_soil = 0.97657), followed by manure management (logManure_mgt = 0.01476).
Table 1.3: Model Coefficients - logN2O
| Predictor | Estimate | SE | 95% Confidence Interval | t | p | Stand. Estimate | 95% Confidence Interval | ||
| Lower | Upper | Lower | Upper | ||||||
| Intercept | 0.07476 | 0.00395 | 0.06664 | 0.08289 | 18.916 | <.001 | |||
| logManure_mgt | 0.01476 | 0.00187 | 0.01091 | 0.01861 | 7.885 | <.001 | 0.00585 | 0.00433 | 0.00738 |
| logAgri_soil | 0.97657 | 0.00105 | 0.97441 | 0.97873 | 927.899 | <.001 | 0.99305 | 0.99085 | 0.99525 |
| logburning_savanna s | 9.02e-4 | 7.43e-5 | 7.49e-4 | 0.00105 | 12.131 | <.001 | 0.00209 | 0.00174 | 0.00244 |
| logburning_agriResi dues | 0.00168 | 0.00180 | -0.00203 | 0.00538 | 0.930 | 0.361 | 6.06e-4 | -7.34e-4 | 0.00194 |
3.2 GHG emission and annual mean temperature change
The examination of greenhouse gas (GHG) emissions and annual mean temperature change unveiled an upward trend for both factors from 1990 to 2018, as illustrated in Graph 2. Although some fluctuations were noted in the annual mean temperature trend line for India, an overarching shift towards higher annual mean temperatures was apparent, suggesting a general increase.
{"image_source":{"path":"images/c0e55e4d1302b8f3c3ef2418b9524bd61200321d0dbffb08788a1d39c3c55264.jpg"},"content":"","chart_caption":[{"type":"text","content":"Graph 2: Total GHG emission & Annual Mean Temperature Change in India"}],"chart_footnote":[]}
Graph 2.1 illustrates the observed and estimated values for GHG emissions and annual mean temperature, which were predicted through the model developed by the time series analysis of logarithmically transformed values for total GHG emissions and annual mean temperature.
{"image_source":{"path":"images/a090f5dd7a2b7b86be36de71e1487fc54a3b919819313ec39565246b827d6f59.jpg"},"content":"","chart_caption":[{"type":"text","content":"Graph 2.1: Observed and Estimated Values of log(TGHGs) & log(Mean_temp)"}],"chart_footnote":[]}
Table 2: Parameter Estimates for log (annual mean temperature) Model Fit Measures
| Model | R | $R^2$ |
| 1 | 0.585 | 0.342 |
Model Coefficients - Mean_AVG - Transform 3
| Predictor | Estimate | SE | t | p |
| Intercept | 0.366 | 0.2799 | 1.31 | 0.202 |
| TGHG_Agri - Transform 2 | 0.176 | 0.0480 | 3.67 | 0.001 |
Table 2, which estimates the model coefficients for annual mean temperature, showed a positive coefficient for total GHG emissions from agriculture. This model explained 99.2% of the variance in the dependent variable ( ), indicating a strong relationship between GHG emissions from agriculture and their contribution to temperature change in India.
Graph 2.2 illustrates a scatterplot diagram of the estimator with the actual values obtained for the given period. It can be observed that the estimator responds with 95% accuracy to the original data.
{"image_source":{"path":"images/795a81b8a5f91009b919e3cdacdf2c4dfc39796ea0a3731d15f24ce3fdd3d447.jpg"},"content":"","chart_caption":[{"type":"text","content":"Graph 2.2: Scatterplot diagram of Actual and Predicted Values of Annual Mean Temperature from 1990 to 2018"}],"chart_footnote":[]}
Thus, it can be inferred that there is a direct relationship between GHG emissions from agriculture and their impact on temperature change in India, with agriculture playing a significant role in influencing the observed changes in temperature.
IV. CONCLUSION
From the study, the following conclusions were drawn:
Despite agriculture in India emitting a larger overall amount of methane, the rate of nitrous oxide emission was significantly higher.
➢ Enteric fermentation emerged as the primary contributor to methane emissions, aligning with previous studies such as Singhal and Mohini (2002). Additionally, nitrous oxide emissions from agricultural soil were identified as a major contributor to GHG emissions, corroborating findings by Bhatia, Pathak & Aggarwal (2004).
A direct relationship between overall GHG emissions and the annual mean temperature in India was observed. With an increase in total GHG emissions, the average annual mean temperature also rose, with a coefficient factor of 0.176. The study revealed that GHG emissions from agriculture directly impacted climate change in India between 1990 and 2020. Similar investigations were conducted by Moiceanu and Dinca (2021) in Romania.
According to the national greenhouse gas (GHG) inventory, the agriculture sector in India currently emits 408 million metric tons (MMT) of CO2 equivalent. However, projections from a model suggest that GHG emissions from agricultural activities, primarily from methane and nitrous oxide emissions, will increase significantly by 2030. These emissions are estimated to range between 695.87 to 818.73 million metric tons of CO2 equivalent (MMTCDE) by 2030.
Additionally, projections indicate a notable increase in the annual mean temperature in India. Specifically, the temperature is expected to rise by approximately °C from 1990 to 2030. This temperature rise could have significant implications for various aspects of the environment, agriculture, and human activities in India.
These conclusions underscore the significant role of agricultural activities in contributing to GHG emissions and their subsequent impact on climate change, highlighting the need for effective mitigation strategies within the agricultural sector.
Scope of Study:
To assess the impact of suggested measures on greenhouse gas (GHG) emissions, a comparative experiment could be designed. It will involve two sites, where one will follow conventional agricultural practices, while the other will be untouched by modern farming technologies. After implementing silage feeding for livestock and direct seeded rice practices, the emission of methane and nitrous oxide from both sites will be monitored. This will enable us to examine the effects of these practices in varying conditions and their correlation with soil emissions.
Conflict of Interest
The authors declare no conflict of interest.
Ethical Approval
Not applicable
Data Availability
The datasets used in this study are openly available at [repository link] and the source code is available on GitHub at [GitHub link].
Funding
This work did not receive any external funding.
References
Cite this article
Related Research


Special Issue
Launch a focused special issue to highlight research, emerging trends, and expert insights in your academic field.
