

IntelliPaper
Abstract
Bees are essential to global ecosystems, particularly for pollinating crops, yet in recent years their populations have faced significant decline. One critical aspect of bee colony health is the ability to detect negative in-hive events such as a queen leaving the hive. Traditionally, beekeepers rely on manual inspections to assess hive conditions, a labor-intensive and time-consuming process. However, recent advances in machine learning offer new approaches to automating this task. Since 2016, there have been attempts to classify bee sounds using machine learning, employing the power of different machine learning methods, including deep learning architectures.
In this research, we explore the use of acoustic labeled data for in-hive event classification, focusing specifically on detecting when a queen leaves the hive. We utilize 12-hour recordings from different locations, with the data preprocessed and transformed to be suitable for input into a transformer-based neural network. Our goal is to demonstrate that transformer models yield superior results in this task compared to previous approaches. The study is organized into several key sections: we first highlight the ecological importance of bees, followed by a literature review on the state of bee sound classification research. We then delve into the data preparation process, model design, and present our findings. Our results underscore the potential of transformer models in automating hive monitoring, offering a scalable solution for beekeepers to protect and preserve bee populations.
Explore Digital Article Text
I. THE IMPORTANCE OF BEES
Bees play an essential role in global agriculture, serving as primary pollinators for a wide variety of crops. [1] Without bee pollination, the agricultural sector would suffer significant setbacks, leading to decreased crop quantity and reduced quality. In fact, numerous studies dating back to the 1990s have emphasized the critical impact of bees on crop health, particularly in crops like strawberries, where successful pollination directly correlates with higher quality and yield. [2] [3] [4] The deepening decline in bee populations threatens the ecological and economic stability of every country, underscoring the vital need to protect and sustain bee pollination services.
In recent years, there has been a noticeable and alarming decline in bee populations, which is attributable to a variety of factors. [5] These factors can be classified into two main categories: external, or outside-the-hive events, and internal, or in-hive events. External factors include the widespread use of pesticides and the aggressive spread of African killer bees, both of which pose a significant threat to local bee populations. [6] [7] In-hive events, such as swarming and the departure of the queen bee, also present challenges. Swarming can be triggered by various conditions, such as the emergence of a new queen, and can lead to the collapse of the hive if not properly managed. Such occurrences are particularly devastating for beekeepers as the entire colony may be lost. [8] To address these challenges, this paper focuses on leveraging data-driven techniques to aid in precision beekeeping. By developing an algorithm capable of identifying harmful in-hive events, beekeepers can proactively monitor the state of their colonies and prevent destructive outcomes, such as swarming or queen loss. Recent research shows that bees communicate not only through physical movements, such as the famous "waggle dance," but also through subtle vibrations and acoustic signals. [9] [8] Different in-hive events are associated with specific sound frequencies, many of which fall outside the range of human hearing. Therefore, sound-based monitoring systems, particularly those that can detect these lower-frequency vibrations, hold great potential for beekeepers.
In this paper, we focus specifically on using labeled acoustic data to identify and prevent harmful in-hive events. By accurately recognizing sound patterns associated with swarming or the hive entering a queenless state, we aim to assist beekeepers in maintaining healthy colonies. This proactive approach to hive management not only supports the agricultural sector by ensuring consistent pollination but also contributes to broader ecological stability by helping sustain bee populations. Without a data-driven approach, manual inspections disturb the bees, potentially leading to negative consequences for their health and behavior, especially by inexperienced beekeepers.
II. RELATED WORK
The classification of bee sounds using machine learning (ML) has garnered significant attention, particularly in recent years, with most of the research occurring after 2022. This section reviews relevant studies focused on the use of acoustic data for classifying in-hive events, highlighting key methodologies and results that inform our current research.
One of the earlier works in this domain was conducted by Zgank in 2017, who explored the classification of bee sounds, particularly in the context of swarming. [10] Zgank utilized data from the Open-Source Beehives Project and applied feature engineering techniques such as Mel-Frequency Cepstral Coefficients (MFCC) and Linear Predictive Coding (LPC). The study employed Gaussian Mixture Models (GMM) and Hidden Markov Models (HMM) for classification. The best model is HMM with a 15-state using
MFCC features achieving a notable F1 score of 90% for the binary prediction of a swarming event.
In 2018, Cejrowski attempted to model active bee days and identify patterns associated with the removal of the queen from the hive. [11] However, the study did not achieve satisfactory results in classifying these events using the clustering algorithm t-SNE (t-distributed stochastic neighbor embedding), which was explored as a potential classification tool.
Howard's 2013 research focused on predicting the queenless state of a hive using sound data. [12] The study transformed acoustic data into spectrograms and applied Fast Fourier Transformation (FFT) and S-transformation before utilizing a Self-Organizing Map (SOM) neural network for classification. Although the predictive results were not particularly strong, the study successfully visualized the two hive states using the neural network's output.
More recently, Rustum (2023) revisited the classification of queenless states using a combination of feature engineering methods and classification models. [13] The study found that a hybrid approach combining MFCC features with K-Nearest Neighbors (KNN) or Random Forest (RF) algorithms yielded the best results, with accuracy rates of 83% and 82%, respectively. Another study in the same year further explored the classification of queenless states using MFCC for feature engineering and logistic regression with Lasso for feature selection, achieving a 95% accuracy in distinguishing bee sounds associated with the queenless state. [14]
Beyond hive conditions, researchers have also explored the classification of bee species based on their flying sounds. In 2021, Ribeiro applied support vector machines (SVM) combined with MFCC to distinguish between different types of bees and other insects, achieving an accuracy of 73.39%. [15] This research aimed to correlate the types of bees pollinating tomato plants with the quality of the resulting fruit.
In 2023, Di conducted a comparative study on feature engineering methods for bee sound recognition.[16] The study compared two feature engineering approaches - a convolutional neural network (CNN) hidden layer and MFCC. Four different machine learning algorithms (RF, SVM, KNN, Decision Trees) were tested across three datasets. The CNN layer consistently outperformed MFCC, with the best model—KNN with CNN feature engineering—achieving a accuracy rate.
Another study in 2023 by Ruvinga focused on the classification of queenless states using MFCC features as inputs to a Long Short-Term Memory (LSTM) classifier and spectrograms as inputs to CNNs. The CNN-based approach achieved a remarkable accuracy of 99%. [17] In addition to these approaches, a novel study in 2023 applied Log Mel-Spectrograms and CNN EfficientNet V2 with Pre-trained Audio Neural Networks (PANNs) to recognize different bee species. This study introduced a data augmentation step and achieved an F1 score of . [18]
Lastly, in 2021, Benetos annotated an acoustic dataset with labels indicating the presence or absence of bee sounds and tested SVM and CNN algorithms to predict hive events like swarming. [19] The results, however, were not satisfactory.
In conclusion, the literature indicates that researchers have explored both classical machine learning approaches, such as Random Forest and Support Vector Machines, as well as more advanced neural network models, particularly CNNs, for the classification of bee sounds. These efforts lay a solid groundwork for our research, which focuses on further refining sound classification methods for detecting in-hive events and enhancing accuracy using a specific type of neural network—a transformer—an approach not previously explored in other studies.
III. DESING OF THE EXPERIMENT
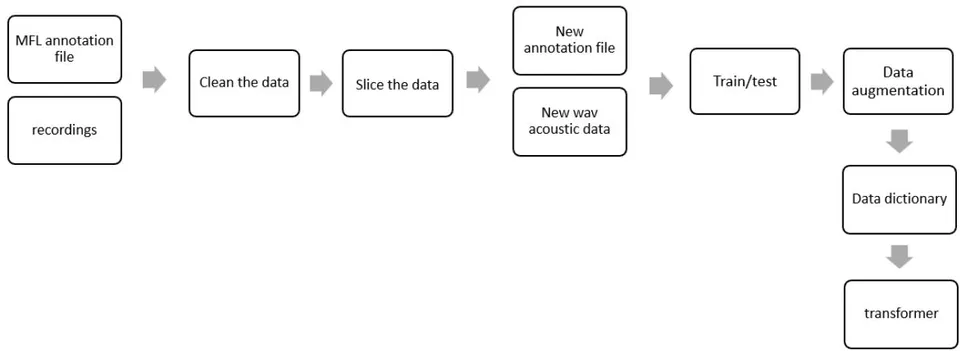
The design of the experiment follows a systematic approach to classify bee sounds into three categories: 'active day,' 'queenless,' and 'queen present.' The process begins by utilizing an already labeled dataset, which is then cleaned to remove silence and ensure all recordings are of uniform length. This step is crucial for standardizing the data, making it suitable for further analysis and modeling.
To enhance the dataset and introduce greater diversity, data augmentation techniques are applied. This step artificially increases the number of data points, providing a richer and more varied training set that helps improve model performance and reduce the risk of overfitting.
Given that the overarching goal of this experiment is to train a transformer model, the subsequent step involves partitioning the dataset into distinct training and testing subsets. This partitioned data must then be meticulously converted into a data dictionary format, which is the required input structure for compatibility with HuggingFace's transformer models. This transformation ensures that the data is optimized for efficient processing, allowing the model to effectively learn and generalize from the training data while being rigorously evaluated on the test set.
The final phase of the experiment involves training a model to classify the bee sounds. Neural networks, particularly CNNs, have been identified as the most promising models in previous research. To the best of the authors' knowledge, transformer models have not yet been explored for this specific task. In this experiment, we employ the HuBERT model, which incorporates CNN layers, and fine-tune a pretrained version of the model using the augmented and original datasets, leveraging its prior knowledge to improve classification accuracy.
{"code_caption":[{"type":"text","content":"Figure 2: Snippet of the MFL File with Annotations"}],"code_content":[{"type":"text","content":"CF001 - Missing Queen - Day -\n0 11.25 bee\n11.26 11.52 nobee\n11.53 15.4 bee\n.\nCF003 - Active - Day - (214)\n0 7.3 bee\n7.31 7.87 nobee\n7.88 10.37 bee\n10.38 10.63 nobee\n10.64 15.64 bee\n15.65 17.32 nobee\n17.33 20.93 bee\n20.94 28.96 nobee\n28.97 33.01 bee\n33.02 36.43 nobee\n36.44 37.65 bee\n37.66 44.42 nobee\n44.43 49.98 bee\n49.99 58.07 nobee\n58.00 66.28 bee"}],"code_language":"txt"}
IV. DATA
4.1 Raw Data
The raw data used in this study originates from the research titled "To bee or not to bee: Investigating machine learning approaches for beehive sound recognition." [19] This dataset consists of 78 annotated audio files in three formats: WAV, MP3, and LAB. However, for the purposes of this paper, we focus exclusively on the WAV and MP3 files, as the LAB format is tied to specific software that may not be readily accessible to the broader machine learning community. The annotations within these files capture various states of the beehive, including active beehive days, queenless states, and states with a present queen, with a total duration of 12 hours of recordings. Figure 2 provides a visual representation of how the files are labeled.
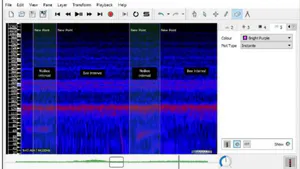
Each audio file is meticulously segmented into portions where bee sounds are either audible or not. These segments are documented in text files with an MFL extension, which contain start and end timestamps corresponding to "Bee" or "NoBee" labels. The acoustic data was gathered through two projects, "Open Source Beehive" (OSBH) and "NU-Hive," conducted across diverse geographical locations including North America, Australia, and Europe. This global data collection approach ensures that the results of the classification efforts are not biased by local environmental sounds or the behaviors of specific bee species, thereby enhancing the generalizability of the findings.
![Figure 3: Bee and NoBee Labeling Process [20]](https://doc.journalspress.com/vemz72_107153/ocr/images/derivatives/c5/c50cc8da533dd9e9c82671c1530ad8e99e705941d144cb976253a6232d085c98.webp)
4.2 Data Cleaning
The data cleaning process is crucial in preparing the raw dataset for the modeling phase. Initially, the annotated dataset contains 2,420 rows of labeled data, where each row represents a segment of audio labeled as either "active day," "missing queen," or "queen present," corresponding to the filenames. The first step in the cleaning process involvestransforming the MFL text file into a standard Pandas DataFrame, making it easier to manipulate and analyze. (Table 1)
| Start | End | Label | File Name |
| 0 | 11,25 | bee | CF001 - Missing Queen - Day - |
| 11,26 | 11,52 | nobee | CF001 - Missing Queen - Day - |
| 11,53 | 15,4 | bee | CF001 - Missing Queen - Day - |
| 0 | 7,3 | bee | CF003 - Active - Day - (214) |
| 7,31 | 7,87 | nobee | CF003 - Active - Day - (214) |
| 7,88 | 10,37 | bee | CF003 - Active - Day - (214) |
To ensure the dataset is relevant for modeling, we first remove all rows where no bee sounds are present (i.e., rows labeled as "nobee"). Following this, we eliminate any rows where the duration of the audio segment is less than 5 seconds, as shorter durations may not provide sufficient information for reliable classification. This filtering process reduced the dataset to 679 rows.
However, these remaining rows vary in duration, which pose a challenge for the machine learning algorithms, as they typically require uniform input lengths. To address this, the 679 rows are further split into 5-second intervals, and each interval is saved as a separate WAV file. A new annotation file is then created, mapping each 5-second interval to its corresponding label. (Table 2)
| Index | Index_original_file | Start | End | Label | Start_sliced | End_sliced |
| 0 | 1 | 0 | 11,25 | bee | 0 | 5000 |
| 1 | 1 | 0 | 11,25 | bee | 5000 | 10000 |
| 2 | 6 | 0 | 7,3 | bee | 0 | 5000 |
| 3 | 18 | 44,43 | 49,98 | bee | 44430 | 49430 |
This process not only cleans the dataset but also standardizes the audio segments, making them more suitable for input into machine learning algorithms. As a result, the structure of the dataset shifted from a collection of multi-length segments to a larger, more uniform set of 5-second audio files, ready for effective modeling. Table 3 presents a concise summary of the cleaned
| Actions | Sum Duration | Count Rows |
| active day | 7327,38 | 395 |
| missing queen | 13895,06 | 1178 |
| queen | 8379,4 | 480 |
4.3 Data Augmentation
Before transforming the audio data into a format which is suitable for training Transfomer model, it is advantageous to perform data augmentation, a step that is often overlooked but can significantly enhance model performance. As mentioned in one of the papers in the related work, the authors observed an increase in model accuracy after incorporating data augmentation, highlighting its importance.
The primary objective of data augmentation is to artificially expand the dataset by generating new examples from the existing labeled data. This process is especially crucial when dealing with limited datasets, as it provides the machine learning algorithm, particularly neural networks, with more input data. Additionally, data augmentation introduces variability into the dataset, which helps prevent the model from overfitting to the original training data and enhances its generalization capabilities. [21] [22] For acoustic data, the Python library audiomentations is commonly used for this purpose. [23] In this study, four different augmentation techniques were applied randomly, each with a 50% probability of being applied to any given audio sample from the train data set:
Add Gaussian Noise: This method introduces Gaussian noise to the audio signal, with a maximum amplitude of 0.015 and a minimum of 0.01, simulating the effect of random background noise.
Tanh Distortion: The tanh function is applied to the audio signal to slightly distort and smoothen the recording, mimicking the natural variations that might occur during real-world recordings.
Gain Transition: This technique randomly increases or decreases the sound volume in logarithmic intervals, simulating natural changes in volume, such as a bee moving closer to or farther from the microphone.
Air Absorption: This filter simulates environmental effects like moisture and air absorption, which can subtly alter the audio signal, making the dataset more representative of real-world conditions.
att = exp (-distance * absorption coefficient) In the above equation, distance is the distance to the recording microphone and the absorbing coefficient is the ability of the microphone to record.
By incorporating these augmentation techniques, the dataset becomes richer and more diverse, providing the model with a broader range of examples to learn from, ultimately leading to better performance and robustness in real-world applications. In this experiment, the data size for the training data has been doubled using the above-mentioned data augmentation techniques.
4.4 Data Dictionary
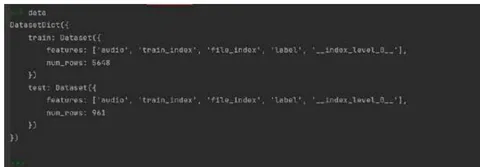
The HuggingFace Transformer model necessitates a specific data format known as a data dictionary for effective training. This format is based on Apache Arrow, a memory-efficient data structure designed for high-performance analytics. [24] While Python provides an existing implementation to transform data from a Pandas DataFrame to a data dictionary, this conversion process is computationally intensive and time-consuming. To optimize performance and prevent hardware failures given the current experimental setup, parallelization of the transformation process (specifically, row-by-row transformation) is required. The structure of the data dictionary is as follows:
![Figure 4: First row from the data dictionary Totten Tomatoes. [25]](https://doc.journalspress.com/vemz72_107153/ocr/images/derivatives/a7/a78483ecd4ff11f30e09149023dfcf34b067d5d110265cb0c96eebcbc1706764.webp)
The data dictionary specifies the dataset source and the data split, indicating whether the subset is used for training or testing. Within the features section, each column of the dataset is individually detailed, including information about its format and data type. For this exercise, the dataset was divided into training and testing subsets, with 80% allocated to training and 20% to testing, using stratified sampling based on the labels to maintain proportional representation across the splits. The transformation into the data dictionary format is performed after the data augmentation stage, ensuring that the cleaned, split, and augmented data is properly structured for use with the Hugging Face Transformer models. The graph below illustrates the final state of the data, showcasing how the cleaned, split, augmented, and transformed dataset appears. This concludes the data preparation section of this paper.
V. TRANSFORMER
In this section, following an overview of the data and the transformation processes required to prepare it for input into the HuggingFace transformer model, we provide a concise explanation of the transformer's design, with a particular emphasis on the feature engineering components. Additionally, we discuss the advantages of utilizing a pre-trained model, the rationale behind this approach, and the specific model chosen for the task.
5.1 Overall Architecture
In this paper, we leverage a transformer model, originally developed for sequence-to-sequence tasks like text translation, to classify bee sounds. It has demonstrated remarkable success in the domain of text-related tasks. [26] Transformers offer a significant advantage by combining the strengths of Recurrent Neural Networks (RNNs) and Convolutional Neural Networks (CNNs), enabling them to model sequential data effectively while being computationally efficient due to their parallel execution capability. A key innovation in transformer models is the Attention mechanism, which allows the model to capture relationships between both closely related and distant elements in the sequence. [26] This is particularly useful for understanding complex patterns not only in text but also in audio data, where distant dependencies might be as critical as immediate ones. The Attention component enables the model to weigh the importance of different parts of the audio sequence, allowing it to focus on key segments that are more relevant for the classification task, such as specific bee sounds that indicate different hive states Another critical component of transformers is positional encoding, which preserves the order of inputs—such as the sequence of words in text or phonemes in audio—across the entire network. This ensures that the model not only understands the content but also the context provided by the sequence or the acoustic file.
![Figure 6: HuBERT Architecture [27] Classification of Acoustic Data with Transformer Model](https://doc.journalspress.com/vemz72_107153/ocr/images/derivatives/63/634184859b6672bfd535bb409c1095c6692dd7f5f4982f41ee296c953534d599.webp)
In 2020, the transformer model was modified for the first time to accept acoustic data as input, rather than textual data, demonstrating outstanding performance in this domain of machine learning. [28] The specific transformer model used in our research is HuBERT (Hidden Units Bidirectional Encoder Representations from Transformers), a variant designed to process audio data. HuBERT is based on the BERT model, which utilizes only the encoder part of the original transformer architecture. [27] Figure 6 presents a visual representation of the architecture of the HUBERT model.
The architecture of HuBERT comprises several key components, some of which align with the standard transformer structure previously described. The HuBERT-specific elements are detailed briefly below:
Convolutional Network – Following the extraction of Mel-Frequency Cepstral Coefficients (MFCC) features from the input data—detailed extensively in the subsequent section—these features are processed through a CNN layer. The purpose of this step is to capture local patterns, such as sound frequencies, as well as the hierarchical structure inherent in the data. The resulting output consists of transformed vectors - latent features.
Transformer encoder – Those latent features are then passed to transformer encoder.
Unlike other transformer models that process input in a sequential manner, the encoder in HuBERT is bidirectional, meaning it can attend to information from both past and future contexts simultaneously. This bidirectionality is crucial for capturing the complex temporal dependencies present in audio data, allowing the model to understand the full context of the sound sequence.
- K-means clustering – the unsupervised approach is used to group different audio segments together as latent labels, capturing sound patterns in the data. The model is then trained to predict the cluster assignments, which helps in learning robust representations of the audio data even before the labeled data is introduced.
5.2 Feature Engineering
In the transformation of audio data for machine learning applications, Mel-spectrograms and Mel Frequency Cepstral Coefficients (MFCC) are two of the most widely employed feature engineering techniques. HuBERT uses MFCC as the feature engineering method. Both techniques are grounded in the Fourier Transform, a mathematical method that converts time-domain signals into their frequency-domain representations. [29] This transformation is crucial for analyzing the spectral content of audio, which is essential for tasks like sound classification.
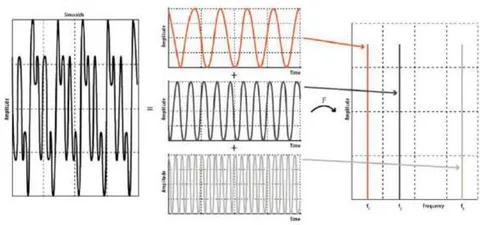
When audio is digitized, it is typically sampled at a rate of 44,100 samples per second, capturing the amplitude of the sound wave at discrete time intervals. The Fast Fourier Transform (FFT) is then applied to this sampled data, decomposing the complex audio signal into its constituent sinusoidal components—specifically, sine and cosine waves. [21] This decomposition allows us to analyze the frequency components of the signal. (Figure 7) However, one of the underlying assumptions of FFT is that the signal is stationary and repetitive, which is rarely true for natural sounds.
To address this limitation, the audio signal is first segmented into overlapping time windows, often using a window function like the Hamming or Hann window to minimize spectral leakage. FFT is then applied to each windowed segment individually. This process, known as Short-Time Fourier Transform (STFT), allows the analysis of how the frequency content of the signal evolves over time. To better align the frequency representation with human auditory perception, the resulting frequency values are then mapped onto the Mel scale, a perceptual scale of pitches judged by listeners to be equal in distance from one another. This transformation yields the Mel-spectrogram, where frequencies are represented on a logarithmic scale, reflecting the human ear's reduced sensitivity to lower frequencies. [30] The equation below demonstrates the calculation of the Mel-spectrogram:
, whereis the logarithm with base 10 andis the frequency in Hz.
Mel-Frequency Cepstral Coefficients (MFCC) take this process a step further. After obtaining the Mel-spectrogram, the log-magnitude of each Mel-frequency band is computed. These values are then subjected to a Discrete Cosine Transform (DCT), which decorrelates the Mel-spectrogram's frequency components and compacts the most significant information into a small number of coefficients. The first few coefficients typically capture the bulk of the relevant information, making MFCCs an efficient and effective representation of the audio signal for machine learning tasks.
Both Mel-spectrograms and MFCCs are essential for transforming raw audio data into structured features that can be readily processed by machine learning models. By capturing both the temporal and spectral characteristics of the sound, these techniques enable the development of robust algorithms for audio classification and other related applications.
5.3 Pretrained Models
In this paper, we utilize a pretrained HuBERT model from the Hugging Face platform, specifically the hubert-base-ls960 model, which has been trained on a diverse dataset of animal sounds, including those of cats and dogs. [31] Hugging Face is a leading platform for research collaborations on transformer models. It provides a robust ecosystem for implementing these state-of-the-art pre-trained models, making it an ideal choice for this experiment. [32] Utilizing pre-trained model has a lot of advantages. It is environmentally friendly, as it reduces the computational resources required for training a model from scratch. [31] It also saves time and requires less data, making it particularly suitable for tasks with limited datasets. The pretrained HuBERT model comes with a well-learned understanding of general audio patterns, which can be fine-tuned for specific tasks like bee sound classification. This approach not only accelerates the training process but also enhances the model's ability to generalize from the provided data.
VI. RESULTS
The results of our experiment demonstrate a significant breakthrough in the field of acoustic classification of bee sounds, achieving an unprecedented accuracy of 99.7%. This marks the highest accuracy reported in the literature for this type of problem, indicating the robustness and effectiveness of our approach. The model's exceptional performance underscores the advantages of leveraging the HuBERT architecture, particularly when fine-tuned with augmented and diverse datasets. The code for the experiment is wrapped into a Python library and shared in GitHub repository. [33]
After training, which took approximately seven hours on a system equipped with a 13th Gen Intel (R) Core (TM) i7-13700H processor (20 CPUs, ~2.4 GHz) and 32GB of RAM, the model is well-suited for deployment in real-world applications. For practical implementation, the trained model can be integrated with platforms like Weights & Biases, which facilitates hosting and managing the model for live predictions. In a real-world scenario, a Raspberry Pi or similar device with the appropriate microphones and sensors attached can be installed within a beehive to record the acoustic environment continuously. [34] This data can then be transmitted to the cloud, where the model processes it and provides real-time insights into the hive's state.
This integration of advanced machine learning techniques with accessible hardware and cloud platforms represents a promising direction for precision beekeeping, enabling beekeepers to monitor and respond to hive conditions with unprecedented accuracy and timeliness.
VII. CONCLUSION
This study explores the application of transformer models to classify bee acoustic data, focusing on detecting significant hive events such as the departure of the queen. By employing the HuBERT model, which is adapted from text-based transformer architectures, we achieved an accuracy of 99.7% in identifying hive conditions. This represents a substantial improvement over previous methods and illustrates the potential of advanced machine learning techniques in ecological monitoring.
The integration of HuBERT with labeled acoustic data and data augmentation strategies has demonstrated exceptional performance, paving the way for more efficient hive monitoring. This approach not only streamlines the process for beekeepers but also enhances the ability to respond promptly to critical hive events. Future research could expand on these findings by applying the model to various bee species and environments, potentially leading to even greater advancements in precision beekeeping and ecological management.
Conflict of Interest
The authors declare no conflict of interest.
Ethical Approval
Not applicable
Data Availability
The datasets used in this study are openly available at [repository link] and the source code is available on GitHub at [GitHub link].
Funding
This work did not receive any external funding.
References
Cite this article
Related Research


Special Issue
Launch a focused special issue to highlight research, emerging trends, and expert insights in your academic field.