


IntelliPaper
Abstract
This study aimed to generate economics information on sustainable forest management in the state of Acre. Data collection addressed the following points: 1) prices of forest land and timber logs; 2) development and implementation of the Sustainable Forest Management Plan (SFMP) and the Annual Operational Plan (AOP); 3) forest harvesting and 4) timber transport to the sawmill. Basic data were obtained through interviews with forest consultants, timber industry entrepreneurs, and owners of firms involved in forest extraction. Different scenarios were considered: forests located $50 mathrm{km}$, $100 mathrm{km}$, and $150 mathrm{km}$ from the city of Rio Branco; managed areas with and without permanent plots; and with the application of silvicultural treatments. The production cost was obtained using different interest rates, and a 25-year cutting cycle was adopted. In economic terms, forest management activities were evaluated by calculating the net present value (NPV) and the production of log delivered to the sawmill yard was evaluated by calculating the marketing margin. The results generated in this study on forest management practices in the state of Acre allowed us to infer the following main conclusions: 1) the average cost of producing standing timber in an area located $50 mathrm{km}$ from the Rio Branco timber hub increases by approximately $0.82\%$ with the installation and measurement of permanent plots throughout the cutting cycle and 2) the marketing margin for logs indicates that for more distant areas ($150 mathrm{km}$)) this activity is unfeasible.
Explore Digital Article Text
Introduction
Morales-Hidalgo et al. (2015) state that forests provide ecosystem goods and services, as food, water, shelter, and nutrient cycling, and play a key role in biodiversity conservation. Macdicken et al. (2015), in turn, argues that these resources can contribute significantly to the economy and ensure livelihoods and environmental protection.
Keenan et al. (2015) reveal that forests cover about 30% of the global land area, and 44% of these are distributed in tropical countries. Food and Agriculture Organization of the United Nations (FAO) (2016) states that the second largest forest area in the world is in Brazil. Strand et al. (2017) add that the Amazon Basin occupies about 60% of Brazilian territory, which, according to Assunção et al. (2017), is the largest continuous expanse of tropical forests in the world. Given this reality, Fearnside (1997) and Hamaoui JR. et al. (2016) consider that the proper use of this biome is key to global balance, as it plays an important role in global carbon and water cycles and temperature patterns.
However, Azevedo-Ramos (2010) warns that the timber sector in the Amazon, for decades, using techniques with high environmental impact and high wood waste, has been associated with the destruction of the forest. In view of this fact, Higuchi (1994) and Sabogal et al. (2006) suggest Sustainable Forest Management (SFM) as the forest exploitation practice that has the potential to ensure the sustainable use of this natural resource. Brandt et al. (2016) point out that a growing portion of tropical forests is managed to achieve biodiversity conservation, forest protection, and increased income.
It is worth to highlight that in sustainable forest management is knowledge of its economic aspects. In timber production in the Amazon, this study would have the potential to support decision-making by local forest firms, and the identification of costs will underpin other economic research in the region. These ideas are based on Barreto et al. (1998), who argue for the need for detailed cost-benefit analyses of management to support the debate on forest use. Furthermore, Applegate et al. (2004) argue that most timber entrepreneurs are not fully aware of the costs of timber harvesting.
It is worth noting that Barreto et al. (1998), Boltz et al. (2001), De Graaf et al. (2003), Holmes et al. (2001) and Holmes et al. (2002) identified the costs of forest management in the Amazon. However, each region of the Amazon has peculiarities, such as forest stock and variation in the stumpage price which affect costs. Thus, it is recommended to carry out studies using data collected in different areas of this biome.
According to Amaral et al. (2012), the state of Acre has 87% of its territory covered by natural forest. Given this scenario, studies such as Machado (2013), Silva (2003), Silva and Santos (2011) and Silva (2015) have calculated the management costs in Acre. However, research identifying the cost of forest management implemented at different forest-to-sawmill distances is needed, considering or not the installation and measurement of permanent plots (PP) and the adoption of silvicultural treatments (ST).
Given the above, this study aimed to generate economics information on sustainable forest management in the state of Acre. Specifically, it aimed to: 1) quantify the cost of producing logs delivered to sawmills, at different forest-to-sawmill distances, considering management with or without the installation and measurement of permanent plots (PP) and the application or not of silvicultural treatments (ST) and 2) identify the profit margin for logs delivered to sawmills in Acre.
MATERIALS AND METHODS
Materials
Study Area
The study area is the state of Acre, in the Amazon, between latitudes 07°07’ S and 11°08’ S and longitudes 66°30’ W and 74° W. This state has an area of 164,221.36 km² (4% of the Brazilian Amazon), and borders Peru, Bolivia, and the states of Amazonas and Rondônia (Acre, 2010). Figure 1 summarizes this information.
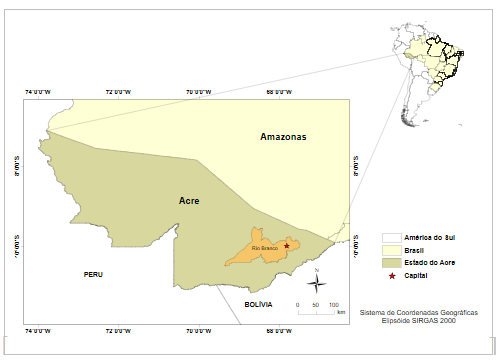
According to the Brazilian Institute of Geography and Statistics (IBGE) (2016), the population of Acre is 816,687 inhabitants, of which 46.17% reside in Rio Branco.
In the state of Acre, the climate is of the hot and humid equatorial type, characterized by high temperatures, high rainfall levels, and high relative humidity, with an average annual temperature of around 24.5°C (ACRE, 2010). According to the Köppen-Geiger climate classification, Acre presents two climate subtypes: Tropical humid or Equatorial (Af) and Tropical monsoon (Am) (Kottek et al., 2006).
The main hydrographic basins of Acre are the Purus River and the Juruá River basins, located in the central and eastern region and in the west of state, respectively. All rivers and streams belong to the Amazon River hydrographic network (Guilherme, 2016).
Argisol soil classes cover approximately 40% of the state’s area, followed by Cambisols, which occupy about 30% of the territory (ACRE, 2006).
According to Acre (2010), two large phytoecological regions predominate: Dense Ombrophilous Forest and Open Ombrophilous Forest, with the individual or simultaneous occurrence of different plant formations (vines, bamboos, palm trees). There is a third region, the Campinarana, restricted to the northwestern part of the State.
Local Forestry-Timber Production Process
The stages of log production, originating from management plans in Acre, adopt the procedures required by federal legislation, such as Decree 5.975/2006 (Brazil, 2006a); Normative Instruction (IN) of the Ministry of the Environment (MMA) No. 05/2006 (Brazil, 2006b); IBAMA Execution Standard No. 01/2007 (Brazil, 2007); Conama Resolution No. 406/2009 (Brazil, 2009); MMA IN 01/2015 (Brazil, 2015); and state legislation: Joint Resolution CEMACT/CFE No. 003/2008 (Neves, 2009).
The stage of preparing the Sustainable Forest Management Plan (SFMP) and the Annual Operational Plan (AOP) includes pre-exploration activities, carried out one year before exploitation, and necessary for the licensing of these documents (Thaines, 2013). The first phase of the process is the preparation of the SFMP, with the execution of a sample forest inventory in the Forest Management Unit (FMU) (Espada et al., 2013), in order to collect qualitative and quantitative data on the forest (BRASIL, 2009).
The area to be exploited in a given year is called the Annual Production Unit (APU), where a 100% forest inventory is carried out (Balieiro et al., 2010). Microzoning identifies permanent preservation areas, areas of liana thickets and bamboo (BRASIL, 2007). Then, the Annual Operational Plan (AOP) is prepared, which is the planning document for exploitation in the APU (Balieiro et al., 2010), containing data on the species and volume to be exploited, trees to be maintained, planned activities such as road and yard construction, exploitation and post-exploration procedures (BRASIL, 2007).
Once the AOP is prepared, in accordance with Joint State Resolution CEMACT/CFE No. 003/2008, legislation that guides the licensing, monitoring, and inspection of forest management in Acre, the Sustainable Forest Management Plan (SFMP) and the AOP are submitted to the Acre Institute of the Environment (IMAC).
To assess the damage caused by logging, permanent plots (PPs) are installed and measured before intervention in the forest, and remeasured after exploitation (Oliveira et al., 2004). The cutting of vines occurs before harvesting, when planned (BRASIL, 2007).
According to Joint Resolution CEMACT/CFE No. 003/2008, after the licensing of the SFMP/AOP, the responsible environmental agency, within its attributions, issues the Operating License (OL) and the Authorization for Exploitation (AUTEX).
Logging activities are carried out after the issuance of the OL and AUTEX, which, according to Thaines (2013), include the construction of roads and storage yards; tree cutting; skidding planning, marking of skidding trails; skidding of logs to the yards; yard operation, such as log measurement, organization, loading, and transshipment (intermediate transport of logs from storage yards in the forest to a central yard usually located near consolidated transport infrastructure, such as paved roads. Espada et al. (2013) comment that the transport of logs occurs from the forest to the industry yard.
After the exploitation of the APU, an Activity Report must be submitted to the environmental agency (Brazil, 2009), detailing the activities carried out and the volume effectively exploited in this APU (Brazil, 2006b). Among the post-exploration activities, there are also: infrastructure maintenance; monitoring of forest growth (when foreseen in the SFMP), through measurement of the installed PP and carrying out silvicultural treatments and forest protection, when foreseen in the management plan (Thaines, 2013).
Data Collection
Considering procedures adopted by Silva (2015) and Silva and Santos (2011), data collection for this study focused on the following factors: 1) Price of unmanaged forest land; 2) Price of forest raw materials; 3) Development and execution of the SFMP/AOP; 4) Forest harvesting; and 5) Transportation of logs to the sawmill.
The basic data used to quantify the cost of log production were obtained through interviews using a specific questionnaire. Interviews were chosen because, according to Gil (2008), this procedure allows for greater contact with the reality experienced by social actors and, according to May (2004), this form of data collection generates rich understandings of experiences and opinions on a given subject.
The interviews focused on the city of Rio Branco, since according to Acre (2010), this city concentrates 63% of the Acrean timber industries, in addition to 69% of the direct jobs in the timber industry sector throughout the state of Acre. According to Lentini et al. (2005), Rio Branco represents the main timber hub of this state.
The interviews took place in December 2016 and addressed the agents involved in activities related to SFM carried out in Acre: 1) Forestry engineers who prepare and execute SFMP and AOP in the region; 2) Sawmill owners who carry out SFM to supply wood to their companies; 3) Logging executor and 4) Forestry engineers, responsible, at IMAC, for licensing forest management activities.
Data collection was carried out according to an accessibility sampling method, as described by Gil (2008). Thus, interviewees were selected according to the interviewer’s accessibility to them, assuming that the interviewees could, in some way, be representative of the researched universe.
The engineers from IMAC provided specific data on the SFMP licensing process and its respective fees, such as the amounts charged for inspection and the license. These interviewees also contributed data on the management practices in Acre, such as the length of roads (km) and the number of storage yards in the AOPs.
The questionnaire was applied to consultants, sawmill owners, and the forestry extraction company. Data regarding land prices at different forest-to-Rio Branco distances were obtained from a real estate agency located in Rio Branco.
The timber entrepreneurs and forest consultants interviewed provided data on the price of logs, delivered to sawmills, for different species, as practiced in the local market.
Following the procedure adopted by Silva and Santos (2011), the data were broken down into physical and economic values, as indicated below.
The physical values obtained, as suggested by Machado (2013) and Silva and Santos (2011), were those inherent to the SFMP/AOP: 1) average total area of the Annual Production Units, in hectares; 2) average annual volume of timber in logs (m³ year-1) and 3) average volume harvested in the AOPs, per unit area of effective harvesting (m³ ha-1).
Table 1 presents the average data used in quantifying the production cost.
| Items | Unit | Value |
|---|---|---|
| Average total area of the APUs | (ha) | 1,030.56 |
| Average annual volume of timber logs | (m³ year-1) | 12,400.00 |
| Average volume extracted at the APUs | (m³ ha-1) | 14.71 |
Characterization of Annual Production Units (APUs), state of Acre, 2016.
Economic data refers to land prices, log prices, service provision and operational costs, according to Silva (2015) and Silva and Santos (2011).
It should be noted that, due to the difficulty in obtaining detailed cost data for certain activities, the price charged for carrying out these operations was considered as a proxy value to represent these costs, according to the procedure adopted by Silva (2015). Thus, for the items of preparation of the SFMP/AOP, forest census, installation and measurement of permanent plots and post-exploration report, the prices charged by forestry consultants to perform such services were taken into account. In the operations of cutting, skidding, loading, transshipment, reloading, support camp, and forest transport, the price paid by sawmills to the firms providing these services was adopted.
In the planning of a APU, according to IN 05/2006 (BRAZIL, 2006b), the volume exploited is that per area of effective forest exploitation: the area effectively exploited in the APU, not counting the Areas of Permanent Preservation (APP) and infrastructure.
The costs of SFM were quantified per area of effective exploitation. From the data collected on AOPs, it was considered that the unexploited areas (APPs) correspond on average to 18% of the total area of the APU. Thus, an average area of 845.06 ha of effective exploitation was obtained (82% of a UPA with 1,030.56 ha).
Thus, the prices charged for the total area of the APU were converted to effective area, multiplying the conversion factor (1.21951 - obtained by dividing the average total area of the APU by the effective harvest area).
It was found that sawmill owners in Acre, when they do not own their own forest area, enter into a contract with the owners of forest lands. The landowner charges a price per unit area (hectares) for this timber firm to exploit the forest under a Sustainable Forest Management Plan (SFMP) regime. This allows these companies to be responsible for the execution and holders of the SFMP/POA.
The average price obtained in the interviews was R\$ 557.14 ha-1. According to those interviewed, the payment method, which depends on the negotiation, may have the following options: 1) the total amount is paid in three installments; 1st installment 30% after issuance of the AUTEX; 2nd installment 30 days after the start of exploitation and the 3rd installment 90 days after the start of exploitation; 2) the total amount is paid in twelve installments, with the first installment paid after issuance of the AUTEX and the remaining installments monthly; and 3) the total amount is paid in three installments, 1st installment 30% after issuance of the AUTEX, the 2nd installment 40% in the month the exploitation begins and the 3rd installment 30% at the end of the exploitation.
To calculate the stumpage price, the average contract price (R\$ 557.14 ha-1) was divided by the average volume harvested from the APUs (14.71 m³ ha-1), resulting in R\$ 37.86, which corresponds to the value paid per cubic meter of log harvested.
The average price to prepare and execute the SFMP/AOP is R\$ 87.50 ha-1 (for the total area of the APU). The price for the area of effective harvesting was R\$ 106.71 ha-1.
The taxes levied on the preparation of the SFMP/AOP are related to the provision of services: 1) Withholding Income Tax (IRRF); 2) Social Integration Program (PIS); 3) Contribution to Social Security Financing (COFINS); 4) Social Contribution on Net Profit (CSLL) and 5) Tax on Services of Any Nature (ISS).
It should be noted that these taxes correspond to 16.15% of the price charged for preparing the SFMP/AOP. Thus, considering that the average price for preparing the SFMP/AOP is R\$ 106.71 ha-1, a value of R\$ 17.23 ha-1 was obtained.
The average cost of notary documentation was R\$ 0.28 ha-1, obtained by dividing the cost by the average area of effective exploitation (845.06 ha). The notary fees involve the following items: 1) signature authentication; 2) registration of the legal reserve area on the margins of the rural property registration; 3) property certificate; registration of the Term of Responsibility for the Maintenance of Managed Forest (TRMFM) and 4) Term of Forest and Technical Responsibility (TRFT), if the preparation of the SFMP is carried out by a technician different from the preparation and execution of the AOP.
The fees with the Regional Council of Engineering and Agronomy (CREAA)/Technical Responsibility Annotation (ART) refer to the payment of the ART of the technician responsible for the preparation and/or execution of the SFMP/AOP. The average cost with ART was R\$ 0.10 ha-1, obtained by dividing the cost by the average area of effective exploitation (845.06 ha).
In addition to federal legislation, SFM licensing follows guidelines and procedures from Joint Resolution No. 003, of August 12, 2008, of the State Council for the Environment, Science and Technology and the State Forestry Council.
The licensing costs are the costs for licensing the SFMP and the AOP with IMAC. The items involved in this process are licensing fee, calculated based on the total area of the APU; technical inspection fee; travel fee, calculated based on the distance to the managed area and administrative fee. The total value is multiplied by two years, the validity of the OL and AUTEX. A simulation was carried out, together with a person responsible for the Forest Management sector in the environmental agency. The average total area of the APUs (Table 1) was considered, located at different distances from Rio Branco (50 km, 100 km and 150 km). The cost for the total area was R\$ 3.82 ha-1 (50 km), R\$ 4.55 ha-1 (100 km), and R\$ 5.27 ha-1 (150 km). The cost converted to effective area was R\$ 4.66 ha-1 (50 km), R\$ 5.55 ha-1 (100 km), and R\$ 6.43 ha-1 (150 km).
The interviewees revealed that the average price charged by consulting firms for conducting a 100% forest inventory was R\$ 42.80 ha-1. It should be noted that this value is included in the price charged for preparing the SFMP/AOP.
Permanent plots (PPs), as reported by Silva et al. (2005), serve to monitor the growth dynamics of managed forests through continuous forest inventory (CFI), and should be established in forest production areas. However, conducting the CFI is optional, being mandatory only to justify the adoption of parameters different from those presented in Normative Instruction No. 5, of the MMA, of December 11, 2006, such as, for example, the alteration of the cutting cycle.
To identify the costs of implementing and measuring PPs, two data sources were used: the responses of the interviewees and the work of Santos (2007). Thus, the data obtained generated an average cost of R\$ 3.00 ha-1. In Santos (2007), studying the installation and measurement of a permanent plot in the Antimary State Forest, in the state of Acre, in 2005, the cost found was US\$ 432.26 per plot. Following procedures presented by Oliveira et al. (2004), it was assumed that a PP should be installed for every 250 ha of managed area. Thus, a cost of US\$ 1.73 ha-1 was obtained. Given these values, the average cost to install and measure permanent plots was found to be US\$ 1.15 ha-1.
Oliveira et al. (2004) state that plots should be measured again the year after harvest, and from then on the intervals between measurements should be two to five years. To identify the costs of this activity, in addition to data obtained through interviews, with an average value of R\$ 2.50 ha⁻¹, the cost of US\$ 314.11 for remeasurement of plots, found by Santos (2007), was used. Considering that a permanent plot should be installed for every 250 ha of managed area, the cost for remeasurement of plots is US\$ 1.26 ha⁻¹. The average cost of remeasurement of permanent plots obtained was US\$ 0.89 ha⁻¹.
As verified in the interviews, the holder of the management plan must present to IMAC copies of the publication in the State Official Gazette and a local daily newspaper of the licensing request and receipt. Furthermore, according to Joint Resolution CEMACT/CFE No. 003/2008, upon receiving the LO and the AUTEX, the holder must affix signs indicating the forest management area on the property before exploitation. The average cost of these activities, obtained by dividing the cost by the average area of effective exploitation (845.06 ha), was R\$ 0.52 ha-1.
According to CEMACT/CFE Resolution No. 003/2008, the post-exploration (or activity) report must be submitted to IMAC before requesting a new AOP or up to one hundred and eighty days after the completion of the actions described in the AOP of the exploited APU (Neves, 2009). Consultants charge an average price of R\$ 4.46 ha-1 (total area) to prepare the document, or, R\$ 5.40 ha-1 to the area of effective exploitation.
Logging is generally carried out by third-party firms, which are responsible for all operations, from felling to unloading the logs at the storage yard. To quantify the costs of this process, the price paid by the timber industries to the contracted firms was considered, as well as the price charged by the service provider itself. It should be noted that payment for these activities is based on the cubic meter of logs exploited, in commercial measure. The commercial measure adopted in Acre’s sawmills is an adaptation of the Francon method or the reduced 4th method. This method yields the volume of a squared log (BRASIL, 2003). According to information obtained in interviews, the measurement adopted by Acre’s timber merchants involves a modification, in which the sapwood is deducted from one of the measurements of the smaller diameter face of the log.
The average price paid/charged for the construction of roads and yards, obtained from data collection, was R\$ 9.75 m-3. However, it was decided to calculate the cost separately for roads and yards, based on AOPs data obtained from the interviews.
The average price for renting machinery to open the infrastructure, obtained from the interviews, of R\$ 2,150.00/km of road (4 m wide) was adopted. In addition, since the management projects have an average of 0.032 km of roads/ha (effective area), a cost of R\$ 68.80 ha-1 was obtained. This value was divided by the average volume exploited in the APUs (14.71 m³ ha-1), and a cost of R\$ 4.68 m-3 was obtained for opening roads.
For the activity of opening yards, according to AOPs data, it was considered that on average, an yards infrastructure of 500 m² (20 x 25m) corresponds to 0.44% of the effective area of a APUP. The average effective exploitation area obtained in this study (845.06 ha) was used, resulting in a total yard area of 37,182.64 m². Thus, considering that 1 km of road 4 m wide corresponds to 4,000 m² (0.4 ha), and that the cost for opening 4,000m² is R\$ 2,150.00, the total cost for yards is R\$ 19,985.67. Considering the average effective area and the average exploited volume obtained in this study, the cost for opening yards is R\$ 23.65 ha⁻¹ or R\$ 1.61 m⁻³.
Another point to highlight is that, in calculating the cost of forest extraction, it was assumed that this activity can occur in two ways: one operation including the transport of logs between storage yards in the forest and a yard located near a paved highway; and another without this kind of transport. It should be noted that kind of transport allows the company to supply itself with logs year-round, because during the rainy season, trucks are prevented from traveling on unpaved roads within forest areas, and companies are supplied by logs deposited in the yard near paved roads, known as the "esplanada" (storage area). From the above, this study presents a scenario where a company in Rio Branco operates year-round. Thus, during the dry season (four months), it supplies itself without using that kind of transport, while during the remaining eight months, it uses this kind of transport to supply its logs. Therefore, the average final cost of forest exploitation for this firm resulted from a weighted average of the costs with and without this kind of transport, where the weight used was the percentage share that each of these exploitation systems has in the total volume of logs processed by the firm, 67% and 33%, respectively.
The average prices for cutting, skidding, loading, transshipment, reloading, and support camp operations were R\$ 9.38 m-3, R\$ 25.36 m-3, R\$ 8.58 m-3, R\$ 15.00 m-3, R\$ 7.75 m-3, and R\$ 11.75 m-3, respectively. Support infrastructure costs include camp, helper, food, and cook. The average costs of exploitation, with transshipment, were R\$ 84.11 m-3 and without transshipment, were R\$ 61.36 m-3.
The transportation of timber is carried out by service providers, with the log placed in the sawmill yard. The freight costs for forest-sawmill distances of 50, 100, and 150 km were R\$ 40.83 m-3, R\$ 72.00 m-3, and R\$ 93.33 m-3, respectively.
Silva et al. (2005) comment that administrative costs account, on average, for 17.5% of the annual subtotal costs. These costs, according to Silva and Santos (2011), involve costs for accounting, office, and field supervision services.
During the interviews, data on the costs of issuing invoices for rural producers were obtained. Subsequently, a document issued by the State Finance Secretariat was found to indicate that, for the transport of logs within the state of Acre, the issuance of an Electronic Invoice is not required. However, the document states that if an invoice is issued for the raw product (logs), the field relating to the Tax on the Circulation of Goods and Services (ICMS) does not need to be filled in.
Therefore, it was decided to consider the issuance of the invoice when quantifying the production cost. In addition, it was taken into account that, according to interview data, an invoice must be issued for each truckload, with a volume between 40 and 60 cubic meters, and the cost to issue an invoice is R\$ 3.00. Thus, a cost of R\$ 0.06 m-3 was obtained for issuing the invoice, for an average volume per truckload of 50 m³.
Some respondents reported that there are tax costs associated with the sale of logs, with 2.25% of the gross value of the logs being collected for the Rural Worker Support Fund (Funrural). Thus, since the average price practiced in the local market for logs delivered to sawmills was R\$ 256.7 m-3, the cost of Funrural collection is R\$ 5.78 m-3.
Forestry consultants and sawmill owners reported that income tax costs account for 27.5% of the net profit from the sale of logs.
The secondary data used in this study were data from AOPs executed in the state of Acre, referring to the length of roads (km) and total area of storage yards (m²).
Operational cost data for PP in a management area in Acre were used, from Santos (2007). Costs concerning post-exploration silvicultural treatments in a management area in the Amazon were obtained from the study by Ferreira (2012). Cost data for the pre-exploration activity of vine cutting were obtained from the work of Thaines (2013).
Cutting vines intertwined with the trees to be harvested and neighboring trees is recommended to avoid the undue fall of trees and the risk of accidents for the field team (Balieiro et al., 2010). It is recommended that this activity be carried out at least one year before harvesting, preferably along with or immediately after a 100% forest inventory (Fundação Floresta Tropical (FFT), 2002).
Due to the difficulty in obtaining data for cutting vines activity during data with the interviewees, the cost presented by Thaines (2013) was considered. This author takes into account that the vine cutting team in an exploration area of 1,000 hectares, in the Tapajós National Forest, in Pará, was composed of four workers, and the remuneration for the 1,000 ha undertaking was R\$ 6,000.00, which corresponds to R\$ 6.00 ha-1.
Post-logging silvicultural treatments include the release of remaining commercial trees through thinning, girdling of competing trees, or cutting of vines; the management of natural regeneration; enrichment plantings in clearings, among others (Espada et al., 2013). The cutting of vines should be repeated after logging on the remaining trees to facilitate their development (FFT, 2002).
The adoption of silvicultural treatments (TT) in managed areas in Acre is incipient or non-existent, which made it impossible to obtain data for this activity. However, since this study considered scenarios that include such activity, data from Ferreira (2012) were used, who determined the installation, monitoring, and maintenance costs of different post-harvest silviculture systems in a managed area in the municipality of Paragominas, Pará. The treatment selected contained the activities: 1) thinning for release, by girdling; 2) cutting of vines in the treated trees and 3) planting in clearings. The installation cost was R\$ 96.80 ha-1 while the monitoring and maintenance costs was R\$ 37.70 ha-1.
To correct for inflationary effects on the economic values used in this study, the prices and costs considered were converted from Brazilian Real (R\$) to US Dollar (US\$). To do this, the official exchange rate for the sale of the US dollar was consulted on the website of the Central Bank of Brazil (BCB). Therefore, using the 15th (or the next business day) of each month of 2016 as a reference, the average exchange rate obtained was US\$ 1.00 = R\$ 3.5009.
Methods
Quantification of the cost of producing logs, harvested in a managed area and delivered to the timber company’s yard, in the state of Acre
This calculation is justified by the words of Sasaki et al. (2016), who state that cost is the main concern for adopting Reduced Impact Logging (RIL). Thus, since RIL is the concept used in forest exploitation adopted in the state of Acre, its economics evaluation will contribute to the evaluation of sustainable forest management as a whole.
The quantification of the cost of log production followed a procedure adapted from the method indicated by Silva (2015), summarized in the following expression.
Where: is the production cost (minimum price) of logs harvested in a managed area and delivered to the sawmill’s yard (US\$ m-3); refers to the production cost (minimum price) of stumpage in a managed area; refers to the cost of logging activities in an area under the SFM regime (US\$ m-3); is the cost of transporting logs from the managed area to the sawmill (US\$ m-3);
is the cost of issuing the invoice for the logs (US\$ m-3); is the cost related to the collection of Funrural (US\$ m-3); and is the cost of income tax on net profit (US\$ m-3).
Cost of production of stumpage in a forest management area in the state of Acre
The cost of production of stumpage was calculated as indicated by Silva (2003), being obtained through expression (2):
Where: refers to the average stumpage price (US\$ m-3); is the cost of producing the SFM to be carried out (US\$ m-3).
The , as indicated by Silva (2003), is the price paid for stumpage to the forest owner, described previously. The involves the costs of forest management operations (in R\$ ha-1), described in the previous section, obtained through expression (3):
Where: represents the total cost of AFM activities in the year (US\$ ha-1); refers to the average volume harvested per area of effective exploitation (m³ ha-1); is the opportunity cost of capital (interest rate), expressed as a decimal (p.a.); represents the year in which a given cost occurs; and is the year in which logging takes place.
Net present value (NPV) of SFM activities
The economic viability of MFS activities was verified by calculating the NPV, according to the following expression (4), presented by Rezende and Oliveira (2011):
Where: is the net present value of SFM activities (US\$ ha-1); is the cost of SFM operations at the end of the year (US\$ ha-1); is the revenue at the end of the year (US\$ ha-1); is the project duration, in years and is the year in which the revenue or cost occurs.
Revenue was obtained by multiplying the minimum price of stumpage by the average volume harvested in the APUs (14.71 m³ ha-1). According to Silva and Fontes (2005), when a project that has an NPV greater than zero, it is economically viable.
The cost of production comprises activities related to logging, which includes the costs of road and yard infrastructure, cutting, skidding, loading, timber forwarding, reloading, and support infrastructure.
It should be noted that the final cost of the operation was obtained by the weighted average of the costs of the logging systems with and without timber forwarding. To meet the demand for wood, a sawmill may or may not carry out timber forwarding during forest exploitation. It was considered that a sawmill operates year-round, when the system without timber forwarding occurs in four months (weight of 0.33), during a year of operation of the timber company, while the system with timber forwarding has a participation of eight months (weight of 0.67) in production. Thus, during logging in the dry season, for every three trucks, two carry out timber forwarding of the production and one goes directly to the sawmill in Rio Branco.
involves the cost of transporting the log from the forest to the sawmill yard in Rio Branco. in turn includes the cost of issuing the invoice for transporting the log within the state of Acre. While is the cost generated by the collection of Funrural, at the time of sale of the log. Finally indicates the cost of Income Tax on the net profit from the sale of the log.
The net profit was obtained using expression (5):
Where: is the net profit from the sale of logs (US\$ m-3); is the gross revenue from the sale of logs, in other words, the average local price of logs (US\$ m-3); and is the sum of the costs of log production (US\$ m-3), obtained using the expression (6):
Next, the income tax () was calculated using the following expression (7):
Where is the income tax on the net profit from the sale of the log (US\$ m-3).
The cost of production was quantified and analyzed considering three types of situations: 1) based on the distance from the forest to the sawmill in Rio Branco; 2) whether or not the forest has permanent plot (PP) measurements and 3) based on the application or not of post-harvest silvicultural treatments (ST).
It is worth mentioning that the scenarios with plots include the installation, measurement, and remeasurement of PP. The situations with treatments, in turn, in addition to the installation, measurement, and remeasurement of PP, include the activities of installation, monitoring, and maintenance of silvicultural treatments (ST). Furthermore, a 25-year cutting cycle was adopted as the planning horizon for the SFM, which complies with CONAMA Resolution No. 406/2009.
As already mentioned, for quantifying the cost of log production from SFM, addressed three scenarios, namely, forest located 50 km, 100 km and 150 km from the sawmill in Rio Branco. In addition, for each of these scenarios, the possibility of the SFM analyzed having or not having the installation and measurements of permanent plots (PP) was given. Finally, for each of the situations mentioned, the possibility of carrying out or not silvicultural treatments (STs) in the management addressed was considered.
In addition, different interest rates were used to analyze the behavior of forest production costs, as recommended by Pearse (1990) and Wagner (2012). As suggested by Lima Júnior et al. (1997), the rates used in forest projects vary from 6 to 12% per year. Therefore, discount rates of 6% a.a., 8% a.a., 10% a.a. and 12% a.a. were adopted, following the procedure of Silva and Santos (2011).
It should be noted that the price of land was included in the cash flow as a cost in year zero and an income at the end of year 24, as adopted by Silva and Santos (2011). Thus, it is assumed that the land is acquired at the beginning of the cutting cycle and sold at the end of it.
Regarding silvicultural treatments (TTs), for the cash flow, the following guidelines from Ferreira (2012) were followed: the installation costs of the TTs occur one year after exploitation, while maintenance and monitoring costs occur annually for the first five years, and thereafter, every five years, until the end of the cutting cycle.
Marketing Margin for Logs Delivered to Sawmills
The absolute (or gross) marketing margin for logs was calculated using expression (8), indicated by Mendes and Padilha Júnior (2007):
Where: is the absolute marketing margin for logs from managed areas in Acre (US\$ m-3); is the average price of logs, harvested in managed areas and delivered to the sawmill yard, played in the local market (US\$ m-3) and is the production cost of logs, harvested in a managed area and delivered to the sawmill yard (US\$ m-3).
The marketing margin was used as an indicator of profit or loss in log production, in the different scenarios adopted. For this, the average price of logs practiced in the local market, obtained in the data collection, used as income, was R\$ 256.7 m-3.
RESULTS AND DISCUSSION
Cost of stumpage production in the state of Acre, 2016
The average selling price of stumpage in the Acrean timber market in 2016 was US\$ 10.82 m-3. It should be noted that it was verified that there is no differentiation in prices for the different groups of species, of higher or lower commercial value, since the negotiation occurs according to the size of the UPA. However, by way of comparison, the stumpage price in Acre in 2008, presented by Silva (2015), was differentiated for three groups of commercial species: noble species (US\$ 27.12 m-3); hardwood species (US\$ 21.81 m-3) and softwood species (US\$ 22.76 m-3). In turn, the average market price of stumpage, presented by Silva and Santos (2011), in a study carried out in the state of Acre in 2011, was US\$ 25.16 m-3. From the above, it can be seen that the price found in this study is considered lower compared to the values presented in previous studies.
It was noted that the average volume harvested in the managed forests of Acre, according to the data obtained in this study (14.71 m³ ha-1), did not reach the maximum cutting intensity of 30 m³ ha-1 (when using machines for log skidding), foreseen in Conama Resolution No. 406/2009 (BRAZIL, 2009). The volume harvested is considered low, compared to the average harvest value of 25.36 m³ ha-1, observed in the study by Holmes et al. (2002), carried out in Paragominas, state of Pará. It is emphasized that the volume exploited directly affects the costs of log production.
The interviewees stated that the commercial volume harvested in managed areas in the state of Acre rarely reaches the maximum allowed by law. One of the main factors that interfere with the volume harvested in a managed area refers to the species demanded by the market. For example, in the preparation phase of an Annual Operational Plan (AOP), it is planned to exploit a certain species, selecting it for cutting. However, in the year of harvesting, this species has a low commercial value, causing the decision-maker to choose not to exploit all the individuals of this species selected for cutting, or even to decide not to exploit it, thus reducing the volume of cutting. In addition to this factor, the characteristics of the forest considerably interfere with the volume harvested. According to Hosokawa et al. (1998), the productivity of native forests is influenced by the productive capacity of the soil and the heterogeneous distribution of species in the area.
Ferreira (2014) states, the Acrean forests are characterized by the dominant presence of bamboo species of the genus Guadua. According to Silveira (2001), bamboo dominance can limit the competitive ability of tree species with low adaptive capacity to the environment, leading to alterations in floristic composition and a reduction of almost 40% of species in a one-hectare sample. Furthermore, that bamboo alters the forest structure, decreasing density and basal area. Ferreira (2014) cites that, during logging, clearings are created in the forest canopy, providing abundant physical space and light, which are extremely favorable to bamboo development. So, it is emphasized the need to understand the conditions that favor the appearance of bamboo, its growth rate, and the time it takes to dominate a given forest area. This author also argues that this information is urgent for the case of the forests of Acre, since it is in the central and eastern regions of the state, where the bamboo forests are concentrated, that logging is most intense.
Thus, it is understood that timber production in these forests can vary from region to region and according to the predominant type of vegetation, where certain areas may present a higher occurrence of individuals of species with greater commercial value.
The costs of SFM, in native forest areas in the state of Acre, for the year 2016, are presented in Table 2.
| With PP | Without PP | With PP and TS | With PP | Without PP | With PP and TS | With PP | Without PP | With PP and TS | ||
| With PP | Without PP | With PP and TS | With PP | Without PP | With PP and TS | With PP | Without PP | With PP and TS | ||
| Land price | ||||||||||
| Preparation of SFMP/AOP | ||||||||||
| Taxes | ||||||||||
| Fees for CREA/ART | ||||||||||
| Registry Office | ||||||||||
| Licensing/IMAC | ||||||||||
| Installation/Measurement PPs | - | - | - | |||||||
| Cutting of Vine Trees* | ||||||||||
| Publication and SFMP Sign | ||||||||||
| Subtotal | 283.69 | 282.54 | 283.69 | 240.40 | 239.26 | 240.40 | 188.41 | 187.26 | 188.41 | |
| Administration | ||||||||||
| Total | 333.34 | 331.99 | 333.34 | 282.47 | 281.13 | 282.47 | 221.38 | 220.03 | 221.38 | |
| Post-exploratory report | ||||||||||
| Administration | ||||||||||
| Total | 1.81 | 1.81 | 1.81 | 1.81 | 1.81 | 1.81 | 1.81 | 1.81 | 1.81 | |
| Remediation of permanent plots | - | - | - | |||||||
| Silvicultural treatments | - | - | - | - | - | - | ||||
| Subtotal | 0.89 | - | 28.54 | 0.89 | - | 28.54 | 0.89 | - | 28.54 | |
| Administration | - | - | - | |||||||
| Total | 1.05 | - | 33.54 | 1.05 | - | 33.54 | 1.05 | - | 33.54 | |
| Silvicultural treatments** | - | - | - | - | - | - | ||||
| Administration | - | - | - | - | - | - | ||||
| Total | - | - | 12.65 | - | - | 12.65 | - | - | 12.65 | |
| Remediation of permanent plots | - | - | - | |||||||
| Silvicultural treatments** | - | - | - | - | - | - | ||||
| Subtotal | 0.89 | - | 11.66 | 0.89 | - | 11.66 | 0.89 | - | 11.66 | |
| Administration | - | - | - | |||||||
| Total | 1.05 | - | 13.70 | 1.05 | - | 13.70 | 1.05 | - | 13.70 |
Composition of MFS cost for a 25-year cutting cycle, converted to effective management area, state of Acre, 2016.
The price of forest land located 100 km from Rio Branco is 17.86% lower compared to the price of land 50 km from that city. Conversely, the price of an area 150 km from Rio Branco is approximately 40% lower than the price of land located 50 km from that city. The costs related to forest management licensing increase as the management area becomes more distant. In the simulation carried out in this study, the increase in licensing costs, changing the distance from 50 km to 150 km between the forest and the sawmill in Rio Branco, was about 39%, due to the costs of displacement.
The price of land corresponds, on average, to 70.31% of the total cost of year zero for scenarios with PP and 70.66% for scenarios without PP. The lowest costs correspond to the costs of Technical Responsibility Report (ART), notary documentation, and costs of publication and management signage. It is important to mention that, according to the interviewees, the costs of notary documentation are generally the responsibility of the landowner. It is also noted that the cost for remeasurement of permanent plots decreases by about 23% compared to the cost of implementing and measuring PP in year zero.
The SFM costs at different interest rates are shown in Table 3.
Observing the values indicated in Table 3, it can be seen that the cost of SFM activities tends to decrease with increasing distance from the forest to the sawmill yard. This decrease is related to the price of forest land, which becomes lower as the distance from the timber hub in Rio Branco increases. The average cost of SFM for scenarios with plots was US\$ 253.94 ha-1, US\$ 250.05 ha-1 for scenarios without PP and US\$ 322.81 ha-1 for scenarios with PP and TS.
Table 4 presents a summary of the production cost (or minimum price) of this timber product in managed areas in the state of Acre.
The cost of producing stumpage also decreases with increasing distance, due to the costs of SFM activities. The average cost of stumpage producing, for the different rates analyzed, in an area located 50 km from the timber hub in Rio Branco, increases by approximately 0.82% with the installation, measurement, and remeasurement of PP throughout the cutting cycle. For areas 100 km and 150 km away, the average cost of producing stumpage increases by 0.91% and 1.05%, respectively, with the addition of continuous forest inventory activities.
For areas 100 km and 150 km away, the average cost of stumpage producing increases by 0.91% and 1.05%, respectively, with the addition of Continuous Forest Inventory (CFI)/Permanent Plot (PP) measurement activities.
| Scenario | Description | Interest rate (% p.a.) | SFM Cost (US\$ ha-1) |
|---|---|---|---|
| Scenario | Description | Interest rate (% p.a.) | SFM Cost (US\$ ha-1) |
Cost of MFS in forest areas, the state of Acre, 2016.
It is noted that, if the holder of the Sustainable Forest Management Plan (SFMP) chooses to carry out the CFI in the managed forest, considering the results obtained in this study, there is little change in the final cost. This result was also observed by Machado (2013), when evaluating the cost of timber management in the state of Acre in 2012. The difference in cost in the scenario without PPM allocation compared to the one with plot allocation was 0.80%.
The difference between the average cost of producing stumpage, at different interest rates, with measurement and remeasurement of PP and application of TS after extraction, at 50 km, 100 km and 150 km from Rio Branco, represented an increase of 18.5%, 20.6% and 23.7% in the final cost, respectively, compared to scenarios without these operations.
| Scenario | Description | Interest Rate (% a.a.) | Cost of SFM (US\$ m-3) | Cost of stumpage production (US\$ m-3) | Revenue (US\$ ha-1) |
|---|---|---|---|---|---|
| Scenario | Description | Interest Rate (% a.a.) | Cost of SFM (US\$ m-3) | Cost of stumpage production (US\$ m-3) | Revenue (US\$ ha-1) |
Composition of the cost of producing stumpage, for a 25-year cutting cycle, in a managed area, state of Acre, 2016.
It is observed that the cost of production of stumpage increases with the increase in the discount rate. As an example, this value in scenario 1, calculated at a rate of 12% p.a., is 14.3% higher than that obtained at a rate of 6%. The average revenue for the evaluated rates, for management areas located 50 km, 100 km and 150 km from Rio Branco, is US\$ 516.35 ha-1, US\$ 467.64 ha-1 and US\$ 409.13 ha-1, respectively.
It is also observed that the average production cost in scenarios with PP is US\$ 29.71 m-3, US\$ 29.45 m-3 for situations without PP, and US\$ 35.55 m-3 for scenarios with PP and TS, providing an increase of 174.6%, 172.2%, and 228.6%, respectively, in the minimum price of stumpage.
The increased cost in scenarios with PP and TS is due to the inclusion of different treatments (girdling, vine cutting, and planting in clearings) in the cash flow of MFS activities. According to data obtained from interviews, it was found that the holders of management plans do not include post-harvest treatments in the planning of the UPAs. It should be noted that current legislation does not require the application of these activities, nor the installation of permanent plots; that is, both activities are optional. Only for forest certification purposes, to meet Principle No. 8 (Monitoring and Evaluation) of the Forest Stewardship Council (FSC), should continuous forest inventory be carried out in the management area. It is emphasized that managers do not apply silvicultural treatments after harvesting because they do not believe that this activity provides benefits to the managed forests, and mainly due to the additional costs.
In the state of Pará, research focusing on silvicultural treatments in managed forests is more advanced. Studies such as those by Gomes et al. (2010); Sandel and Carvalhos (2000); Souza et al. (2015) and Taffarel et al. (2014) have been carried out. However, there are few studies involving economic analyses of the application of post-harvest treatments in native forests in the Amazon, among these are: Ferreira (2012), Pinho et al. (2009) and Pires (2014). Despite the studies carried out, Gomes et al. (2010) comment that silvicultural techniques after timber harvesting are rarely adopted due to the scarcity of information on the subject in the Brazilian Amazon.
Net Present Value of MFS
The NPV of MFS activities is presented in Table 5. Positive NPV values indicate that management projects are economically viable. The NPV decreases with increasing interest rates. The average NPV in scenarios with PP is US\$ 145.99 ha-1 while US\$ 146.02 ha-1 in scenarios without PP and US\$ 146.0 ha-1 in scenarios with PP and TS, showing little difference in values.
Despite the profitability of management, there are barriers to applying it on a large scale in the Amazon, such as the higher profitability of agriculture in the short term compared to management and the need for a forest policy including control of forest exploitation, economic incentives for management and logging (Barreto et al., 1998).
| Scenario | Description | Interest rate (% p.a.) | NPV (US\$ ha-1) |
|---|---|---|---|
| Scenario | Description | Interest rate (% p.a.) | NPV (US\$ ha-1) |
Net present value of MFS, the state of Acre, 2016.
The average costs of logging activities in Acre are presented in Table 6.
| Logging Activities | Cost (US\$ m-3) |
|---|---|
| Road opening | 1.34 |
| Yard opening | 0.46 |
| Cutting | 2.68 |
| Skidding | 7.24 |
| Loading | 2.45 |
| Forwarding of timber | 4.28 |
| New Loading | 2.21 |
| Support camp | 3.36 |
| Total with forwarding of timber | 24.02 |
| Total without forwarding of timber | 17.53 |
| Final Cost | 21.87 |
Average cost of logging, state of Acre, 2016.
The results, shown in Table 6, demonstrate that skidding accounts for the largest share of logging costs, followed by hauling, support camp and tree felling operations, which represent approximately 73% of the total logging cost with hauling. The lowest costs are incurred by yard and road construction operations (7.5%) and loading logs onto trucks (10.2%).
Barreto et al. (1998), conducted in the municipality of Paragominas, state of Pará, with a timber volume of 38.6 m³ ha-1, the costs of road and yard opening, felling, skidding, and loading activities were US\$ 0.22 m-3, US\$ 0.07 m-3, US\$ 0.25 m-3, US\$ 1.31 m-3, US\$ 2.59 m-3, respectively. Holmes et al. (2002), analyzing the financial aspects of RIL at Fazenda Cauaxi, also in Pará, the costs of road and yard opening were US\$ 0.16 m-3 for each activity. In cutting, skidding and yard operations, the costs were US\$ 0.62 m-3, US\$ 1.24 m-3 and US\$ 1.28 m-3, respectively. It is noted that the costs found in the present study for such activities are higher. However, it is worth mentioning that characteristics of SFMP, which vary over the years from region to region, influence costs. According to Amaral et al. (1998), the cost of management varies according to the type of forest.
Variations in the stock of commercial species and differences in harvesting projects affect estimates of productivity, costs, waste, and damage (Holmes et al., 2002). Financial comparisons of reduced-impact logging depend on forest and terrain conditions, logging operation planning, the market, and other factors (Putz et al., 2008). Applegate et al. (2004), in turn, argue that the heterogeneity of areas, the time scale of harvesting operations, the impact of topography, and operational conditions during harvesting significantly influence costs.
Production cost and marketing margin of log, in state of Acre
Values of the composition of the production cost, calculated using different interest rates, of log originating from managed areas in the state Acre, and delivered at sawmill yards in the city of Rio Branco, and the absolute marketing margin, at different distances from the timber hub in this city, are indicated in Table 7.
| Scenario | Description | Rate | Stumpage Cost | Net Profit | Income Tax | Log Cost | Gross Margin |
|---|---|---|---|---|---|---|---|
| Scenario | Description | Rate | Stumpage Cost | Net Profit | Income Tax | Log Cost | Gross Margin |
Composition of production cost and gross marketing margin of timber logs in the state of Acre, 2016.
The cost of production tends to increase as managed areas become more distant from Rio Branco. This is due to the variation in transportation costs, which increase by almost 129% when the distance changes from 50 to 150 km from Rio Branco. The cost of producing stumpage, for scenarios with PP, without PP, and with PP and TS, increases on average by about 10%, changing the distance from 50 to 150 km. Thus, even though the cost of producing stumpage decreases with increasing distance, a higher transportation cost ends up increasing the cost of producing stumpage.
The average cost of producing stumpage, for scenarios with permanent plots, was US\$ 73.36 m-3. The average cost of producing stumpage, of logging activities, and the average cost of transporting log to the sawmill yard represent approximately 40.5%, 29.8% and 26.8% of the final average cost, respectively. Costs related to invoices and Funrural and Income Tax have the smallest share in the cost of producing log (2.9%).
The average production cost for scenarios without PP, at different interest rates, was US\$ 73.12 m-3. Activities related to the average cost of producing standing timber represent almost 40.3% of the average cost of producing log timber. Transporting the log to the sawmill and the costs related to invoices and taxes represent, respectively, 29.9%, 26.8% and 3.0% of the average production cost for scenarios without permanent parcels.
In scenarios with permanent plots and TS, the average production cost was US\$ 78.73 m-3, where the average cost of stumpage production accounts for 45.2% of the final cost, while forest harvesting represents 27.8%. The average freight cost and the costs of invoices and taxes, in turn, correspond to 24.9% and 2.1% of the average log production cost, respectively.
The average price of logs delivered to the sawmill is US\$ 73.32 m-3, while the average production cost, considering different scenarios and rates, is US\$ 75.07 m-3, indicating a negative average profit margin.
Conclusions
The results generated in this study on forest management practices in the state of Acre allowed us to infer the following main conclusions: 1) the average cost of producing standing timber in an area located 50 km from the Rio Branco timber hub increases by approximately 0.82% with the installation and measurement of permanent plots throughout the cutting cycle; and 2) the profit margin for logs indicates that for more distant areas (150 km) this activity is unfeasible.
Conflict of Interest
The authors declare no conflict of interest.
Ethical Approval
Not applicable
Data Availability
The datasets used in this study are openly available at [repository link] and the source code is available on GitHub at [GitHub link].
Funding
This work did not receive any external funding.
References
Cite this article
Related Research


Special Issue
Launch a focused special issue to highlight research, emerging trends, and expert insights in your academic field.
