

IntelliPaper
Abstract
When large amounts of renewable energy sources are integrated, DC microgrids face difficulties with voltage regulation, energy management, inertia control, and uncertainty management. Numerous approaches have been offered to address these difficulties, such as droop control, centralized control, distributed control, virtual inertia control, and uncertainty management algorithms. Despite these efforts, a comprehensive overview that offers a panoramic understanding of the existing techniques and forthcoming trends in controlling renewable energy-integrated DC microgrids has been lacking. This paper involves designing, simulating, and implementing a DC Microgrid based on hybrid renewable energy sources to achieve high efficiency and sustainability in energy systems. The research focuses on integrating solar and wind energy sources with the design of an advanced energy management system that ensures network stability and reduces electrical losses. A comprehensive mathematical model was developed to study network dynamics and analyze its response to operating conditions, such as climate and load changes. High-precision numerical simulation techniques were adopted to analyze the performance and improve the compatibility between the network components to achieve maximum operational efficiency. The research includes designing and implementing a controller to manage the real-time dynamic balance between energy generation and consumption. Practical tests of the proposed system were conducted in realistic operating environments to study the network's performance in multiple cases, such as peak loads and sudden outages.
Explore Digital Article Text
I. INTRODUCTION
Environmentally friendly and sustainable alternatives to conventional fossil fuels encompass solar, wind, hydro, and geothermal energy sources. Their significance is in reducing greenhouse gas emissions and decreasing our dependency on scarce resources to mitigate the negative impacts on climate. However, the intermittent nature of renewable energy sources (RESs) like solar and wind has challenges, necessitating improved grid stability and effective energy storage integration. A comprehensive strategy incorporating technological innovation, helpful policies, and public involvement is required to overcome these challenges and establish a sustainable energy future. DC microgrids are very important for integrating renewable energy sources like solar panels because they manage the direct current (DC) output from these sources well, reducing conversion losses. Implementing this streamlined strategy improves overall energy efficiency, making it suitable for localized power distribution networks and facilitating the integration of diverse renewable sources. A DC Microgrid is a small-scale power system designed to manage the distribution and consumption of electrical energy locally using direct current (DC). It is considered an efficient and flexible option for reliable energy supply, especially in remote areas or applications relying on renewable energy sources. The rising integration of renewable energy sources and the increasing complexity of power distribution systems have underscored the significance of hybrid AC/DC microgrids in contemporary energy infrastructure. However, these microgrids face simultaneous challenges of preserving frequency stability and reaching economic efficiency. Conventional solutions to these challenges independently handle energy storage optimization and control strategies, leading to suboptimal microgrid performance. To address these issues, this work proposes a novel unified framework that integrates energy storage optimization with sophisticated control algorithms in a synergistic way. This research aims to provide a comprehensive solution that enhances the operational stability and financial performance of hybrid AC/DC microgrids by optimizing energy storage deployment and balancing dynamic interactions between AC and DC subsystems. The proposed unified framework has the potential to significantly advance sustainable energy systems and pave the way for future developments in microgrid technology.
Challenges of DC Microgrid Voltage fluctuations are caused by varying loads and energy sources with measurement of balanced energy distribution among different loads, which need device integration for standardization among microgrid components to decrease the initial cost and higher infrastructure cost compared to traditional grids. In this case study, we will focus on two sources. The first type we will discuss is solar power and how it was the foundation of the study. The second type would be wind turbine power. In both cases, A DC power source (solar, wind) produces and maintains a constant voltage converted to AC power. Since we know DC power does not have a loss, converting that power to AC becomes a challenge. Having the ability to create a balance between voltage regulation and current sharing while reducing current circulation.
1.1 Contributions
Combining multiple energy sources improves grid stability overall. This approach allows either source to add the needed power if one source is not producing at the rated level. Increased energy output is significant due to both sources generating electricity simultaneously. This makes the system more efficient and robust compared to a stand-alone source. Load capacity is increased with a combined system since more electricity is being produced. Cost is reduced by using free fuel sources such as the sun and wind to power the systems.
II. METHODOLOGY
The system's performance in the most unfavorable conditions. Energy storage devices are essential for reducing variations in renewable energy production and improving the stability of the system. Artificial intelligence methodologies, such as machine learning and neural networks, assist in predicting renewable energy production and electricity consumption, thereby enabling proactive decision-making. Furthermore, uncertainty modeling techniques such as probabilistic and possibilistic methodologies allow for the measurement and examination of uncertainties related to renewable energy sources, grid components, and demand patterns. This ensures that microgrids can operate reliably in dynamic contexts. Several recent reviews summarized in The academic literature underscore a significant gap in current research regarding the control, energy management, inertia support, uncertainty management of DC microgrids, and economic and environmental benefits, particularly within the framework of integrating renewable energy sources. While numerous studies delve into these aspects individually, a comprehensive systematic review that encompasses all aspects of DC microgrids is notably lacking. To bridge these gaps, this review provides comprehensive documentation on voltage control, uncertainty management, inertia support, environmental and economic benefits, and energy management of large-scale renewable energy-integrated DC microgrids, along with specific and comprehensive recommendations aimed at supporting greater integration of renewable energy sources with DC microgrids. The review encompasses cutting-edge technologies and methodologies, shedding light on emerging trends while also pinpointing areas requiring further investigation. Additionally, the article furnishes a compilation of prospective research recommendations to guide and inspire scholars in advancing this domain. This paper has the following structure: The bibliometric analysis with a systematic approach to developing this review is discussed in Section 2, Section 3 provides a description of various major components of renewable energy-integrated DC microgrids, Section 4 provides control and energy management algorithms for DC microgrids, Section 5 documents inertia support techniques for high-level integration of renewable energy with the DC microgrids, Section 6 summarizes uncertainty issues, Section 7 discusses economic and environmental benefits of RESs integrated DC microgrids, Section 8 provides future recommendations, and finally Section 9 concludes this work. Solar cell power as a renewable energy source was unique in its perception. In this module, I used a solar panel emulator 1.5kw, 500V (CO3208-1P), equivalent to the Solar module with solar altitude emulator (CO3208-1B). Both modules would yield the same results. We used the solar panel emulator because the light on the solar altitude emulator was getting hot over a sustained period. Nonetheless, the setup includes a 3-phase industrial photovoltaic converter (CO3208-1N). In this work, we tested the characteristics of the solar panel emulator and the effect it would have on the solar altitude emulator by using 0,30,60,100 de-rating. The de-rating acts as the sun's movement across the solar cell panel. At each level of the de-rating, the converter adjusted to keep the voltage stable as I fluctuated from 100% to 0%. Once I ran the test and received the results that were yielded, I began to see how the system could be improved for robustness.
The next renewable energy source explored in this work was the Wind Turbine System. The wind turbine system was more difficult to navigate. It uses an asynchronous double-fed induction generator (DFIG). (CO3208-3A). It is connected to a 3-phase motor generator (SE2662-6W), a digital controller, a brake, and the Active-Servo software. (CO3636-6W/CO2663-6U). It uses a 3-phase isolating transformer (CO3203-3B), Digital meter (CO5127-3B), Power Supply (CO3212-5U), Rectifier (CO3636-3B8), Inverter (CO3636-3A8). With the generator running at 1600 rpm, the goal was to lower the voltage to tie in with the solar panel module. The rectifier and inverter were used to accomplish this goal. I used trial and error to decrease the voltage without overloading this system.
The micro-DC Grid ties together Solar and Wind Turbine renewable energy sources. Once both Solar and Wind modules output 120 volts, this DC grid used two busbars (CO3301-5R) in this work.
III. THE EQUIPMENT
The equipment used in this work is as follows:
3.1 Solar Cell Equipment
The solar panel altitude emulator simulates the changing angle of the sun in the sky is shown in Figure 1a. It is used to test the panel's power output and determine how much its results would vary based on its altitude or the sun's position.
Parameters: 10 W polycrystalline solar module, Open-circuit voltage: 26 V, Short-circuit current: 650 mA, Adjustable module inclination, Adjustable solar altitude, Adjustable solar azimuth 500 W halogen lamp (with dimmer
The transformer-less PV-inverter is designed especially for a three-phase power supply as shown in Figure 1b. It has a graphical display for visualizing energy yield values, current power, and operating parameters of the photovoltaic system. When starting the system, you must set the time, date, and year.
The mains power supply for DC, AC, and three-phase machines and synchronous machine excitation is shown in Figures 1 c and e. The power supply unit is specially designed for the operation of electrical machines.
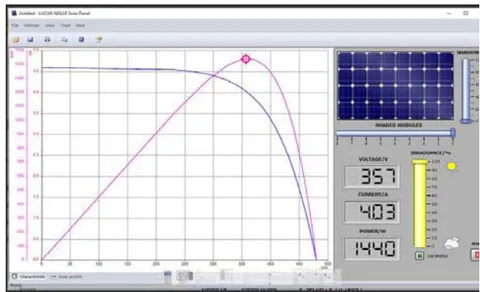
The solar panel emulator is a controllable DC power supply source that provides the required DC voltage, current, and power to the inverter analogous to PV modules. It can be remotely operated using the "Solar Panel" virtual instrument, which allows the simulation of the behavior of a photovoltaic system.
Variable Ohmic Load CO33301-3F shown in Figure 1h has three synchronously adjustable ring rheostats (bank winding) with scale 100 - 0% and a fuse in the sliding-contact connection. Suitable for parallel, series, star, and delta circuits, Resistance: 3 x 750 ohms, Current: 3 x 2 A
Inputs/outputs: 4mm safety sockets, Dimensions: 297 x 456 x 125 mm (HxWxD
This variable transformer CO3301-3P, shown in Figure 1f, compensates for voltage fluctuations in the event of changes in load by modifying the transformation ratio. The component can be used as a step-up or step-down transformer. Control is performed via the inputs of the power quality meter CO5127-1S.
The transformer in Figure 1 d and i are feeds the transmission line model; the scale factor is 1:1000 for secondary current and voltage.
The three-phase power quality meter permits the measurement and display of all relevant grid parameters. It can carry out single, two-phase, or three-phase measurements. Display and operation are performed via menu navigation with an LC display or the integrated Ethernet interface. The optional SCADA software provides for the display of all readings and allows the implementation and analysis of intelligent power grids (smart grids). The "Smart Meter" acts as a digital electricity meter at the endpoints of the electricity grid to measure electricity consumption and can be used to turn consumers on or off, depending on circumstances.
Table 1 Shows the Specifications of the Devices used
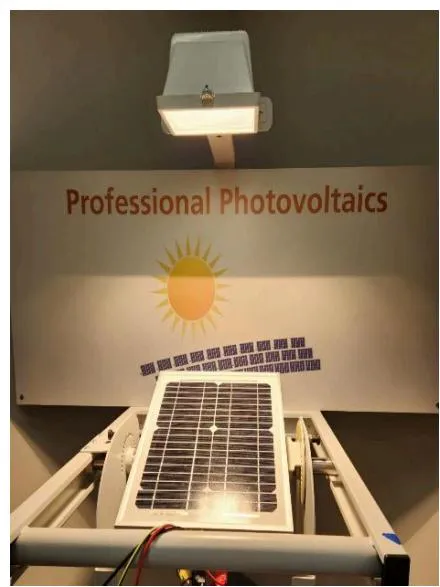
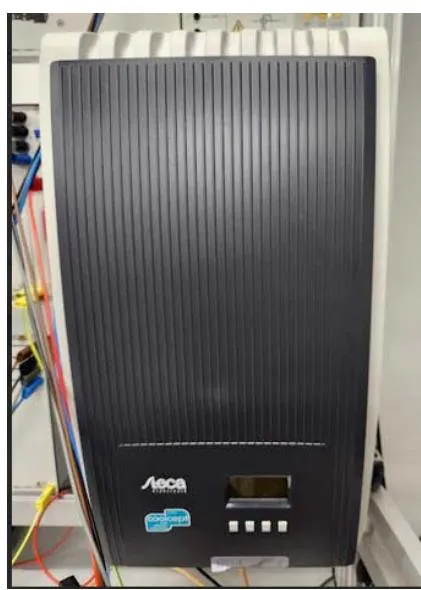
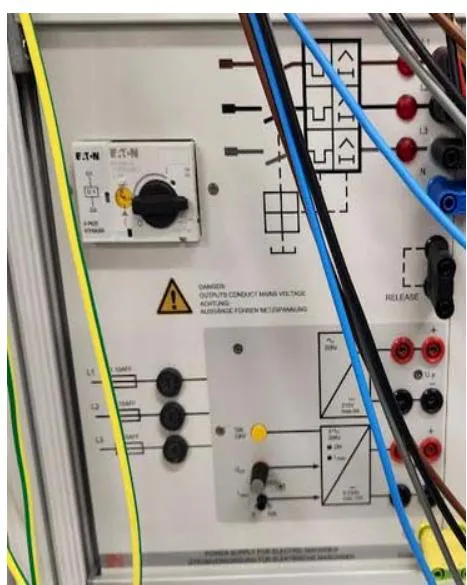
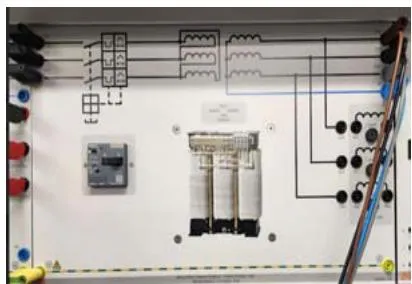
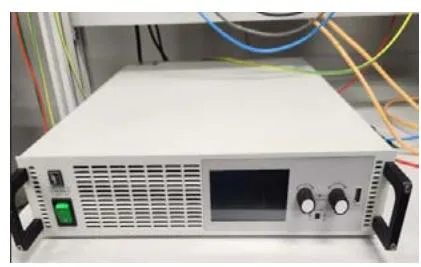
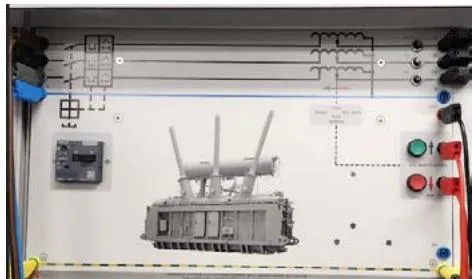
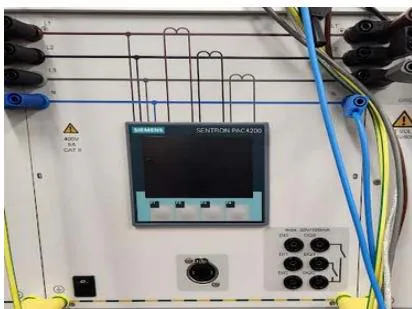
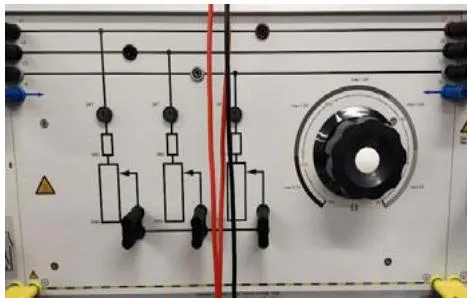
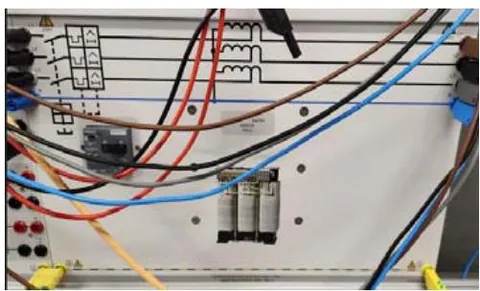
Figure 1: Solar Cell Equipment Table 1: Specifications of the devices used.
| # | Item |
| 1 | DC-PV Input |
| 2 | Voltage: 250 - 1000 V |
| 3 | MPP voltage: 300 - 800 V |
| 4 | Maximum current: 11A |
| 5 | AC output |
| 6 | Voltage: 3 x 230, 50/60 Hz |
| 7 | Power factor: 0.8 – 1 |
| 8 | Max. Current: 7A |
| 9 | Maximum Power: 3200 W |
| 10 | Maximum efficiency: 98.6% |
| 11 | European efficiency: 98.2% |
| 12 | MPP-efficiency: >99.7% (static), >99% (dynamic) |
| 13 | De-rating/ power limiting occurs automatically when: |
| 14 | input power > max. recommended PV power. |
| 15 | cooling is inadequate. |
| 16 | input current is too high. |
| 17 | grid current is too high. |
| 18 | internal or external de-rating is performed. |
| 19 | grid frequency is too high (according to country setting) |
| 20 | limiting signal is received via an external interface. |
| 21 | output power is limited (set at the inverter) |
| 22 | Communication interfaces: |
| 23 | 1 x RJ45 socket (RS485) |
| 24 | 2 x R J45 socket (Meteocontrol WEB log or solar log; Ethernet interface) |
3.2 Wind Turbine Equipment
The three-phase power quality meter permits the measurement and display of all relevant grid parameters. It can carry out single, two-phase, or three-phase measurements. Display and operation are performed via menu navigation with an LC display or the integrated Ethernet interface. The optional SCADA software provides for the display of all readings and allows implementation and analysis of intelligent power grids (smart grids). The "Smart Meter" acts as a digital electricity meter at the endpoints of the electricity grid to measure electricity consumption and can be used to turn consumers on or off, depending on circumstances.
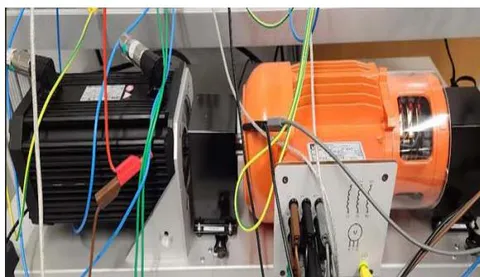
The servo-machine test bench shown in Figure 2b is a complete testing system for examining electrical machines and drives. It consists of a digital controller, a brake and the ActiveServo software. The system combines state-of-the-art technology with ease of operation. The system also allows manual and automated synchronization to be carried out.
Figure 1d shows a Double-Fed 3-Phase Generator and Motor. Double-fed generator 3-phase and motor. The motor and sensor leads are connected via polarity-safe plugs. The machine has thermal monitoring, and, in conjunction with the controller, it constitutes a driving and braking system that is free of drift and requires no calibration.
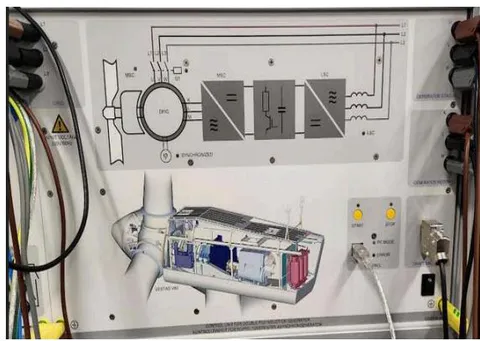
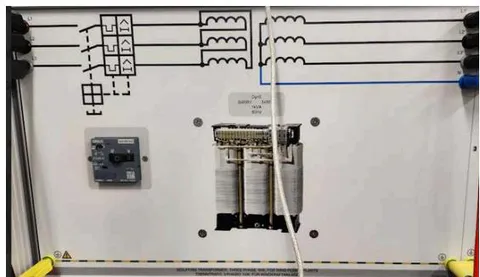
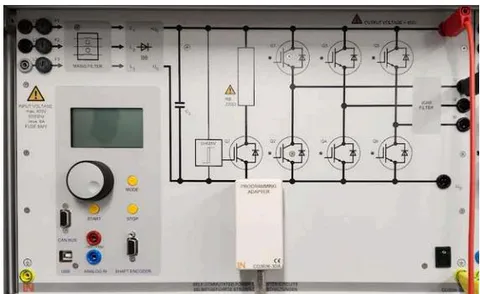
Figure 2a shows a Double-Fed Inductive Generator Control Panel. Control panel unit for double-fed Inductive generator.
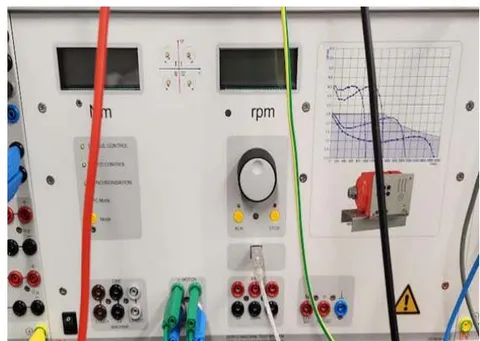
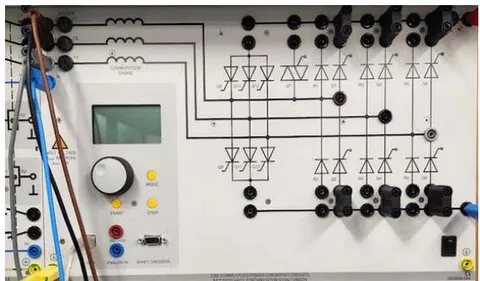
Figure 2e shows a DC to AC Inverter using one transistor. The inverter uses one transistor to simulate DC to AC. I used one transistor to get this effect. Figure 2f shows an AC to DC Rectifier.
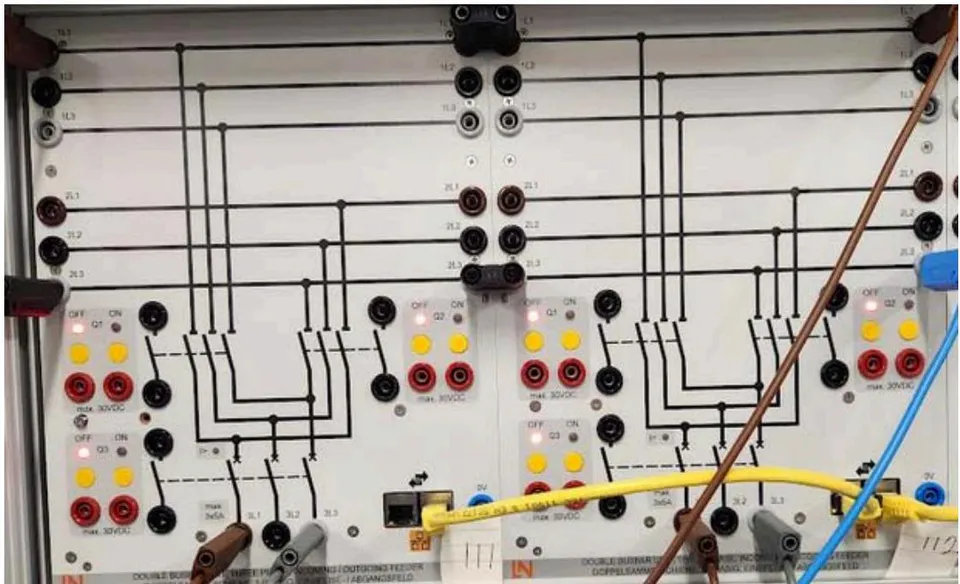
Figure 3 shows the three Phase Double Busbar, which is used as a DC busbar.
IV. THREE-PHASE FULL CONVERTER
DC microgrids and their components The DC microgrids function in either grid-connected mode, where the utility grid links to the shared DC bus through a bidirectional voltage source converter (VSC), or in islanded mode, operating au tenuously without utility grid connection. Solar PV and wind systems, DC loads, AC loads, fuel cells, and energy storage devices are the main components of the DC microgrids. The DC microgrids face low inertia issues due to large-scale renewable energy sources. This phenomenon is particularly pronounced in regions with high renewable energy penetration rates, where renewable energy contributes significantly to the overall electricity generation mix by replacing conventional synchronous generators. This reduced inertia challenges microgrid stability and reliability, especially during sudden changes in power demand or supply fluctuations. To tackle this, several advanced inertia support techniques, along with energy storage devices, are proposed. Notably, batteries and supercapacitors, among various energy storage devices, are frequently employed for bidirectional energy exchange with the DC bus. The grid VSC regulates DC bus voltage in grid-connected mode, whereas the battery or supercapacitor manages voltage in islanded mode. Due to its high energy density, the battery focuses exclusively on providing or absorbing steady-state power. Conversely, with its high power density, the supercapacitor offers or absorbs transient power briefly to make a power balance. In the context of DC microgrids, the utilization of a fuel cell can offer a consistent and reliable power supply, especially when integrated with sustainable energy sources such as solar and wind. The absence of combustion in its electricity generation process renders it an ecologically conscious alternative, enhancing energy diversity and overall sustainability. A three-phase full converter is a fully controlled bridge-controlled rectifier using six thyristors connected in a full-wave bridge configuration, as shown in Figure 4. All six thyristors are controlled switches turned on at appropriate times by applying suitable gate trigger signals.
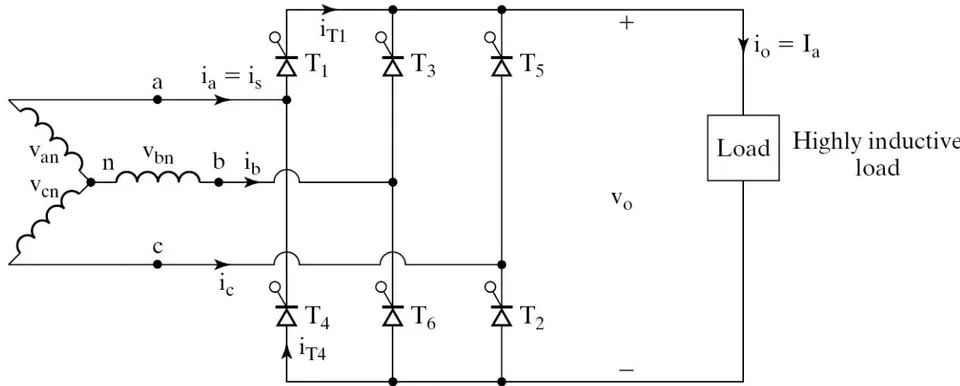
, thyristor is already conducting when the thyristor is turned on by applying the gating signal to the gate of . During the time to , thyristors and Conduct together, and the line-to-line supply voltage. Appears across the load.
At , the thyristor is triggered and is reverse biased immediately, and Turns off due to natural commutation. During the period , thyristor and
Conduct together, and the line-to-line supply voltage. Appears across the load. Figure 5 shows the waveform of a 3-phase full converter.
The thyristors are numbered in the circuit diagram in the order in which they are triggered. The thyristors' trigger sequence (firing sequence) is 12, 23, 34, 45, 56, 61, 12, 23, and so on. The figure shows the waveforms of three-phase input supply voltages, output voltage, the thyristor current through and . The supply current is through line 'a'. We define three-line neutral voltages (3-phase voltages) as follows.
Where is the peak phase voltage of a star (Y) connected source? The corresponding line-to-line voltages are
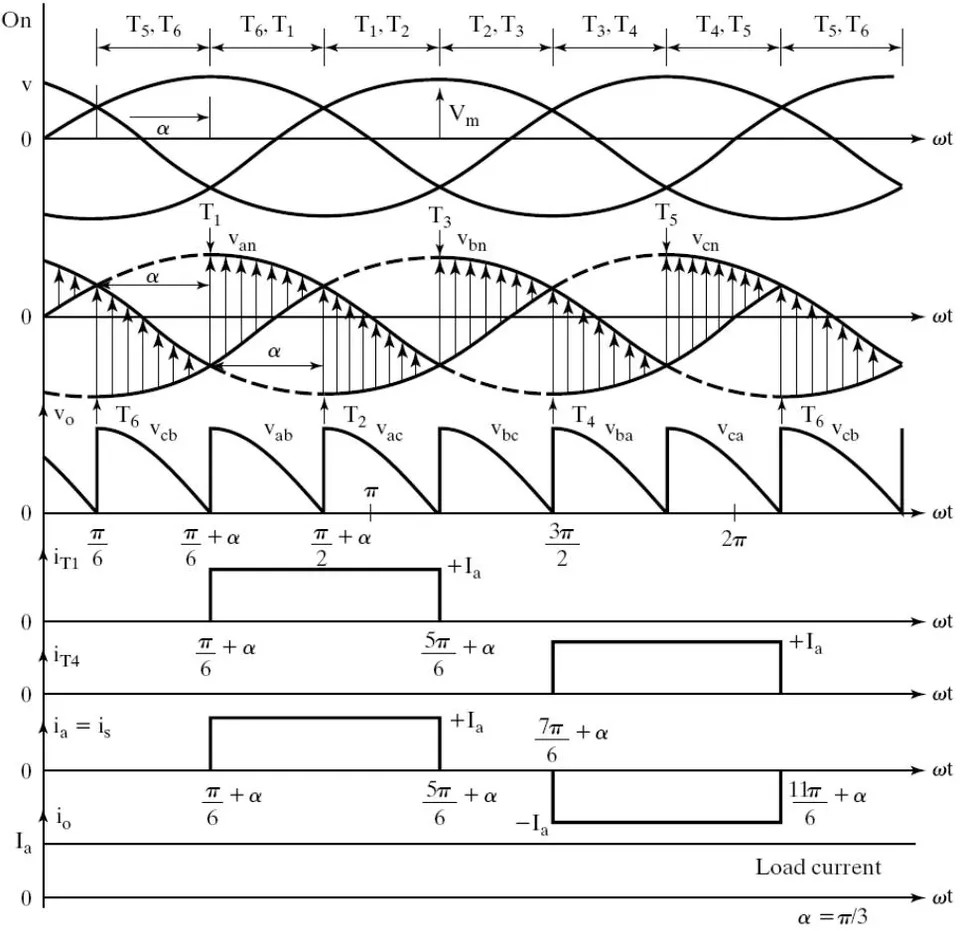
The output load voltage consists of 6 voltage pulses throughout radians. Hence, the average output voltage is calculated as
Where
V. SUPERVISORY CONTROL AND DATA ACQUISITION
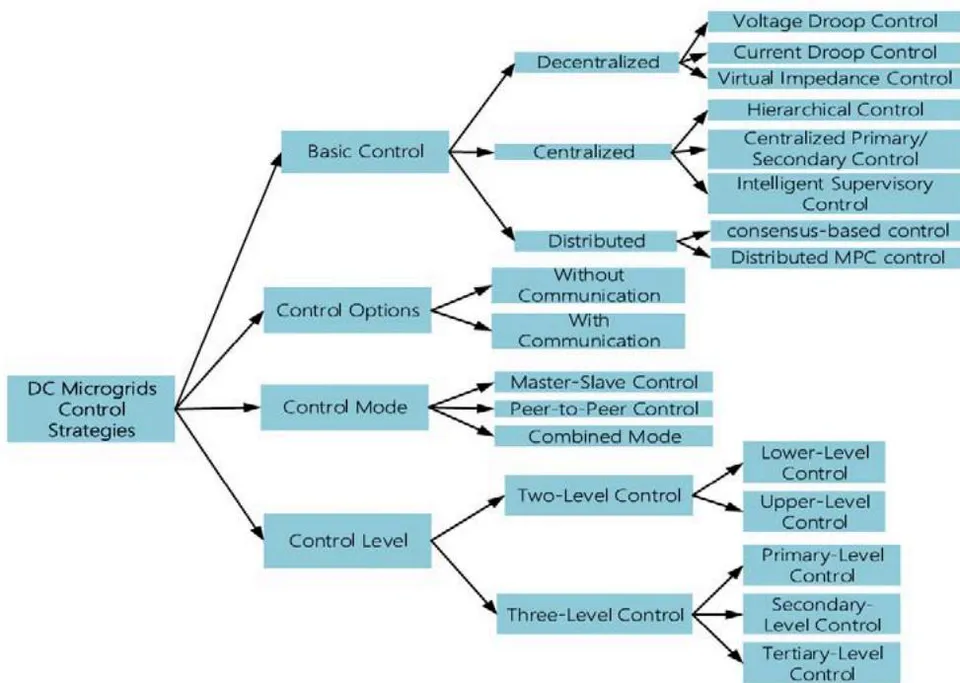
The basic control strategies of DC microgrids are shown in Fig. 5. Compared to decentralized and centralized control, utilizing a distributed approach in DC microgrids offers many benefits, such as the distribution of decision-making over numerous. Figure 6 shows the control strategies of DC microgrids.
Applications
Remote Areas:
- Providing electricity in locations far from national grids.
Smart Buildings:
- Buildings utilizing solar energy and electronic devices.
Industries:
- Operating machinery that works on DC to improve efficiency.
Renewable Energy Networks:
- Enhancing the integration of solar and wind energy.
Transportation Infrastructure:
- Electric vehicle charging networks.
SCADA Technology
SCADA stands for Supervisory Control and Data Acquisition; software allows the supervision and control of industrial processes, including manufacturing, production, power generation, fabrication, and refining.
A simple personal computer (PC) can become a workstation through SCADA programs to watch and control processes and communicate with the field. Programmable Logic Controllers (PLCs) and Remote Telemetry Units (RTUs) or intelligent devices allow for the graphic representation of a plant, the supervision of its processes, modification of certain parameters, elaboration of reports, emission of alarms, and other functions.
The processes can be controlled remotely or locally to make changes to the parameters of the process on-site (local way) or adjustments in a control room (remote way).
Substation control: Substations are essential for sustaining the flow of electricity and managing load. The SCADA system continually assesses the condition of different substation components and then sends them the appropriate control signals. It carries out tasks including bus voltage regulation, bus load balancing, circulating current regulation, and overload regulation.
Remote Communications Networks
The SCADA host in the field office or central control center receives data from distant RTU/PLCs in the field or along the pipeline via the remote communication network. Communication is the SCADA system's "glue" or "linking component," and it is crucial to the system's functioning since assets are dispersed over a wide geographic region. A SCADA system's ability to effectively handle communication with distant assets is essential to its success, and the fact that these communication mediums are still prone to malfunction is a significant problem. Figure 7 shows an RTU/PLC system connection.
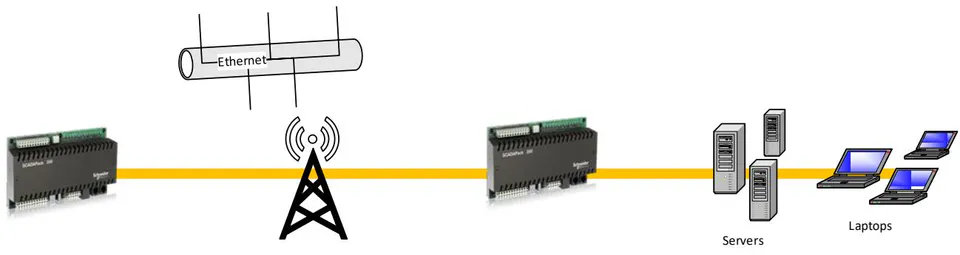
Any sophisticated SCADA may be broken down into its smallest components and linked through communication protocols, much like a distributed architecture. The system may be dispersed over many process control networks (PCNs), geographically isolated LAN networks in a networked architecture. A network architecture might consist of many distributed architecture SCADAs operating concurrently, each with a single supervisor and historian. This enables a more economical option in very large-scale systems. Internet of Things, fourth generation
Modern SCADA systems are driven to provide operational benefits from the SCADA host down to the instrumentation, not only in controlling and retrieving data but also in engineering, implementing, operating, and maintaining these assets.
Provide instrumentation and RTUs/PLCs for easily managed asset or process solutions.
Create and implement open standards utilizing best practices established by open organizations rather than a single manufacturing body to facilitate the integration of assets inside a SCADA system. As a result, the cost of owning SCADA will go down.
Implement several practices and procedures, in addition to technological solutions, to create safe environments for SCADA systems, their assets, and processes.
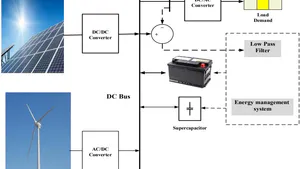
Figure 6 shows the proposed control schematic's time response using MATLAB/Simulink. In the last step of the work, the hardware is implemented, and the power system framework of a microgrid is developed for the power laboratory-based SCADA using Lucas-Nülle power engineering laboratory equipment to model and simulate the distribution-level smart grids/microgrids. Figure 7 shows a proposed DC microgrid system with an energy management system. Figure 8 shows a schematic diagram of conventional droop control of a DC microgrid with the energy management system, which represents a hybrid AC/DC microgrid. Figure 9 shows a Time response of the proposed control schematic using MATLAB/Simulink.
{"image_source":{"path":"images/fb5c5bf5156c34d64f2291eb17fbbf8d88e8062c35d987dbe1851214b3b420c0.jpg"},"content":"","chart_caption":[{"type":"text","content":"Figure 6: Time response of the proposed control schematic using MATLAB/Simulink"}],"chart_footnote":[]}
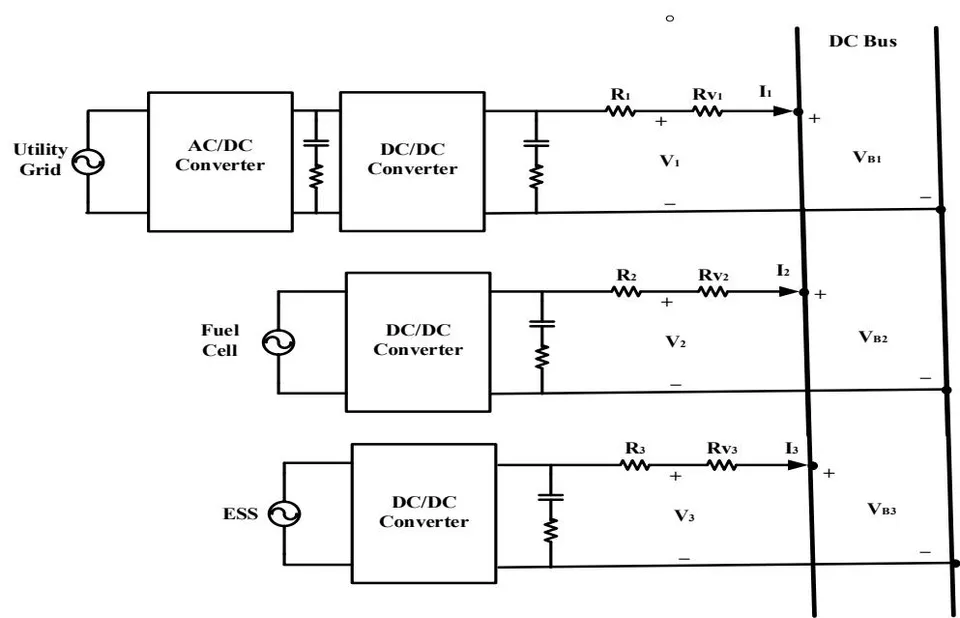
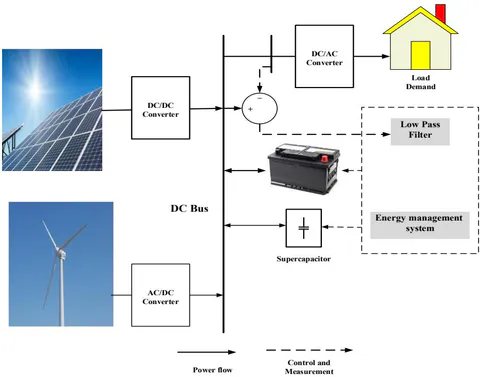
{"image_source":{"path":"images/1eb3acc9820e6f652ab03b4ecc52282e3b1f539439c115c39b46381e359b05f4.jpg"},"content":"","chart_caption":[{"type":"text","content":"Figure 8: Diagram of conventional droop control of DC microgrid with energy management system"}],"chart_footnote":[]} {"image_source":{"path":"images/960313be768dde645a49f0e0ba2d2b6aff92d78f3a4e6a11a19bd8b0cbc4cb5c.jpg"},"content":"","chart_caption":[],"chart_footnote":[]}
{"image_source":{"path":"images/9abd2ed5fa7653554b7bf19b1a7a1114abd9d90f9d2c167972ba2dd0b3a83461.jpg"},"content":"","chart_caption":[],"chart_footnote":[]} {"image_source":{"path":"images/95a1ba26414e93eaabf905e725e9690ca5a556fd238d17bd40fb8e1f187f4091.jpg"},"content":"","chart_caption":[{"type":"text","content":"Figure 9: Time response of the proposed control schematic using MATLAB/Simulink"}],"chart_footnote":[]}
VI. RESULTS AND DISCUSSION
The SCADA system provided Hardware Implementation and setup. I conducted the physical building of the system as I was learning how to work it.
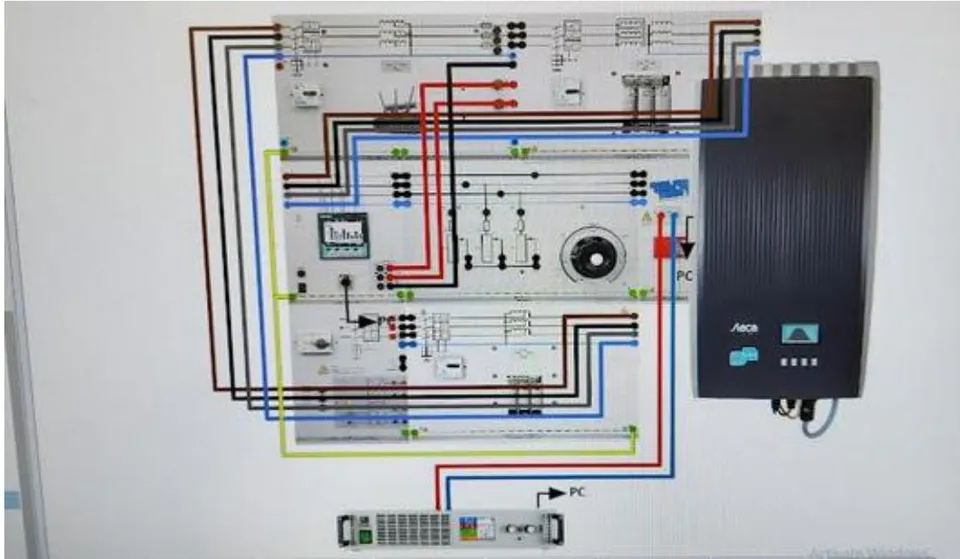
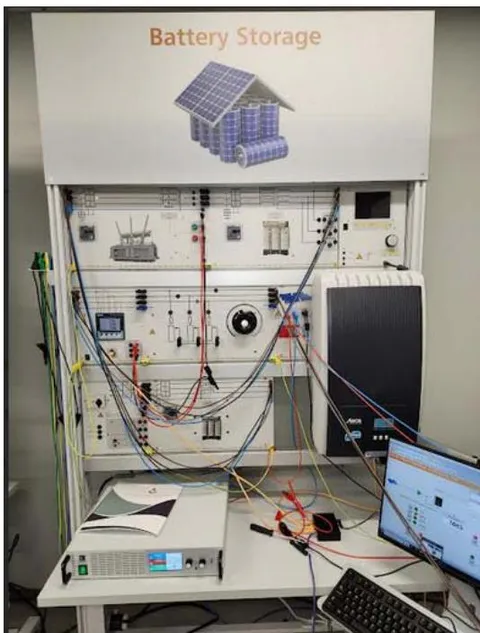
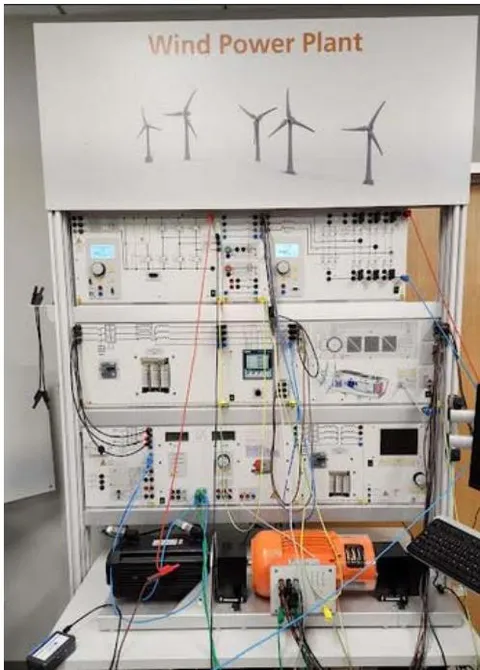
6.1 Results
The first step was to dial both the solar and the wind modules to 120 volts to tie both systems together. This in fact produced a challenge as the system was easy to overload. If the system overloads everything in each module had to be powered down and restarted. Achieving this feat was used with trial-and-error method. After a few weeks was able to get each module to read out 120 volts and combine both modules to the micro grid. I tested this theory by measuring the voltage at each point across the combined system. Another challenge faced was keeping the current stable as it was not reading out at certain positions across the system due to the wind turbine inverter timing out or overload, nonetheless once everything was stable and working the reads across the system output the desired results. After accomplishing
120 volts across the system, I tested the system by add a different load source. For the rectifier found that using the setting BC6 at 97 degrees was the perfect position to keep the system from overloading.
For the inverter the setting used was DC PWM (1QH) at 30%.
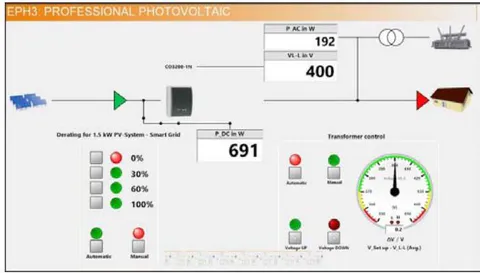
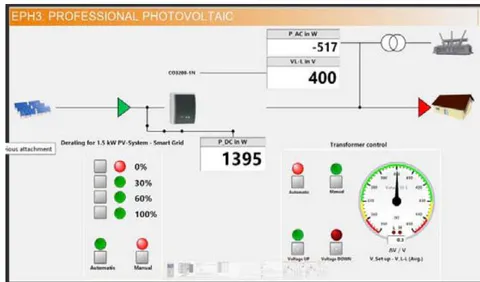
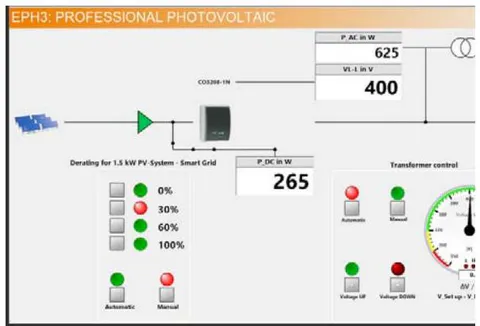
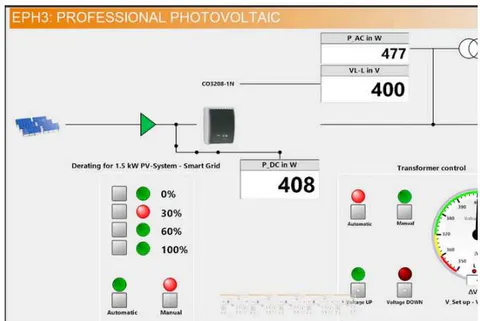
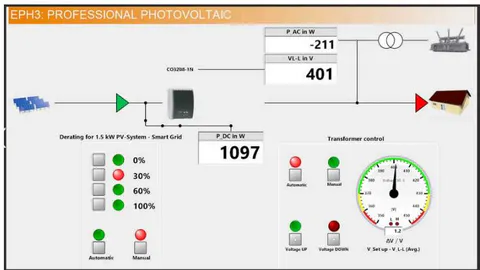
The flow charts below were the results gathered from de-rating the solar cell system using SCADA.
Wind Turbine
Tables 2-5 shows the Power and voltage measurements at DERATING 0, 30%, 60% and 100%.
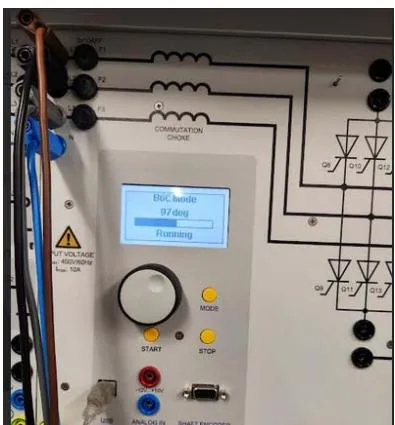
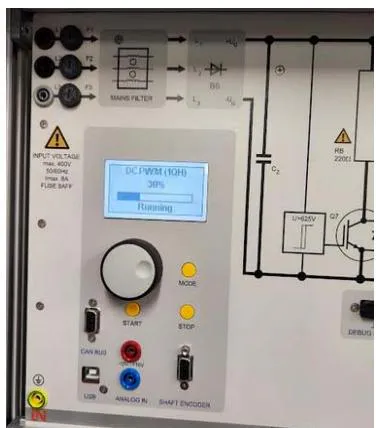
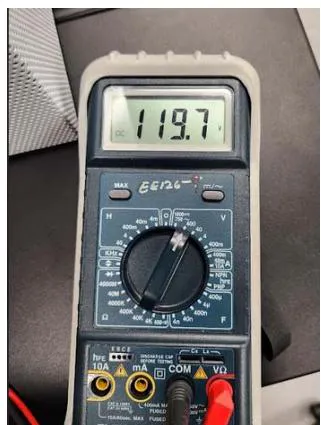
Figure 11: System output (a) Rectifier (b) Inverter (c) System Voltage Table 2: Power and voltage measurements at DERATING o%
| Shading | PDC (W) | P_AC in (W) | VL-L |
| 0% | 0 | 890 | 401 |
| 10% | 121 | 766 | 400 |
| 20% | 265 | 623 | 400 |
| 30% | 408 | 478 | 400 |
| 40% | 550 | 336 | 400 |
| 50% | 691 | 193 | 400 |
| 60% | 833 | 44 | 399 |
| 70% | 973 | -95 | 400 |
| 80% | 1115 | -235 | 400 |
| 90% | 1255 | -383 | 399 |
| 100 | 1395 | -516 | 401 |
| 0% | 0 | 886 | 400 |
| 10% | 265 | 767 | 400 |
| 20% | 265 | 625 | 400 |
| 30% | 408 | 477 | 400 |
| 40% | 550 | 339 | 401 |
| 50% | 691 | 187 | 399 |
| 60% | 832 | 48 | 400 |
| 70% | 974 | -90 | 401 |
| 80% | 1097 | -215 | 401 |
| 90% | 1097 | -211 | 401 |
| 100% | 1096 | -222 | 399 |
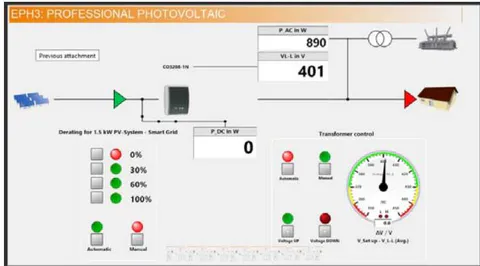
Shading PDC(W) P_AC in (W) VL-L 0% 0 891 400 10% 120 767 401 20% 265 624 402 30% 408 475 400 40% 548 338 401 50% 552 339 402 60% 552 336 401 70% 552 335 399 80% 552 340 399 90% 552 337 400 100% 552 334 400 Shading PDC(W) P_AC in (W) VL-L 0% 8 887 400 10% 8 887 401 20% 8 888 401 30% 8 890 401 40% 8 889 401 50% 8 886 401 60% 8 883 400 70% 8 884 400 80% 8 883 400 90% 8 886 400 100% 8 876 399
6.2 Discussion
As I progressed near the end of this work, I contemplated how I could make the system better in real time. Though the equipment appears to be an alpha model I would change a few things on how the system works. The first thing that I noticed early on was that there was only one dingle drive. This drive is the key to the software portion of the work. It is used to verify authenticity and allows for the system to verify that active components and equipment are registered. (I.e. the power quality meter, the converter). Another flaw that I saw was that the wiring cords were too short. I had to connect multiple cords to extend the length to make some of the connections. This caused safety trip issues if you were not paying attention. However, these small setbacks created a learning opportunity and allowed for more understanding in the process.
Due to the popularity of the power lab and SCADA system, I had the pleasure to demonstrate what I had built and worked on over the course of the study. Students from other universities such as Texas A&M were impressed and excited to see firsthand what Prairie View offered its students. Professional employees from multiple companies also came and experienced the power lab. This system is state of the art due to not many universities or companies have the technology. Since the power lab is large in cost the benefits and hands-on learning is worth it. It gives the students a look into what is reality but on a small scale.
VII. CONCLUSION
Renewable energy sources can be cost effective and efficient in it's make up. It highlights how it can be a reliable source of energy for years to come. Depending on the setup it can be used it can and off the grid and give the same results as if it was connected to the grid. These energy sources can be used full-time, part-time, or can support the grid. The scale in this work was small in size but can also be retrofitted for a scale. This work took me approximately 4 months to complete. Starting with learning how the system works to physically connecting the units. Ironing out all the kinks and setbacks using trial and error and help from my mentor allowed me to gain the knowledge necessary to finish the work.
Finally, I found this work to be challenging but fun. Knowing that I would be ahead of the curve once I stepped into the real world where these types of renewable energy sources are being used in everyday life, no matter the scale or setup.
Conflict of Interest
The authors declare no conflict of interest.
Ethical Approval
Not applicable
Data Availability
The datasets used in this study are openly available at [repository link] and the source code is available on GitHub at [GitHub link].
Funding
This work did not receive any external funding.
References
Cite this article
Related Research

Special Issue
Launch a focused special issue to highlight research, emerging trends, and expert insights in your academic field.