


Abstract
The possibility of electrochemical obtaining of thin tellurium coatings from a chloride-sulfate electrolyte has been investigated. The studies have been carried out in solution containing (mol/ l): 0.01 - 0.08 TeO 2 + 1.5H 2 SO 4 + 1.5HCl + 0.01 - 0.08 (NH 4 ) 2 SO 4 +1.0 gelatin. Ithas been found that with the increase in the concentration of HCl in the electrolyte from 0.5 mol/l to 4 mol/l, the cathodic deposition of tellurium accelerated, the polarization curves shifted in the positive direction. Experiments carried out in solutions containing chloride-sulfate ions show that in the initial stages of the cathodic process, chemical difficulties play the main role, and at negative potentials of the process, they are limited by diffusion polarization. At cathodic potentials up to 0.2 V, the process of tellurium electrodeposition from а chloride sulfate electrolyte is mainly accompanied by chemical polarization and effective activation energy at these potentials reaches up to 40 kJ /mol, and at a potential of 0.30–0.25 V, the process is controlled by mixed kinetics.
Explore Digital Article Text
I. INTRODUCTION
In recent years, with the development of semiconductor technology, the need for tellurium has increased sharply. In this regard, research aimed at studying the electrodeposition of tellurium from various electrolytes is of great scientific and practical interest . Tellurium has a number of specific properties. As the purity level increases, new properties are revealed, the scale and specificity of their application are expanded. In expanding the field of application there is a need for intensive research into the chemical and physico-chemical properties as well as the technology for obtaining pure and ultrapure tellurium and its compounds.
Tellurium is mainly used in semiconductor technology, in instrument engineering, in the chemical and metallurgical industries . Unlike other semiconductors, tellurium easily melts and evaporates; therefore, semiconductor films which are necessary in modern microelectronics can be obtained from it without any particular difficulties. It should be noted that pure tellurium is rarely used as a semiconductor; metal tellurides are more common. Tellurium is used in the production of lead alloys with increased plasticity and strength (used, for example, in cable production). When introducing 0.05% tellurium, lead losses during dissolution under the influence of sulfuric acid are reduced by 10 times, and this is used in the production of lead-acid batteries. Production of lanthanide tellurides, their alloys and alloys with metal selenides for manufacturing thermoelectric generators with very high (up to 72-78%) efficiency will be very important in the coming years, that will allow to use them in the energy sector and automotive industry.
As have been well known from the literature [12-14], acidic electrolytes are the best tellurium electrolytes [15-20]. During electrolysis from acidic tellurium-containing solutions, depending on the electrolysis condition and electrolyte composition, coarse-crystalline or fine-grained tellurium precipitates are deposited on the cathode. The high positive potential of the system and good solubility of and in hydrochloric acid solutions are very favorable for the electrolytic extraction of pure tellurium. In this work, chloride-sulfate electrolyte was used to obtain tellurium semiconductor coatings. The choice of chloride-sulfate electrolyte was explained by the fact that high-quality tellurium deposits can be obtained from this electrolyte, while high-quality tellurium films cannot always be obtained from an alkaline electrolyte. In addition, precipitates obtained from chloride baths always contain chlorine in the form of , the content of which increases with the increase in the acidity of the solution and in the current density. Also, preliminary experiments have shown that high-quality tellurium films can be obtained from chloride-sulfate electrolyte even at very low concentrations of tellurium in the electrolyte. This is very important when co-deposition tellurium with more electronegative metals such as bismuth, antimony, cadmium, rhenium. At low concentrations of tellurium in the electrolyte, its deposition is accompanied by high polarization, which causes the tellurium deposition potential to shift to the deposition potential of more electronegative metal and thus creates favorable conditions for the co-deposition of these metals. Therefore, in this case, the study of the kinetics and mechanism of tellurium deposition focused on those factors that contribute not only to high-quality precipitation, but also significantly shift the potential of the more noble metal to the negative side (or deposition of the more noble metal is accompanied by high polarization). For this purpose the cathodic reduction of Te(IV) in chloride-sulfate electrolyte on Pt and Te electrode was investigated. The present work was carried out in order to find out the possibility of obtaining by electrochemical method tellurium coatings during electrolysis from chloride-sulfate electrolyte. The investigations were carried out in solutions containing (mol/l): 0.01 - 0.08 gelatin.
II. METHODS
Platinum electrode with a visible surface of was used as a working electrode. The three-electrode cell contained investigated electrode, an auxiliary platinum electrode with an area of , and silver-silver chloride reference electrode. All potential values are given relative to this electrode. The working electrodes were washed with alcohol and water. Current-voltage curves were recorded without stirring. The deposition of films for investigation of structure and composition was carried out on Pt, Cu, and Ni substrates with an area of . The working temperature during electrodeposition was , the deposition time was 30-60 minutes. After deposition, the samples were washed with distilled water. pH value was measured on instrument AZ 86551 and in a solution of the composition (mol/l): .
The study has been carried out from a chloride-sulfate solution containing tellurium oxide. The kinetics of the processes was explored using measurements by the method of cyclic voltammetry on IVIUMSTAT. The films were obtained in galvanostatic mode without electrolyte stirring.
III. EXPERIMENTAL PART
Usually, after immersion of the Te-electrode in a chloride-sulfate solution for 30 minutes, the electrode potential takes the constant value equal to V, which does not change by change in concentration of Te in the solution. However, in the case of a platinum electrode, the stationary potential has a value of +0.36 V and within 30 minutes takes the value +0.56 V. When establishing a stationary potential, the main role is played not by the equalization of the concentration ratios in the cathode layer, but by the equilibrium between the electrode surface and a solution, which are caused by the presence of a film of oxide and insoluble tellurium compounds on the cathode surface. It is more likely that the insoluble salt plays the main role in the contamination of the cathode surface, because tellurium oxide compounds are readily soluble in these solutions.
As can be seen from fig. 1, the forward and reverse branches of the polarization curves differ significantly. The observed hysteresis on PS can be easily explained if we assume that tellurium oxide compounds existing on the surface are reduced during cathodic polarization and the surface of tellurium electrode is in an active state. The presence of hysteresis on polarization curves in this case may be due to the semiconducting nature of tellurium itself. Usually, the rate of electrode reaction on a semiconductor surface depends not only on the concentration of charge carriers. The more active manifestation of the semiconducting properties of tellurium in the field of relatively high cathodic polarization can be explained as follows. It is known that tellurium oxide compounds are electron donors, i.e. source of electrons generation. Since with increasing cathodic polarization there is a gradual reduction of tellurium oxide compounds, it is easy to see that the donor levels and related electron generation centers also disappear. As a result, the discharge of tellurium ions at the cathode is difficult, the rate of the process drops sharply, and the polarization curve shifts towards negative potentials. Therefore, in this case, when studying the kinetics and mechanism of tellurium deposition, the main attention was paid to those factors that contribute not only to the production of high-quality precipitation, but also significantly shift the potential of a more noble metal to the electronegative side. Therefore, a more detailed study of tellurium electrodeposition patterns from the selected electrolyte was required, knowledge of which would help to choose the optimal conditions for the co-deposition of tellurium with other metals. For this purpose, preliminary experiments were carried out to study the effect of various complexing agents and surfactant additives on the rate of the cathodic process and on the quality of the obtained precipitates from different acid concentrations. The highest quality precipitates were obtained from an electrolyte containing ammonium sulfate and gelatin. Therefore, most of the experiments were carried out with , which ensured the stability of the electrolyte and made it possible to create an increased concentration of the complexing agent in the electrolyte. Below are the main results of polarization measurements obtained by using the specified electrolyte. With the increase in the concentration of HCl in the electrolyte from 0.5 mol/l to 4 mol/l, the cathodic deposition of tellurium becomes easier (Fig. 1), the polarization curves shift to the positive direction. Thus, in this case, it is logical to assume that with an increase in the concentration of HCl in the solution, the dissolution of partially hydrolyzed tellurium ions occurs, and at 2–3 mol/l of HCl, is formed, which dissociates well into ions, which causes the polarization curves to shift in the positive direction. The same pattern with a change in polarization curves in solutions containing up to 3 mol/l HCl was observed in [12-24].
{"image_source":{"path":"images/66d2c2ae6ba039f101778476479ec3a1e91c9aa50d8d461367c51029e308fdef.jpg"},"content":"","chart_caption":[{"type":"text","content":"Fig. 1: Cathodic polarization curves obtained from solutions containing 0.05 mol/l "},{"type":"equation_inline","content":"TeO_{2}"},{"type":"text","content":" + 0.01 mol/l "},{"type":"equation_inline","content":"({4}){2}{4}"},{"type":"text","content":" + 1.5 mol/l "},{"type":"equation_inline","content":"H{2}SO_{4}"},{"type":"text","content":" at various HCl concentrations (mol/l): 1 - 0.5; 2 - 1; 3 - 2.0; 4 - 4.0. t = 75°C"}],"chart_footnote":[]}
However, in more acidic solutions (>4 mol /l HCl), with an increase in the concentration of hydrochloric acid, the polarization curves shifts to the negative side. This is probably due to the change in the nature of complex ions of tellurium with chlorine. According to [19], in the concentration range of 0.1-0.05 mol/l HCl, the potential-determining ion is , and at HCl<5 mol/l - . Hence, we can conclude that the composition of the solution has a significant effect on the kinetics of tellurium deposition, which is mainly determined by the state of tellurium-containing ions in the solution. With an increase in the concentration of in the solution, the equilibrium potential of tellurium slightly shifts to the negative side, and the cathodic deposition of tellurium occurs at a significant negative potentials. Moreover, the increase in polarization with an increase in the current density is much stronger and probably due to the higher strength of the sulfate complex than the tellurium chloride complex. It should be noted that the high polarization during deposition of tellurium from the chloride-sulfate electrolyte is associated with the previous chemical reaction of dissociation:
In cathodic reduction, the dissociation product is directly involved. Figure 2 (a) shows the cathodic polarization curves recorded at different concentrations of tellurium in solution. It can be seen from the curves that with an increase in the concentration of tellurium dioxide in the electrolyte, the rate of tellurium extraction at the cathode increases, the potential shifts towards positive values. At a concentration of 0.01 - 0.07 mol /l , the cathodic process is characterized by the occurrence of wave. At a potential of +0.3V, the wave appears on the polarization curves and the cathode surface is covered with a layer of elementary tellurium. The value of is directly proportional to the concentration of tellurium in the electrolyte (Fig. 2 b). This shows that at the indicated concentration of tellurium in the electrolyte, the nature of the tellurium-containing ions participating in the cathodic process does not change. When is reached, due to a decrease in the surface concentration of tellurium ions, the electrode potential shifted to the negative side, reaching a value at which hydrogen is released. We assume that initially the electrode process is determined by the reaction:
According to , the overall reaction occurs in stages, since the rate-determining stage is the receiving of the last electron:
The cathodic polarization curve has three sections. Section I is due to the reduction of tetravalent tellurium to the elementary state. In area where the wave appears, the release of powdery tellurium is observed.
{"image_source":{"path":"images/4161172dee8f07008691fe6deb49cc73b14c499ff51d9bcfb02cd0c0a1ed89ee.jpg"},"content":"","chart_caption":[{"type":"text","content":"Fig. 2: Cathodic polarization curves obtained from solutions containing 5 mol/l "},{"type":"equation_inline","content":"H_{2}SO_{4} + 5"},{"type":"text","content":" mol/l HCl + 0.01 mol /l ("},{"type":"equation_inline","content":"NH_{4}"},{"type":"text","content":") "},{"type":"equation_inline","content":"{2}SO{4}"},{"type":"text","content":" and various concentrations of "},{"type":"equation_inline","content":"TeO_{2}"},{"type":"text","content":" at t = 75°C. The concentration of "},{"type":"equation_inline","content":"TeO_{2}"},{"type":"text","content":" (mol/l): a) 1 - 0.01; 2 - 0.03; 3 - 0.05; 4 - 0.07;
b) Dependence of the wave value on the concentration of tellurium in the electrolyte."}],"chart_footnote":[]} From a potential of +0.28 V, the wave falls, and then rises again (II section). Perhaps, in these potentials, is formed on the electrode surface.
Section III of the polarization curve is due to the vigorous evolution of hydrogen, which occurs according to the reaction:
The resulting ions diffuse from the cathode surface, meeting with ions, form elementary tellurium, and disproportionation reaction occurs in the solution according to the equation:
since the possibility of a cathodic reaction in concentrated solutions is much greater than in dilute solutions. At more positive potentials (<0.3 V), anodic oxidation of tellurium occurs. The large potential difference between the cathodic reduction and anodic oxidation waves indicates that the tellurium deposition reaction is irreversible.
As it's known, during electrolysis, metal ions, before entering the crystal lattice of the precipitate, go through a number of successive stages, each of which proceeds at a certain rate. The slowest stage limits the rate of the processes in general.
{"image_source":{"path":"images/33831f0200ae2fffc0740f687bdf39507fbd5f453f5236930393196a4e384a7a.jpg"},"content":"","chart_caption":[],"chart_footnote":[]}
Fig. 3: Cathode polarization curves, obtained from solutions, containing 1,5 mol/l +1,5 mol/l HCl+0,01 mol/l +0,05 mol/l at various temperatures on the Pt electrode. Temperature (°C) 1 – 20; 2 – 40; 3 – 80; 4-90
The electrodeposition of tellurium is significantly affected by the temperature of the electrolyte. As the experiments have shown, the temperature has a significant effect on the rate of the process under study. In the studied temperature range, the polarization curves have waves. As the temperature rises, the rate of the electroreduction reaction increases, which is accompanied by increase in wave height. It was found that with the increase in temperature, the content of tellurium in the precipitate also increases, and fine-crystalline precipitates are obtained at the cathode. To determine the nature of cathodic polarization during tellurium deposition, on the basis of the data in Fig. 4, the lgi – 1/T graphs were plotted at various constant values of the cathodic potential. From the slope of these curves, we find the effective activation energy.
{"image_source":{"path":"images/14f6c3045a27e9a440ee3ed8b505b6db95d64078308dc3ca7b75f5f8a58cd46d.jpg"},"content":"","chart_caption":[{"type":"text","content":"Fig. 4: Temperature dependence of the current density at various potentials of Te electrode Ek.\n1-0.5; 2 - 0.45; 3 - 0.40; 4 - 0.35; 5 - 0.30; 6 - 0.25; 7 - 0.20."}],"chart_footnote":[]}
Data provided in Fig. 4 show that the logarithmic rate dependence of the electrode process (lgi) on 1 /T in the potential range 0.50 to 0.20 V is linear. With the increase in the cathodic potential, the slope of the curves gradually decreases; in the range of cathodic potentials 0.2 to 0.1 V, it remains almost unchanged.
{"image_source":{"path":"images/416a98a48222ff04120088fa529ba35d731e43291a5adc10048136dc8e68c24f.jpg"},"content":"","chart_caption":[{"type":"text","content":"Fig. 5: The dependence of effective activation energy "},{"type":"equation_inline","content":"A_{eff}"},{"type":"text","content":" from "},{"type":"equation_inline","content":"E_{c}"}],"chart_footnote":[]}
Changing of effective energy activation in dependence from cathodic polarization has shown on the fig.5.The small value of the effective activation energy (12 KJ/mol) in the range of cathodic potentials (+0.2) - (+0.1) V and its insignificant independence from the potential show that in this case the rate of the cathodic process is limited only by the diffusion of discharging ions to cathode surface.
Based on the results, it can be concluded that at cathodic potentials up to 0.2 V, the process of tellurium electrodeposition from a chloride-sulfate electrolyte is accompanied mainly by chemical polarization and the effective activation energy at these potentials reaches 40 kJ/mol, and at a potential of 0, 30–0.25 V the process is controlled by mixed kinetics.
{"image_source":{"path":"images/f9e6c7a7d8a0e4d585e2a98ac1f5e0c9afd846cf08f6eb0101d698f3722f90e3.jpg"},"content":"","chart_caption":[{"type":"text","content":"Fig. 6: Cyclic polarization curves of tellurium obtained from solutions containing "},{"type":"equation_inline","content":"1 \cdot 10^{-3} + 1.5 / + 1.5 / + 0.01 / ()_2; = 0.5"},{"type":"text","content":". Temperature "},{"type":"equation_inline","content":"75^{\circ}"},{"type":"text","content":"; (scanrate "},{"type":"equation_inline","content":" = 0.005\mathrm{VS}^{-1}"},{"type":"text","content":")"}],"chart_footnote":[]}
Thus, the totality of the obtained results give reason to consider that the rate of the cathodic process at the initial stages is limited by chemical difficulties and determined by diffusion only in the zone of limiting current.
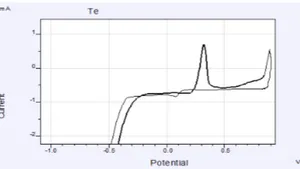
As can be seen from figure 6, one wave is observed on the cyclic polarization curves, which shows the oxidation of tellurium. These data are consistent with the references presented in [9–10]. We have also studied the effect of the electrode substrate (Pt, Ni) on the mechanism and quality of tellurium deposition.
On the figure 7 are presented the cyclic polarization curves of cathodic deposition and anodic dissolution of tellurium on various (Ni) electrodes in solutions containing (mol/l): . Scan speed, temperature 348 °K.
It can be seen from the figure 7 that the cyclic polarization curves of tellurium on a nickel electrode do not differ significantly from the cyclic polarization curves obtained on a platinum electrode. However, oxidation on the platinum electrode occurs at more positive potentials and the maximum on the nickel electrode is lower than on the platinum one.
{"image_source":{"path":"images/3a7dccac7ad28afe0f24b52cdbabd1595e5b013e7724aac47cf023d47a210caf.jpg"},"content":"","chart_caption":[{"type":"text","content":"Fig. 7: Cyclic polarization curves of tellurium on Ni electrode in the electrolyte containing (mol/l): "},{"type":"equation_inline","content":"1 \cdot 10^{-3} TeO_{2} + 1,5H_{2}SO_{4} + 1,5HCl"},{"type":"text","content":"; pH=0.5. temperatur "},{"type":"equation_inline","content":"75^{\circ}C"},{"type":"text","content":"; (scanrate V=0,005 VS "},{"type":"equation_inline","content":"^{-1}"},{"type":"text","content":")"}],"chart_footnote":[]}
Thus, according to the experiments the electrolyte with following composition was proposed to produce thin tellurium films from chloride-sulfate solutions. Electrolyte composition is as follows (mol/l): , , , pH = 0,5
IV. CONCLUSION
With an increase in the concentration of HCl in the electrolyte from 0.5 mol/l to 4 mol/l, the cathodic deposition of tellurium is facilitated, the polarization curves are shifted to the positive side. Thus, in this case, it can be assumed that with an increase in the HCl concentration in solution, partially hydrolyzed tellurium ions dissolve and at 2–3 mol/l HCl - TeCl is formed, which dissociates well into ions, that causes the polarization curves to shift to the positive side.
Therefore, the experiments carried out in solutions containing chloride-sulfate ions show that in the initial stages of the cathodic process the main role is played by chemical difficulties, and at negative potentials of the process they are limited by diffusion polarization.
Based on the results, it can be concluded that at cathodic potentials up to 0.2 V, the process of tellurium deposition from a chloride-sulfate electrolyte is accompanied mainly by chemical polarization and the effective activation energy at these potentials reaches 40 kJ/mol, and at a potential 0.30–0.25 V the process is controlled by mixed kinetics.
The small value of the effective activation energy (12 KJ/mol) in the range of cathodic potentials (+0.2) - (+0.1) V and its insignificant independence from the potential show that in this case the rate of the cathodic process is limited only by diffusion of discharging ions to the cathode surface.
Conflict of Interest
The authors declare no conflict of interest.
Ethical Approval
Not applicable
Data Availability
The datasets used in this study are openly available at [repository link] and the source code is available on GitHub at [GitHub link].
Funding
This work did not receive any external funding.
References
Cite this article
Related Research


Special Issue
Launch a focused special issue to highlight research, emerging trends, and expert insights in your academic field.