



IntelliPaper
Abstract
In this paper usingthe Egy-dronate pharmaceutical drug compound as a green corrosion inhibitor that can decreasing the rate of corrosionon metallic surface,as a result of the adsorption ofEgy-dronateon the metal surface. In this regard, we simultaneously present an overview of Egy-dronate compound performance, as a corrosion inhibitor in 0.5 M H2SO4, and with presence different concentrations of the drug. By using potentiodynamic polarization, and Evans techniques illustrate the nature of adsorption, the effect of medium on the corrosion processes, and the effect of polarization for the orientation of the inhibitor molecule to the CS surface. The surface examination byScanning Electron Microscopy (SEM), Energy Dispersive X-ray (EDX), Atomic Force Microscopy (AFM), and Fourier TransformsInfrared (FT-IR)are confirmed the formation thin film that adsorbed on the metal surface according to the mechanism of the adsorption processes on the polarized metal surface.
Explore Digital Article Text
I. INTRODUCTION
Most organic compounds containing nitrogen (N-heterocyclic), sulfur, long carbon chain, or aromatic, and oxygen atoms are used as a corrosion inhibitors. Among them, organic compounds have many advantages such as large molecular size, soluble in water, availability, cheap, low toxicity, easy for using, and easy production [1]. Natural heterocyclic mixes have been utilized for the corrosion inhibitor on the C-steel [2], copper [3], aluminum [4], and various metals in various aqueous medium [5]. Adsorption of the drug molecules on the metal surface facilitates its inhibition [6]. Heterocyclic mixes have demonstrated more hindrance effectiveness, for C-steel in both HCl [7] and arrangements [8], such as the medications are used inhibitors, that can compete favorably with green inhibition of corrosion, and the most medications can be synthesized from natural products. Selection of some medication as corrosion inhibitors due to the followings: (1) drug molecules contain oxygen, sulfur, and nitrogen as active sites, (2) it is environmentally friendly furthermore vital in organic responses, (3) drugs can be easily produced, and purified, (4) nontoxic compering organic inhibitors. Some medications have been investigated to be great corrosion inhibitors for metals such as Biopolymer gave inhibition efficiency (IE) for Cu in NaCl [9], pyromellitic diimide linked to oxadiazole cycle gave IE for mild steel (MS) in HCl [10], 2-mercaptobenzimidazole gave IE for MS in HCl Antidiabetic Drug Janumet gave IE for MS in HCl [11]. Januvia gave IE for Zn in HCl [12], Cefuroxime Axetil gave IE for Al in HCl [13], Phenytoin sodium gave for MS in HCl [14], Aspirin gave IE for MS in [15], Septazole gave IE for Cu in HCl [16] and
Chloroquine diphosphate gave 80% IE for MS in HCl . Study on Structural, Corrosion, and Sensitization Behavior of Ultrafine and Coarse Grain 316 Stainless Steel Processed by Multiaxial Forging and Heat Treatment . Investigating the corrosion of the Heat-Affected Zones (HAZs) of API-X70 pipeline steels in aerated carbonate solution by electrochemical methods . Predictions of corrosion current density and potential by using chemical composition, and corrosion cell characteristics in microalloyed pipeline steels . Predictions of toughness, and hardness by using chemical composition, and tensile properties in microalloyed line pipe steels .
The scope of this article is used Egy-dronate drug as save corrosion inhibitor for CS in the acid medium by electrochemical method, and to elucidate the mechanism of corrosion inhibition.
II. EXPERIMENTAL
2.1 Metal samples
The sample of CS was used in this study that have the chemical composition of the metal sample was determined by using an emission spectrometer, with the aid of ARL quant meter (model 3100-292 IC) and listed in the Table 1.
Table 1: Chemical compositions of carbon steel sample
| Sample | C% | Mn% | V% | Fe% | Si% |
| CS | 0.26 | 0.77 | 0.11 | 98.51 | 0.35 |
2.2 Preparation of metal sample (working electrode)
Working electrode having the surface area, which, exposed to corrosion media is cross-section area, and the rod was weld from one side to a copper wire used for electric connection. The sample was embedded in a glass of just a larger diameter than the sample. Epoxy resin was used to stick the sample to glass tube. These also ensured that a constant cross-sectional area would be exposed to corrosive media, through the experiments. The sample was scraped with SiC polisher sheet coarseness sizes (400, 800, and 1200), and clean with . Then, clean a few times with bi-distilled water, and dried by soft tissue. Finally, the polishing of sample surface become like a mirror bright, just before immersion in the electrolyte cell.
2.3 Egy-dronate drug as an inhibitor
Egy - dronate drug is mixed inhibitors which consists of two substances Alendronic acid, and Cholecalciferol which describing in Table 2.
Table 2: The Components and molecular structure of investigated inhibitor
| Inhibitor | Structure | IUPAC Name | Molecular weight | Active centers | Chemical formula | |
| (1) | 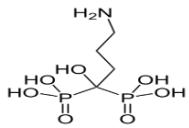 Alendronic acid Alendronic acid | 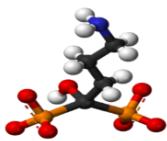 | sodium [4-amino-1-hydroxy-1-(hydroxy-oxido-phosphoryl)-butyl]phosphonic acid trihydrate | 249.097 g/mol | N 7O 2π | $C_4H_{13}NOP_2$ |
| (2) | 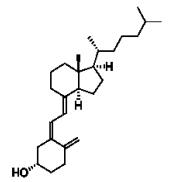 Cholecalciferol (Vit. D3) Cholecalciferol (Vit. D3) | 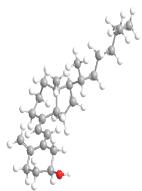 | (3β,5Z,7E)-9,10-secocholesta-5,7,10(19)-trien-3-ol | 384.64 g/mol | O2π | C27H44O |
2.4 Solution
The aggressive solution, was prepared by dilution of analytical grade (98%) with bi-distill water. The concentrations range of the inhibitor were used between 50 ppm to 250 ppm.
2.5 Potentiodynamic polarization measurement
Cathodic, and anodic polarization technique were used for determination the rate of corrosion, by using the electrochemical cell that consists of three electrodes :
1- A platinum electrode (as an auxiliary electrode).
2- Calomel electrode (as the reference electrode). , E equal - 241 mV at .
3- The working electrode is the CS sample. The electrolytic cell was filled with 100 ml of the solution, and the sample was immersed in the medium. Then, the cathodic polarization was firstly measured, and after reverse the current direction the anodic polarization was measured.
2.6 Calculation of the rate of corrosion
The anodic, and cathodic polarization were measured by using the over-potential cells. The corrosion current density ( ), the corrosion potential ( ), and the corrosion rates (R) are calculated according to the Tafel extrapolation method [23].
It is clear that the line representing Tafel region refer by either cathodic, and anodic polarization curve, to obtain the corrosion potential ( ), and corrosion current density ( ), which can be used to calculate the rate of corrosion by the equation (1) [24-25].
Where, Corrosion rate (mpy) = mils per yea, I = the corrosion current density, d = Specimen density, and, Eq.wt = Specimen equivalent weight.
The corrosion current density ( ), corrosion potential ( ), and corrosion rate are recorded in Table 5.
2.7 Applied Evans technique
The Evans diagrams give good and suitable interpretation of the electrode-electrolyte interface reactions. We can use the following definitions for the items of Evans diagram as follows :
1- \Delta\phi{e,m} \text{and} \Delta\phi{e,so} \text{areanodicandcathodicpotentialsatequilibriumattheelectrode-electrolyteinterface (atI=theexchangecurrenti0) respectively, where} \Delta\phi{e,x} = E_{e,x} \pm |E_c - E_a| \text{i}=i_0 \text{; m=metal, so=solution,}
2- the relative corrosion potential determined from the position of the intersection of the two curves (de-electronation and electronation processes) where I considered as the .
3- The anodic- potential difference at equilibrium (a.p.d,e) .
4- The cathodic- potential difference at equilibrium (c.p.d,e) = .
5- The anodic-potential difference (a.p.d) ; b = bulk, x = with additive, at different concentrations or at different temperatures, and .
6- The cathodic-potential difference (c.p.d) ; b=bulk, x= with additive, at different concentrations or at different temperatures, and .
These data can be used for kinetic calculations, and to know, which additive is favorable, or which is faster to the electrode surface at the same conditions. It can be used for studying the inhibition mechanism.
2.8 Surface Examinations [27]
The morphology of the CS surface is used for the analysis by examination nature of the surface, and study of changing that appeared on the metal surface. The specimens were prepared by abraded mechanically by using different emery papers up to 1200 grit size, and immersed in (blank) then with 250 ppm of Egy-dronate at room temperature for one day (24 h). Then, after that the specimen was washed gently with distilled water, dried carefully, and take care to the system of surface examinations by Fourier Transforms infrared (FT-IR), scanning electron microscope (SEM), energy dispersive x-ray (EDX), and atomic force microscope (AFM).
III. RESULT AND DISCUSSION
3.1 Potentiodynamic polarization technique
Study the polarization of the different medium, and with added the various concentrations of Egy-dronate as a corrosion inhibitor.
3.1.1 Dissolution of CS sample in 0.5N at different temperatures
Results of the anodic, and cathodic polarization processes for the CS sample in 0.5M at different temperatures in the absence of Egy-dronate are shown in Figure 1, and Table 5. It was obvious that the corrosion current density ( ) is increased as the temperature increased, and the corrosion potential ( ) is slightly shafted to the more positive value. The polarization processes are started with a potential between about 547, and 553 mV.
{"image_source":{"path":"images/e6be978dcb8a775239d11585ae2063be3e26622e5bbedcfb6cfd763af032794b.jpg"},"content":"","chart_caption":[{"type":"text","content":"Figure 1: The potentiodynamic polarization curves for corrosion of CS in 0.5 M of "},{"type":"equationinline","content":"H{2}SO_{4}"}],"chart_footnote":[]}
The positive potential is increased by anodic polarization, i.e., increase the dissolved component while that the potential decreased by cathodic polarization, i.e., increase the undissolved components. The dissolved component is formed as the following chemical equations :
Where Di-hypo-ferrite, green.
In the same time occurs as
Where the undissolved hydrated, and the (FeO) can be considered. So that at anodic polarization in the presence of , the iron is dissolved, and formed ferrous sulfate as:
And the cathodic processes in the presence of occurred as
i) hydrogen evolution ii) reduced of oxygen
The hydrogen ions adsorbed on the metal surface where an electrochemical reaction takes place in the presence of as:
Where three steps can be done as:
or c.
The positive potential is increased by anodic polarization, i.e. increase the dissolved component while that the potential decreased by cathodic polarization, i.e., increase the undissolved components. According to the following equation:
In total process:
In the bulk the ferrous hydroxide dissolved as:
And,
3.1.2 Effect of add different concentration of Egy-dronate inhibitor
The anodic, and cathodic polarization of the CS in a mixed solution 0.5 M with different concentrations of the Egy-dronate (50, 100, 150, 200, and 250 ppm) at 288K are shown in the Figure 2.
{"image_source":{"path":"images/39d516056f0d611d80692a18861cafb2a3481fc13ea421cd50a2a4c421284673.jpg"},"content":"","chart_caption":[{"type":"text","content":"Figure 2: The potentiodynamic polarization curves for the corrosion of the CS in 0.5 M "},{"type":"equationinline","content":"H{2}SO_{4}"},{"type":"text","content":" with the existence various concentration of the Egy-dronate at 288K."}],"chart_footnote":[]}
3.13 Potentiodynamic polarization technique
It is obvious that the presence of different concentrations are shifted the potentials to low positive values, both anodic potential , and cathodic potential are shifted to low positive values [29]. The anodic current ( ) slightly decreased (shifted to low values) while the cathodic ( ) decreased, and shifted to low values too, that are shown in Figure 3. The values of the corrosion potential ( ), the corrosion current density ( ), and the rate of corrosion in (mpy) are given in Table 5.
{"image_source":{"path":"images/4f25b7a8637d5d334c79a0e4e9fd2e27f6bd7d6f7011076f15728d3a8009be69.jpg"},"content":"","chart_caption":[],"chart_footnote":[]} {"image_source":{"path":"images/2fad257b3fbb15d655874c54d1415625ea5c83d505426b7772fb813b00b951f2.jpg"},"content":"","chart_caption":[{"type":"text","content":"Figure 3: Effect of added the various concentrations of Egy-dronate for anodic, and cathodic polarization curves of the CS metal at 288K."}],"chart_footnote":[]}
2 Applying Evans technique
Applying the principle of Evans diagrams in the presence of different concentrations from the Egy-dronate, which are viewed in Figures 4, and the Evans diagram parameters are listed in Table 3, it is clear that[30]:
The parameters , , , , , and are decreased with increasing the temperatures. In the other hand the , , , and are increased with the temperatures increased.
From the above results that are illustrated by Evans diagrams for the electrode- electrolyte interface of the CS. It is clear that:
In the presence various concentrations of the Egy-dronate under polarization technique. At low Egy-dronate concentrations the de-electronation potential shifted toward more positive values (positive direction), this means that the polarization are affected the donor functional groups of the Egy-dronate molecules, oriented them to the electron sink area on the electrode surface, and slow done the dissolution of the metal. The size of the Egy-dronate molecules allow to cover somewhat area of electron source, so that the electronation potential of acceptor spices shifted to low positive value. It is observed that the shifted of the de-electronation potential is larger than the shifted of the electronation potential. In the other hand the Egy-dronate concentrations increasing the shift of the electronation potential i.e., the Egy-dronate molecules are covered more electron source area on the corroded metal surface with increasing Egy-dronate concentrations, and the electronation potential shift is being that the larger than the de-electronation potential shift, which indicating that the slightly formation of multilayer, which adsorbed on the metal surface. It is clear that the polarization process affects the orientation, and the adsorption of the inhibitor molecules, so that both the metal dissolution, and the hydrogen evolution are slowing down more.
{"image_source":{"path":"images/6156f886604b5326adaef4c79059548d92fc51067ac9ed408250385614fef345.jpg"},"content":"","chart_caption":[],"chart_footnote":[]} {"image_source":{"path":"images/a3c7660333879e4908ef3a4f4ccf125014cd6d8194873e8fe95ae888ddf17354.jpg"},"content":"","chart_caption":[{"type":"text","content":"Figures 4: Evans diagrams of the electronation, and the de-electronation potentials vs. log I for CS with various concentrations of the Egy-dronate at 288K."}],"chart_footnote":[]}
Table 3: Relative parameters from Evans diagram of CS with various concentrations of the Egy-dronate at 288K.
| Conc. ppm | Δφcorr | Icorr | Δφe,m | Δφe,so | Δφ'm | Δφ's | (i)b | (Δφ)b | (Δφ'a)x | Δφ'a | (ΔIa)x | ΔIa* | Δφ/ΔI,a | (Δφ'c)x | Δφ'c | (ΔIc)x | ΔIc | Δφ'/ΔI,c | α,a | α,c |
| 50 | 527 | 1.3 | 498 | 546 | 28 | 22 | 1.54 | 524 | 529 | 5.1 | 1.4 | 0.11 | 49.5 | 521 | 2.1 | 1.4 | 0.04 | 57.24 | 0.57 | 0.45 |
| 250 | 520 | 1.1 | 498 | 546 | 22 | 26 | 1.54 | 524 | 537 | 13.1 | 1.12 | 0.41 | 31.2 | 511 | 13.3 | 1.17 | 0.35 | 38.45 | 0.49 | 0.51 |
3.1.4 Effect of temperature on corrosion behavior
The results of the anodic, and cathodic polarization processes for the CS sample in the corrosive medium are listed in Table 5. The , , and the rate of corrosion were increased with the temperatures increased at the same concentration 150 ppm of Egy-dronate Figure 5.
1. Potentiodynamic polarization technique
The behavior of the anodic, and cathodic polarization are indicated that the rate of corrosion of the CS are stimulated by increasing of the temperature. The increasing of temperatures will be enhance the rate of diffusion of hydrogen ( ) ion to the metal surface beside the ionic mobility, and increasing the conductivity of the electrolyte. Also, at lower temperatures, absorbed hydrogen atoms which are blocked on the cathodic areas, otherwise the increasing the temperatures of the solution, hydrogen will be disrobed from the cathodic area, i.e., the corrosion rate was increased.
{"image_source":{"path":"images/8ed73dc612ba7699a3c6e22168d94d459250ffeae2be2c8b1da95c689c5867f5.jpg"},"content":"","chart_caption":[],"chart_footnote":[]} {"image_source":{"path":"images/65bbefb9bb77d3410d11cbd1b0f66406ad4796d3d7371485e16e0858f41ef6dc.jpg"},"content":"","chart_caption":[{"type":"text","content":"Figure 5: Effect of the temperatures in the presence 150 ppm of the Egy-dronate on anodic, and cathodic polarization curves of the CS metal."}],"chart_footnote":[]}
1- Apply Evans technique
From the Evans diagrams in the presence of 150 ppm Egy-dronate, which are viewed in Figure 6, and the Evans diagram parameters are listed in Table 4, it is clear that:
The parameters (\Delta\Phi{\mathrm{corr}}), (\Delta\Phi'{\mathrm{m}}), (\alpha{\mathrm{a}}), |\Delta\Phi'{c}|, (\Delta\Phi'{\mathrm{a}}/\Delta I{\mathrm{a}}), and (\Delta\Phi'{c}/\Delta I{c}) are decreased with increasing the temperatures. In the other hand (i{\mathrm{corr}}), (\Delta\Phi'{\mathrm{s}}), (\alpha{\mathrm{c}}), |\Delta\Phi'{a}|, |\Delta I{a}|, and |\Delta I{c}| are increased with increasing the temperatures.
From the results that illustrated in Evans diagrams for the electrode-electrolyte interface it is clear that:
The effect of the temperature on the behavior of the Egy-dronate as an inhibitor of the CS corrosion at 150 ppm is discussed. It is obvious that both the electronation, and the de-electronation potentials are shifted to negative, and positive direction respectively by increasing the temperature. This behavior clarify that the metal surface divided the electron sink, and electron source area to the small parts, so that the size of the Egy-dronate sufficient to cover more electron source area be side electron sink.
{"image_source":{"path":"images/b349c166162fe7c5037b9a01a64e152a3498afca50925cab35a2c3ba2cd22a6e.jpg"},"content":"","chart_caption":[],"chart_footnote":[]} {"image_source":{"path":"images/502ad0b888814a35cfa7c5a5925618178b45c6b0a9061753e657ab349a7cc424.jpg"},"content":"","chart_caption":[{"type":"text","content":"Figure 6: Evans diagrams of the electronation and the de-electronation potentials vs. log I for CS in the presence of 150 ppm of the Egy-dronate at various temperatures."}],"chart_footnote":[]}
Table 4: Relative parameters from Evans diagram of CS in presence of 150 ppm of Egy-dronate at various temperatures.
| Temp. | Δφcorr | Icorr | Δφe,m | Δφe,so | Δφ'm | Δφ's | (i)b | (Δφ)b | (Δφ'a)x | Δφ'a | (ΔIa)x | ΔIa* | Δφ/ΔI,a | (Δφ'c)x | Δφ'c | (ΔIc)x | ΔIc | Δφ'/ΔI,c | α,a | α,c |
| 288 | 520 | 1.17 | 502 | 546 | 29 | 17 | 1.43 | 527 | 531 | 3 | 1.2 | 0.21 | 12.89 | 519 | 11 | 1.2 | 0.1 | 80 | 0.6 | 0.4 |
| 328 | 529 | 1.6 | 495 | 556 | 30 | 31.1 | 2.21 | 522 | 538 | 15.1 | 1.75 | 0.61 | 27.22 | 510 | 6.1 | 1.9 | 0.41 | 15 | 0.49 | 0.5 |
, and rate of corrosion for CS in 0.5 at various temperatures
| Conc. (ppm) | Temp. K | Ecorr (mV) | Icorr (mA/Cm2) | Rate (mpy) | $\Theta$ | % IE |
| 0 | 288 | 541 | 11.5 | 4.89 | ---- | ---- |
| 298 | 542 | 11.7 | 4.98 | ---- | ---- | |
| 308 | 543 | 12.1 | 5.16 | ---- | ---- | |
| 318 | 544 | 12.7 | 5.41 | ---- | ---- | |
| 328 | 546 | 13.4 | 5.71 | ---- | ---- | |
| 50 | 288 | 540 | 2.45 | 1.04 | 0.787 | 78.7 |
| 298 | 541 | 2.49 | 1.06 | 0.787 | 78.7 | |
| 308 | 542 | 2.55 | 1.09 | 0.789 | 78.9 | |
| 318 | 544 | 2.62 | 1.12 | 0.793 | 79.3 | |
| 328 | 546 | 2.74 | 1.17 | 0.796 | 79.6 | |
| 100 | 288 | 538 | 2.41 | 1.03 | 0.791 | 79.1 |
| 298 | 539 | 2.45 | 1.04 | 0.791 | 79.1 | |
| 308 | 540 | 2.53 | 1.08 | 0.791 | 79.1 | |
| 318 | 541 | 2.58 | 1.10 | 0.797 | 79.7 | |
| 328 | 542 | 2.68 | 1.14 | 0.800 | 80.0 | |
| 150 | 288 | 536 | 2.38 | 1.01 | 0.793 | 79.3 |
| 298 | 537 | 2.42 | 1.03 | 0.793 | 79.3 | |
| 308 | 538 | 2.49 | 1.06 | 0.794 | 79.4 | |
| 318 | 539 | 2.55 | 1.09 | 0.799 | 79.9 | |
| 328 | 540 | 2.60 | 1.12 | 0.806 | 80.6 | |
| 200 | 288 | 534 | 2.35 | 0.99 | 0.796 | 79.6 |
| 298 | 535 | 2.39 | 1.02 | 0.795 | 79.5 | |
| 308 | 536 | 2.46 | 1.05 | 0.797 | 79.7 | |
| 318 | 537 | 2.51 | 1.07 | 0.802 | 80.2 | |
| 328 | 538 | 2.56 | 1.09 | 0.809 | 80.9 | |
| 250 | 288 | 532 | 2.33 | 0.99 | 0.797 | 79.7 |
| 298 | 533 | 2.36 | 1.01 | 0.798 | 79.8 | |
| 308 | 534 | 2.41 | 1.03 | 0.801 | 80.1 | |
| 318 | 535 | 2.47 | 1.05 | 0.806 | 80.6 | |
| 328 | 536 | 2.54 | 1.08 | 0.810 | 81.0 |
3.2 Inhibition efficiency (IE%)
The Egy-dronate compound possess eight active centers like nitrogen, oxygen atoms, and -bonding are acted as a donor centers. As a result of the restricted un-plainer structure of the Egy-dronate, and some active sites are acted as a donor centers. These centers are oriented, and adsorbed on anodic sites (iron carbide), due to the Egy-dronate molecule is attached to the anodic site, and covered somewhat of cathodic area, so that the corrosion rate in the presence of Egy-dronate is regarded anodic-cathodic control. The inhibition efficiency (IE%) is calculated as following [31].
Where , and are the corrosion current densities in the absence, and the presence of an inhibitor respectively. The inhibition efficiency data is listed in Table7. It is obvious that the IE% for the CS sample increases with increasing the Egy-dronate concentrations.
Plot IE% against logarithm of the concentrations of Egy-dronate inhibitor (log [In]). It is obvious that the increases of the IE% with the temperatures of the medium are increased, this behavior is indicated that chemisorption's occurs. See Figure 7. The extra part in the curvatures that obtained from polarization technique like f shape indicating that the multilayer proceed from the orientation of functional group under polarization where causes second chemical adsorption over the first layer [32].
{"image_source":{"path":"images/8860be6074aad43eaa0643991516b6b8e405054c4b3e8863a4339db467eb9cb0.jpg"},"content":"","chart_caption":[{"type":"text","content":"Figure 7: The relation between the IE%, and log [In] in 0.5 M H "},{"type":"equation_inline","content":"_2"},{"type":"text","content":"SO "},{"type":"equation_inline","content":"_4"},{"type":"text","content":" for CS at various temperatures."}],"chart_footnote":[]}
3.3 Scanning Electron Microscopy (SEM)
The micrographs are obtained for CS specimens in the nonexistence, and in the existence of 250 ppm of Egy-dronate drug after exposure for immersion one day in corrosive medium . It is clear that CS has suitable surfaces for corrosion attack in the blank or corrosive medium only Figures 8 a, b and c. When the Egy-dronate is existence in the corrosive medium, the morphology of CS surfaces is quite different from the previous one, and the specimen surface was smoother. It is clear that the formation of a thin film layer adsorbed on the metal surface, which distributed in a disorder way overall surface of the CS [33]. This may be due to the adsorption of the Egy-dronate on the CS surface, and made up the passive film in order to block the active site present on the CS surface. The Egy-dronate molecule is interacted with active sites of CS surface, resulting in the decreasing contact between CS, and the corrosive medium. From the above sequentially Egy-dronate is exhibited excellent inhibition effect.
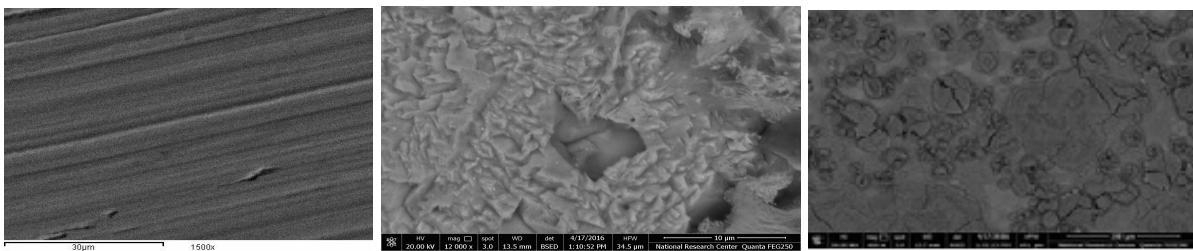
a-Free sample (LCH) b- Blank in 0.5M c-In 0.5 M with existence 250 ppm of Egy-dronate Figures 8 a, b and c: SEM micrographs for CS in the nonexistence, and the existence of 250 ppm of the Egy-dronate after submersion for 1 day
3.4 Energy Dispersion Spectroscopy (EDX) [34]
To determination the elements, and molecules that existence are adsorbed on the surface of CS after one day that immersion in acid with optimum doses of Egy-dronate by using the EDX spectra. The EDX analysis of CS in 0.5 M with in the presence of 250 ppm of the Egy-dronate is given by Figure 9. The spectra show additional lines, demonstrating the existence of C (owing to the carbon atoms of some Egy-dronate). These data shows that the carbon, nitrogen, and oxygen atoms are covered the specimen surface. The EDX analysis is indicated that only carbon, nitrogen, and oxygen are detected, and show that the passivation film is contained the chemical formula of the Egy-dronate drag that adsorbed on the CS surface. It is clear that, the percent weight of adsorbed elements C, N, and O were presented in the spectra, and recorded in Table 6.
{"image_source":{"path":"images/948e9879c7486ba15da9bdc649bc3a3f4af313a537ce1043438908a90428955f.jpg"},"content":"","chart_caption":[{"type":"text","content":"Figure 9: EDS analysis on the CS in the existence "},{"type":"equation_inline","content":"10 \times 10^{-5}"},{"type":"text","content":" M of the Egy-dronate drug for 1 day that immersion in "},{"type":"equationinline","content":"0.5 \, M H{2}SO_{4}"},{"type":"text","content":"."}],"chart_footnote":[]}
Table 6: Surface composition (wt%) of CS after one day that immersion in 0.5 M H2SO4 with 250 ppm of the Egy-dronate
| Wt% | Fe | C | N | O |
| Egy - dronate | 75.97 | 2.08 | 1.88 | 20.68 |
3. 5 Atomic Force Microscopy (AFM)
AFM is a powerful tool to investigate the surface morphology of various samples at nano- micro scale that is currently used to study the influence of corrosion inhibitor on the metal solution interface. From the analysis, it can be gained regarding the roughness on the surface. The roughness profile values is played an important role to identifying, and report the efficiency of the inhibitor under study. Among the roughness is tacked a role for the explanation of adsorption, and illustrated the nature of the adsorbed film on the metal surface . Figure 10 a, shows the 3D images as well as elevation profiles of polished of the CS in the absence, and the presence the Egy-dronate as an inhibitor. Figure 10 b, the surface of CS specimen (a) exposed to corroded solution affected vales structure with large, and deep crack but the surface (b) reveal that is covering film adsorbed on the metal surface. Conclusion, the adsorption film is protected the surface of the metal from corrosion process. From analysis the values, indicating that the higher value of Z parameter reached, which found for the blank solution which placed in one day and analyzed. The observation of the metal surface which immersed in in the presence of of the Egy-dronate as an inhibitor possess small roughness compared with the blank solution. It can be noted that the value is lower than that of the blank value. The decrease in the roughness value reflected to the adsorption of inhibitor molecule on metal surface thereby reducing the rate of corrosion.
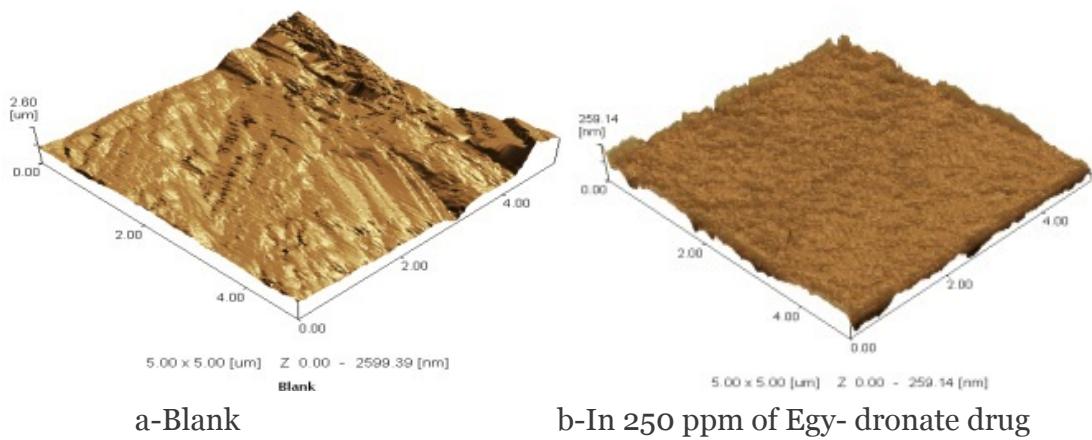
Figure 10 a and b: The 3D of optical images of AFM in the nonexistence, and the existence of the Egy-dronate drug.
3.6 Fourier transforms infrared spectra (FT - IR)
The (FT – IR) spectrophotometer is a powerful instrument that can be used to identify the function group that presence in organic compounds and the type of interaction that occur between function group with metal surface. Since, pharmaceutical drug compound contain variety of organic compound, and these organic compounds (inhibitor) are adsorbed on the metal surface providing thin film that protection them against corrosion, they can be analyzed by using (FT – IR). To confirm the nature of the chemical constituent is adsorbed on the metal surface, by the Fourier transform infrared (FT – IR) spectra .
The pharmaceutical drug compounds are certain have function group according to the chemical formula like OH, C=C and P=O. In order to find the nature of constituents involved in the adsorption using (FT – IR) spectrum of material that are coated the metal surface gives in Figures 11. The spectrum of Egy – dronate before, and after adsorption that seen the wave number of the function groups OH abroad peak at starching, C=C is sharp peak at starching, and P=O a sharp peak between 1140 – 1000 cm starching. It is clear that the function groups of Egy – dronate inhibitor appear on the metal surface that confirm to the adsorption process [38].
{"image_source":{"path":"images/073c0a9a6ca7d2b0f641ed7712470d3a85397733e8c80432d985ffc28015e3ae.jpg"},"content":"","chart_caption":[{"type":"text","content":"Figure 11: FT – IR spectrum of Egy - dronate before and after adsorption on the CS surface."}],"chart_footnote":[]}
3.7 Mechanism of inhibition
To illustrate the mechanism of inhibition of corrosion on the CS surface in acid medium by using pharmaceutical drug compound as an inhibitor, it is must be known the nature of metal surface, and the nature of the component of inhibitor structure. The CS is regarded the metal -phase [39], It is obvious that -phase state consists of grains, and grain boundaries in the surface of the metal, Figure 12. A cross-section of a piece or specimen of the metal that is a corroding to clarify that there are both anodic, and cathodic sites in the metal surface structure.
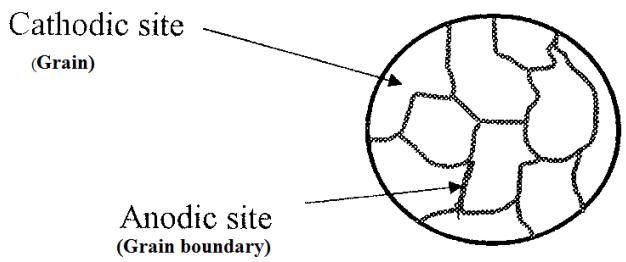 Figure 12: Schema models of metalα- phase
The surface of iron is usually, coated with a thin film of iron oxide. However, if this iron oxide film develops some cracks, anodic area are created on the surface, while other metal parts acts as cathodic sets. It follows that the anodic areas are small surface, while nearly the rest of the surface of the metal large cathodes. Electrochemical corrosion involves flow of electric current between the anodic, and cathodic areas called inter-granular corrosion. Figure 13, SEM image is shown the corrosion of the CS in in one day immersion that illustrated inter-granular corrosion.
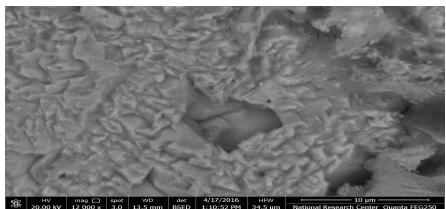 Figure 13: SEM image illustrated inter-granular corrosion after immersion the specimen in 0.5N H2SO4one day
All previous results prove that the pharmaceutical drug compound under study were actually inhibit the corrosion of the CS in solution as a corrosive medium. The corrosion inhibition is due to their physical, and chemical adsorption for formation of protection thin film adsorbed on the metal surface. The effect of Egy-dronate as inhibitor may be corresponding to the accumulation of the inhibitor molecules on the metal surface, which prevent the direction contact of the metal surface with corrosive environment. The surface of the CS sample have positively charge in aqueous acid solution, and the adsorption occur according to [40]:
1- The unshared electrons of nitrogen, oxygen atoms, and electron density of bonding donate to the vacant orbital on the metal surface make chemisorption.
2- The partial negative charge that present in function group containing Oxygen, nitrogen, and electron density of -bond in Egy-dronate may be adsorbed on the positively charge of the metal surface like electrostatic attraction between the opposite charge, in the form of neutral molecules, that involving displacement of water molecules from the metal surface.
The inhibition action of the Egy-dronate can be accounted by the interaction between the lone pair of electrons in the nitrogen, oxygen, and electron density of -bond with positively charged (anodic sites) on the metal surface, and the skeleton of inhibitor compound cover the cathodic sites this action form thin layer adsorbed on the metal surface and prevent corrosion processes Figure 14.
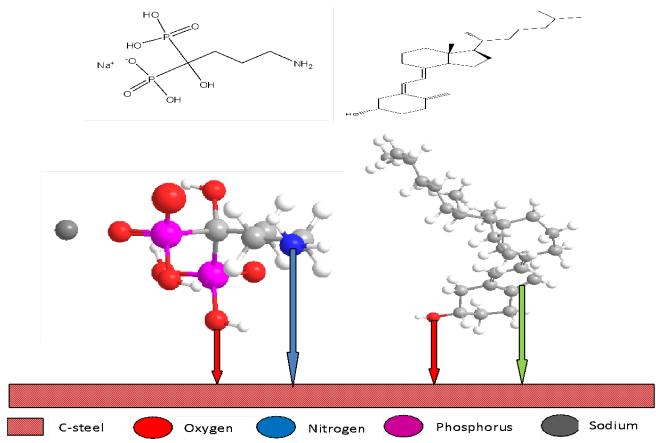 Figure 14: Schema model illustrated the adsorption of the Egy-dronate structure on the CS surface.
This meaning, the Egy-dronate molecule attached with anodic site, and covered somewhat of cathodic area, so that the corrosion rate in presence of Egy-dronate is anodic-cathodic control.
IV. CONCLUSION
Inhibition of the corrosion of the CS in 0.5 M solution by Egy-dronate is determine by potentiodynamic polarization, Evans techniques, and surface examination by Scanning Electron Microscopy (SEM), Energy Dispersive X-ray (EDX), Atomic Force Microscopy (AFM), and Fourier Transforms Infrared (FT-IR). It was found that the inhibition efficiency depends on concentration, nature of metal surface, and the type of adsorption of the inhibitor. The observed corrosion data in the presence the Egy-dronate as an inhibitor:
-
The tested Egy-dronate inhibitor establishes a very good inhibition efficiency for the CS corrosion in 0.5 Msolution.
-
Egy-dronate inhibits the CS corrosion by adsorption on its surface, and forms a thin protective film.
-
The inhibition efficiency of Egy-dronate increases with increasing concentration.
-
The values of inhibition efficiency obtained from all techniques used are seen as validation of the results.
-
The Egy-dronate molecule attaches to the anodic site and covers some of the cathodic area, so that the corrosion rate in the presence of Egy-dronate is under anodic-cathodic control.
Conflict of Interest
The authors declare no conflict of interest.
Ethical Approval
Not applicable
Data Availability
The datasets used in this study are openly available at [repository link] and the source code is available on GitHub at [GitHub link].
Funding
This work did not receive any external funding.
References
Cite this article
Related Research



Special Issue
Launch a focused special issue to highlight research, emerging trends, and expert insights in your academic field.
