



IntelliPaper
Explore Digital Article Text
I. INTRODUCTION
Vibrations on different frequencies and amplitudes occur in all moving vehicles, whether they are passenger cars or commercial vehicles. Efforts to dampen these vibrations have been made since the beginning of the automotive industry, as vibrations have a negative impact on both the mechanical system and the occupants of the vehicle. Vibrations can significantly reduce the lifetime of solder joints in the vehicle's electronic components and of the various mechanical assemblies, such as the internal combustion engine, steering gear or chassis. The degradation effect is significantly increased if the frequency of the vibration is the same as the natural frequency of a component. For people travelling in motor vehicles, vibration can cause long-term pathological changes, where the frequency of vibration is also a determining factor, with different frequencies being absorbed by different tissues and organs. Consequently, neurological and musculoskeletal disorders are common, and many people report spinal pain. Vibrations between 4 and 8 Hz are the most dangerous for the human body. [1] [2]
The vibrations mentioned so far may originate from motor vehicles, especially internal combustion engines, and may be caused by road surfaces and road defects. The latter is the more important cause, so our work will focus on road surface defects. Because of the important role of vibrations in vehicles, it is essential to know the condition and characteristics of the road network.
These up-to-date databases can also assist in the scheduling of road rehabilitation and maintenance works, which is essential for cost-effective and efficient planning.
Major and relatively deep surface defects, such as surface delamination or potholes, are of particular importance as they have the highest damaging effect. These irregularities can cause high amplitude, low frequency vibrations in the vehicle, which are the most damaging from a mechanical and health point of view. Such defects are usually isolated on individual road sections and therefore need to be repaired individually. Furthermore, pavement separation type defects typically develop over a short period of time as a result of high forces. To effectively repair individual road defects, it is necessary to know the exact location of these defects, which can be achieved by an automated vehicle-mounted measurement system that allows high-resolution monitoring of individual road sections. However, the systems commonly available in the field are often expensive and difficult to obtain. [1] [3]
Due to these problems, our goal was to design and develop a system with a simpler architecture, which can be implemented at low cost, and where the desired detection accuracy is provided by sensor fusion. The output of the system should selectively indicate major surface road defects requiring urgent repair. The data should also include the position of each defect with good accuracy.
This paper is organized as follows. Section 2 will review the related works with possible implementations and key issues. Section 3 presents the development of the mechanical and software components of the system, together with the sensor fusion and machine learning steps used. Results and discussion are presented in Section 4, followed by a summary in Section 5.
II. RELATED WORKS
Several approaches have been developed to measure the quality of the road surface to meet the needs. Commonly used solutions are imaging with cameras or LIDAR sensors or 3D mapping of the pavement. These allow detailed and highly accurate mapping of the envelope, but have the disadvantage of expensive sensors and large data overheads, which can cause problems in evaluation and can be time-consuming. In addition, the use of these measurement systems and the mounting of the units typically requires custom-built vehicles. [4] A simpler method of measurement is to infer pavement defects from vibrations in the vehicle, which is the optimal solution in our case. The vibration-based methods are described below.
The dynamics of a general body of a passenger car can be described using a standard quarter-car model. The model is a simplification of the whole vehicle structure, but it describes its behaviour well. The equations thus written establish a relationship between the road surface characteristics and the vehicle suspension and body. Here, the suspension is referred to as unsprung mass and the vehicle body as sprung mass. The model also includes the characteristics of the tyre and spring, shock absorber.
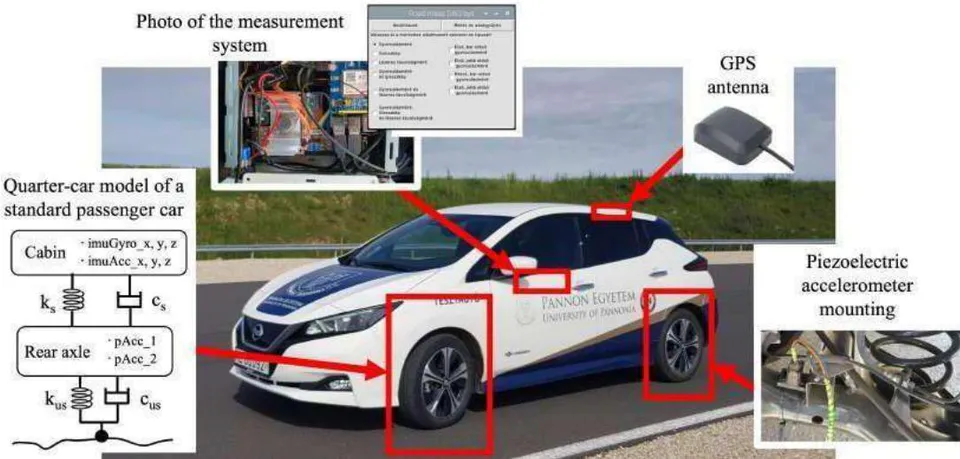
Quarter-car model for a standard passenger car is shown in Fig.1. According to the transfer functions that can be written between the road surface characteristics as the input of the system and the sprung and unsprung masses as the output of the system, the road surface mainly determines the vertical accelerations at the output. Further studies confirm that movements due to road defects can also generate longitudinal or transverse vibrations in the vehicle body. [5] [6]
Vibration-based road quality measurement has the advantage of simpler sensor requirements and a more compact measurement system. Vibrations can be detected using lower cost accelerometers, most commonly analogue piezoelectric or digital MEMS and capacitance variation based types.
The latter can usually be achieved in an enclosure with a gyroscope and magnetometer sensor, also called an inertial measurement unit or IMU sensor. These sensors can detect acceleration, angular acceleration and magnetic field strength along a total of 9 axes. The movements in a vehicle body can be well described by the above data, allowing road quality measurements to be made using a few sensors. These methods are collectively referred to as response-based measurement methods. By fusing multiple sensor data sets, the results can be further refined. [7] [8]
Many works related to road quality measurement in the literature perform the measurement and data processing according to different methodologies. Study number provides a good summary of response-based measurement methods. They divided the studies into three parts, distinguishing between Road Profile Reconstruction i.e. road roughness classification, Pothole Detection and Roughness Index Estimation. In the latter case, the road surface is characterised by means of some generated index, the most common of which is the Inter- national roughness - IRI index.
However, the disadvantage of these indices may be that they do not reflect well on individual but major road defects, but give a general estimate for a given road section. This limits their potential for higher resolution monitoring. The IRI index is usually only calculated for sections greater than 100 m. In Pothole Detection work, the general objective is to detect road defects exceeding a certain parameter, whereas in Profile Reconstruction work, roads are characterised by the calculation of different features, but in these cases the classified sections are composed of small sections, even smaller than 1 metre. Thus, in our research we decided to use these methods.
Power Spectral Density (PSD) has been shown to be a good indicator, providing a good correlation between road unevenness and vehicle or human body ride vibration. [10] [11] A PSD function transforms a signal from the time domain to the frequency domain and provides its frequency spectrum. Digital signal processing provides many possibilities for this, such as Fast Fourier Transform (FFT). The frequency information of the vibration signal than refers to the power of the vibration data over time. The advantage of this is that the small pulse-like effects in the signal are well represented.
A number of different methods are used for the subsequent evaluation process. Some have used a Support Vector Machine (SVM) classification model to classify each stage. This has achieved an average accuracy of 98%. Neural network based Multi-Level Perception (MLP) and decision tree based algorithms have also been tested and have also produced good results. In addition to the vibration data, GPS units were used to collect position data for later locating data points. [7]
Several studies have also focused on the dependence of vibration data on vehicle speed. According to these, a variation in vehicle speed can affect the frequency and amplitude of the measured wheel acceleration, this would introduce relevant errors in the results without correction. No general correction factor can be defined to correct these errors, as the vibrations that occur also depend on the damping factors of the vehicle. In a spatial frequency based resampling was applied, which also greatly reduced this speed dependence. The method can also be used to increase the detection resolution, and we have therefore chosen to use this method in our work.
Spatial based resampling can be done using GPS coordinates, where the location of new data points is defined as a function of distance instead of time. The new values can be acquired by interpolation, where specific query points are defined at arbitrary distances and then the interpolated values are calculated from the original points. By Shannon's law, the chosen then determines the maximum spatial frequency, and hence the maximum resolution. is mainly determined by frequency domain considerations. The spatial sampling frequency after the interpolation is
The sampling frequency gives the Nyquist frequency, which specifies the highest spatial frequency that can be resolved from the vibration data and therefore corresponds to the minimum road irregularity size still detectable after processing. It value can be calculated as follows
We will further use this background to further define the parameters of the interpolation and explore different optimization options in the discussion.
Some studies have also investigated the effect of sensor placement on measurement accuracy.
While in-cab measurement alone can simplify the measurement system design, the quarter-car model suggests that the damping elements in the suspension can significantly distort and isolate the vibrations. Some of the vibrations generated will be transmitted to the vehicle body, but the frequency of the remaining vibrations will also be altered by the system. The shock absorber elements usually distort the high frequency vibrations for the most, which are the most critical from a mechanical failure and health point of view. Thus, the accuracy of the measurement can be greatly increased by placing additional sensing elements on the unsprung mass. Some studies have also addressed the effect of the tyre, but its damping effect is negligible compared to the 0.2 - 0.4 damping ratio of the spring and damper.
III. ARCHITECTURE OF THE MEASUREMENT SYSTEM AND DATA PROCESSING UNIT
These are the basis on which we have constructed the system presented in this chapter. After the hardware architecture, the development of the software data processing algorithms is discussed.
3.1 Hardware Structure of the Unit
The measuring device is based on a Raspberry PI 4 microcomputer, which provides the control of the hardware components, data storage and external peripherals. The single-board computer has sufficient computing power to control multiple external microcontrollers and to implement communication, has directly accessible digital connectors supporting common communication standards, and can be connected to a touchscreen via USB and HDMI connectors.
Road surface defects are detected using two different types of sensors, and for the above reasons, vibrations were measured on both the unsprung and sprung masses. Piezoelectric acceleration sensors of type 805M1-0020 are placed on the vehicle undercarriage to directly detect displacements due to road surface roughness and the resulting acceleration. These sensors are placed on the trailing arms at the rear of the vehicle, so damping elements have less influence on the measurement results. The movements of the vehicle body, or the sprung mass, are detected by an inertial measurement unit (IMU) of type MPU6050 installed in the passenger compartment. The sensor unit includes a 3-axis accelerometer and a 3-axis gyroscope sensor. These data are used to isolate major road defects and sensor fusion methods are used to reduce the impact of vehicle manoeuvres such as cornering and braking on the measured data. The labelling used for each sensor is shown in Fig.1.
The analogue outputs of piezoelectric accelerometers are connected to individually designed signal conditioning circuits containing amplifier, offset and filter elements. The optimised analogue signal is digitised by a 12-bit MAX186 A/D converter, which provides a resolution of 1.22 mV resolution of the input signal in the range 0 - 5 V. The output of the converter is available via SPI and I2C communication, so an ATmega328 microcontroller is used to read the digitized values, and creating a data buffer to reduce the load on the Raspberry PI unit and increase the sampling rate. The I2C communication protocol provides the connection between the microcontroller, the additional sensors and the Raspberry PI in a single-master, multi-slave system. Since the microcontroller operates at 3.3 V and the additional components at 5 V, the communication is established by inserting a dual-channel level shifter circuit. During the measurements, the position data is recorded using a Waveshare SIM7600 type GPS module, which is directly connected to the Raspberry control unit. The sampling frequency of the measurement system is 160 Hz, while the position data are recorded by the device at a frequency of
10 Hz. In addition to the data acquisition and recording elements, we have designed a power supply to fit the system. Its input voltage range of 7.5 V to 35 V allows operation from a car cigarette lighter socket. The picture of the developed system and the mounting to the test vehicle is shown in Fig.1.
3.2 Data Processing and Classification Algorithm
After the design and construction of the hardware units, the software parts were developed, which are presented in this subsection. The algorithm provides the sensor fusion and then evaluates the aggregated data based on a classification model, creating an easily interpretable 1-dimensional objective output. The presented algorithms are developed in a Matlab software environment.
First, the array of 8 data series obtained from the measured values is imported, and then basic signal processing steps are performed to reduce the effect of erroneous values and noise. The raw data series after import are shown in Fig.2. This involves correcting for trend or drift errors using the detrend method. The stationary data series is generated by curve fitting to the values. In practice, typical accelerometers have near-constant measurement biases which, if not compensated, can cause large deviations in subsequent steps. Thus, in addition to removing trend-like errors, attention was also paid to correcting for biases. For the selection and removal of gross error values, a lower and upper bound tolerance band was defined, outside which values were removed from the data set. The limit is defined as three times the standard deviation, with values outside this limit being only 0.27% of the total data according to the normal distribution. In addition, since the GPS sampling frequency was lower than the sampling frequency of the accelerometers, missing data points were made up for by interpolation.
{"image_source":{"path":"images/5e97681eac15161e3e98794474fb38381e4943316b7a0a73afbbb44d7b95ecc8.jpg"},"content":"","chart_caption":[{"type":"text","content":"Figure 2: Imported Raw Data From Specific Accelerometer and Gyroscope Sensors Before Signal Processing"}],"chart_footnote":[]}
The feature extraction aims to reduce the dimension of the initial data block. In this process, we search for features that describe the information content of the original data set with good accuracy and completely. After the signal processing steps, the data points were resampled as a function of distance to reduce the velocity dependence and to achieve the appropriate resolution. For this purpose, the new data points were recorded at a distance of m, resulting in a spatial Nyquist frequency of 20 m–1.
With this parameter we also define the resolution of the data acquisition. Based on and , single envelope defects of significant size are typically 10-30 cm in extent, thus the resolution determined is sufficient to detect them. A power spectrum is calculated from the resampled data points using Fast Fourier Transform. The results are plotted on a spectrogram, which clearly shows the high power data points as a function of distance travelled and spatial frequency, which may indicate the road defects to be detected. The spectrogram also allows us to select a band within the full spatial frequency range where the largest change occurs. As this has the highest information content, it is highlighted in the following, thus reducing the size of the data table.
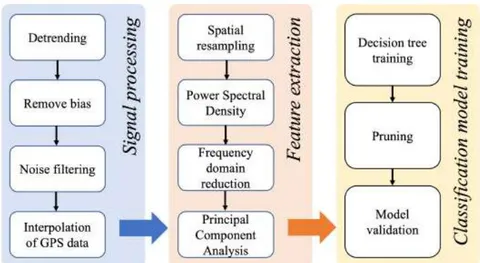
In the next step, Principal Component Analysis was used to distinguish outliers and to examine the correlation of the individual sensor data. The searched values were already well separated from the points around the mean as a function of the first principal component. These PCA scores were used to train a classification model using a decision tree. The model allows us to classify data points into different classes based on objective criteria and also provides a sensor fusion. In the classification process, each data point representing a road segment is classified into 2 classes, where Class 1 represents major road defects requiring urgent intervention. Sections classified in Class 2 are not necessarily free of failures, but only irregularities of minor extent or depth occur. During model training, the accuracy of the output was validated by 10-fold cross-validation and the tree size was reduced by pruning. By cross-validation, a classification accuracy of 96% was obtained. The flowchart of the implemented data processing and classification algorithm is shown in Fig.3
IV. RESULTS AND DISCUSSION
Following the construction of the measurement system, a series of tests were carried out under real-world conditions. These tests focused on the reliability and the accuracy of the system. This chapter summarises the results of these tests.
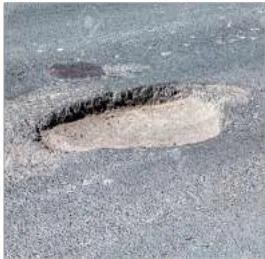
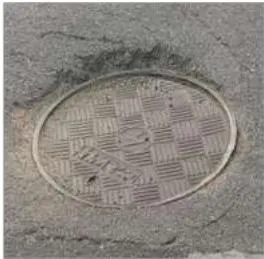
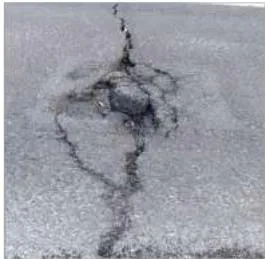
The measuring instrument was mounted on an electric-drive 2019 Nissan Leaf vehicle, as shown in Fig.1. Due to the high resolution, the measurements were largely performed within a populated area, choosing routes as varied as possible. In total, over 70 km of data were collected under varying weather conditions. The previously presented road irregularity types to be detected, which are the focus of this study, are shown in Fig.4 and include deeper potholes, manhole depression and pavement delamination.
The advantage of the system and the sensors used is that external conditions did not affect the operation or usability of the system. During the measurements, the speed varied between 0 km h-1 and 70 km h-1. The results were plotted on maps.
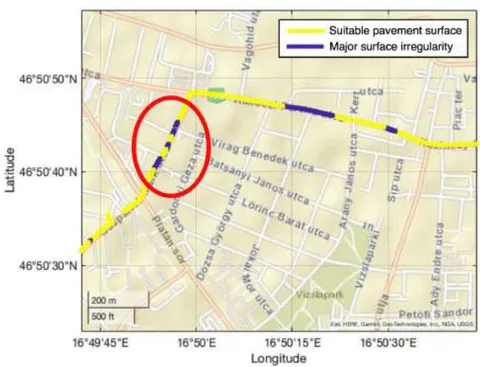
The first presented results are shown in Fig.5 with a map, where the blue colour indicates the location of major pavement defects, and the yellow colour indicates the sections free of these defects. As can be observed, the section under study is largely free of major anomalies, although a few characteristic points have been detected.
The section marked in red circle was the most affected by large surface irregularities, with wider potholes and depressions and asphalt folding. The classification of the data corresponded to our visual observation, with the locations of the indicated road defects corresponding to reality.
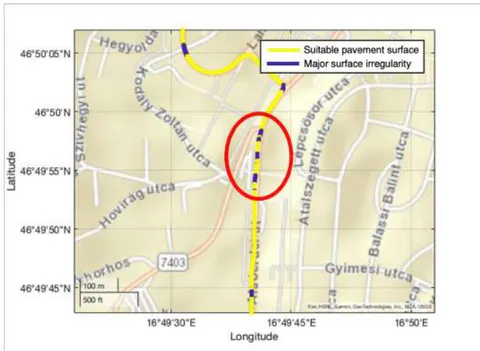
Fig. 6 also shows the results of a measurement in an urban environment. From these data, mainly coherent sections can be distinguished, with significant road surface defects being present together. In these areas, deeper potholes and surface delamination were largely present. In between the contiguous poor areas were sections of improved and repaired asphalt overlay in highlighted yellow locations.
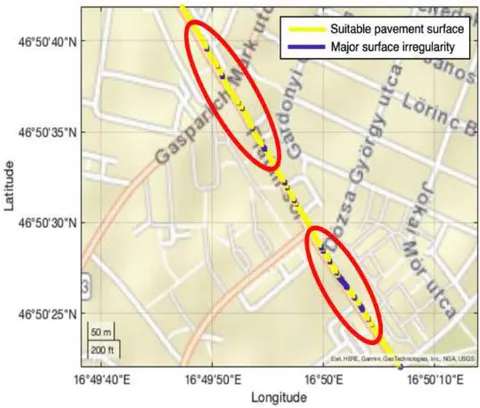
The results of the last measurement presented are shown in Fig.7, also in an urban environment, at a speed of approximately 60 km h . On this section, a generally good quality road surface was observed, but in addition a large number of separate surface defects of small extent were observed. Examples included depressions at the manhole cover and deeper potholes, which are common in many urban environments. These individual road defects detected are highlighted in the red circle on the map showing the classification results. The detected position of the road defects corresponds to our real experience based on GPS data.
In general, the measurement results are consistent with our expectations and visual observations. The detected defects were a good representation of the real road conditions and the classification results provided a good identification of the major poor road sections encountered.
V. SUMMARY
In this study, our objective was to design and test a measurement system capable of detecting separated, high negative impact road surface failures. These individual road defects typically have a high negative impact on both the vehicle mechanical units and the occupants, while monitoring the road network is a costly task. In this context, a universally and easily applicable low-cost system for passenger vehicles was designed. The unit detects surface irregularities using accelerometer and gyroscope sensors and saves them alongside GPS position data. The unit is easily operated from a GUI interface using a touch screen. The results are refined through advanced data processing steps using Power Spectral Density and Principal Component Analysis to extract information from the raw data.
A decision tree based classification model is taught for sensor fusion. The measurement system was tested under real conditions with data collected on public roads. The results showed good accuracy, with deeper road defects well observed. Furthermore, the evaluation of the large data tables was greatly facilitated by the system, which made the data processing process time efficient.
ACKNOWLEDGEMENTS
This work has been implemented by the TKP2020-NKA-10 project with the support provided by the Ministry of Culture and Innovation of Hungary from the National Research, Development and Innovation Fund, financed under the 2020 Thematic Excellence Programme funding scheme.
The program has been supported by the Zala ZONE Automotive Proving Ground Zala Ltd.
DECLARATION OF CONFLICTING INTERESTS
The authors declared that there are no potential conflicts of interest with respect to the research, authorship, and/or publication of this article.
Conflict of Interest
The authors declare no conflict of interest.
Ethical Approval
Not applicable
Data Availability
The datasets used in this study are openly available at [repository link] and the source code is available on GitHub at [GitHub link].
Funding
This work did not receive any external funding.
References
Cite this article
Related Research

Special Issue
Launch a focused special issue to highlight research, emerging trends, and expert insights in your academic field.