

IntelliPaper
Abstract
Crack detection and severity classification are essential tasks in structural health monitoring, especially for critical civil infrastructure such as roads and bridges. Traditional methods rely heavily on manual inspection, which is time-consuming, costly, and prone to human error. This study introduces a computer vision approach using the YOLOv8n model to automatically classify concrete surface conditions into seven categories, ranging from "No Crack" to "Very Large Crack". After augmenting and preprocessing the dataset, the model was trained over 10 epochs and achieved an accuracy of 97.1% and accuracy of 99.9% on the validation set, demonstrating strong classification performance on 53 samples. With a dataset containing over 11,501 images across six categories, the model displayed strong generalization and fast inference speeds reached 0.4ms per image. These results validate the YOLOv8 classifier’s capability for rapid and accurate infrastructure assessment and pave the way for scalable deployment on drones and mobile devices in real-time field scenarios.
Explore Digital Article Text
I. INTRODUCTION
By moving beyond detection and into contextual classification, this project contributes a scalable, interpretable, and safety-focused tool for civil infrastructure inspection. As governments and engineers seek more proactive methods to assess and maintain aging structures, automated crack severity classification represents a critical advancement in ensuring public safety and resource-efficient intervention.
Concrete cracking is among the most prevalent and early detectable indicators of structural distress in bridges, pavements, and public infrastructure. These visual signs, while common, can range in consequence from harmless surface blemishes to critical structural failures. According to Beckmann et al. [1], cracks left unassessed may propagate quickly, leading to severe degradation, moisture intrusion, and rebar corrosion. This underscores the urgent need for inspection systems that not only detect cracks but also evaluate their severity in real time. Over the past decade, deep learning has significantly advanced the automation of crack detection. Semantic segmentation models such as U-Net have been widely adopted due to their pixel-level precision in identifying crack patterns. U-Net's encoder-decoder architecture has proven effective in medical and infrastructure imaging, offering high-resolution maps that clearly delineate crack contours. However, U-Net and similar segmentation models often require large datasets and intensive training resources. Furthermore, their output is typically limited to visual localization, with minimal integration of semantic interpretation such as severity levels. Meanwhile, ResNet-based detectors have been employed for crack image classification due to their strong feature extraction capabilities. ResNet's residual learning framework enables deeper networks without vanishing gradients, allowing accurate binary classification between crack and no-crack images. However, these models still often fail to distinguish nuanced differences in crack width, depth, and spread—factors essential for practical engineering decisions. To enhance performance, some researchers have proposed hybrid approaches, combining CNNs with handcrafted features, SVM classifiers, or decision-tree logic to embed domain knowledge. While these methods show improved accuracy in specific scenarios, they are often complex to implement, less generalizable, and difficult to scale for real-time field deployment. While prior research has shown the utility of CNNs and segmentation models for basic crack detection, these systems typically stop at binary classification, offering no contextual interpretation of risk. However, in practice, engineers must make safety decisions based not only on whether damage exists, but on how severe and urgent that damage is. Human visual inspection, even among trained professionals, can vary depending on lighting, image quality, and experience. Krisada et al. [2] note that such variability becomes especially dangerous when distinguishing between moderate surface cracks and deeper structural damage.
This study addresses those limitations by implementing a YOLOv8n-cls model that classifies cracks across six severity categories, aligned with engineering standards. As a lightweight and fast architecture originally designed for object detection, YOLOv8n offers real-time classification capability while maintaining high accuracy, even on edge devices. By moving beyond detection and into contextual classification, this project contributes a scalable, interpretable, and safety-focused tool for civil infrastructure inspection. As governments and engineers seek more proactive methods to assess and maintain aging structures, automated crack severity classification represents a critical advancement in ensuring public safety and resource-efficient intervention.
Concrete cracking is among the most prevalent and early detectable indicators of structural distress in bridges, pavements, and public infrastructure. These visual signs, while common, can range in consequence from harmless surface blemishes to critical structural failures. According to Beckmann et al. [1], cracks left unassessed may propagate quickly, leading to severe degradation, moisture intrusion, and rebar corrosion. This underscores the urgent need for inspection systems that not only detect cracks but also evaluate their severity in real time. Over the past decade, deep learning has significantly advanced the automation of crack detection. Semantic segmentation models such as U-Net have been widely adopted due to their pixel-level precision in identifying crack patterns. U-Net's encoder-decoder architecture has proven effective in medical and infrastructure imaging, offering high-resolution maps that clearly delineate crack contours. However, U-Net and similar segmentation models often require large datasets and intensive training resources. Furthermore, their output is typically limited to visual localization, with minimal integration of semantic interpretation such as severity levels.
Meanwhile, ResNet-based detectors have been employed for crack image classification due to their strong feature extraction capabilities. ResNet's residual learning framework enables deeper networks without vanishing gradients, allowing accurate binary classification between crack and no-crack images. However, these models still often fail to distinguish nuanced differences in crack width, depth, and spread—factors essential for practical engineering decisions.
To enhance performance, some researchers have proposed hybrid approaches, combining CNNs with handcrafted features, SVM classifiers, or decision-tree logic to embed domain knowledge. While these methods show improved accuracy in specific scenarios, they are often complex to implement, less generalizable, and difficult to scale for real-time field deployment.
While prior research has shown the utility of CNNs and segmentation models for basic crack detection, these systems typically stop at binary classification, offering no contextual interpretation of risk. However, in practice, engineers must make safety decisions based not only on whether damage exists, but on how severe and urgent that damage is. Human visual inspection, even among trained professionals, can vary depending on lighting, image quality, and experience. Krisada et al. [2] note that such variability becomes especially dangerous when distinguishing between moderate surface cracks and deeper structural damage.
This study addresses the limitations of traditional crack detection by implementing a YOLOv8n-cls model that classifies concrete surface cracks into six severity categories. These categories are aligned with industry standards such as the American Concrete Institute (ACI 224R-01) and AASHTO Bridge Inspection guidelines, which define crack width thresholds and provide visual assessment criteria used in determining maintenance urgency and repair methods. Unlike traditional YOLO detectors that localize objects using bounding boxes, the YOLOv8n-cls variant is tailored for image-level classification, removing detection heads to assign a single severity label per image. Despite its lightweight design originally intended for object detection, YOLOv8n-cls maintains real-time performance and high accuracy, making it ideal for deployment on edge devices.
By advancing from simple detection to context-aware classification, this research offers a scalable and interpretable solution for structural health monitoring. The model's severity outputs are directly actionable, consistent with professional inspection protocols, and suitable for integration into existing workflows—such as UAV-based data capture, mobile inspection apps, and embedded systems—supporting on-site decision-making in real time.
Beyond immediate assessment, this classification framework can also feed into predictive maintenance systems and life-cycle cost estimation models, helping engineers and asset managers prioritize interventions and optimize resource allocation. In doing so, the proposed method contributes to safer, smarter, and more proactive infrastructure management.
II. LITERATURE REVIEW
Accurate assessment of concrete cracks is vital for maintaining the integrity of civil infrastructure. Over the years, research has evolved from physics-based simulations to data-driven methods, reflecting the growing need for automation, speed, and interpretability in inspections. Early approaches relied on numerical modeling and traditional image processing, but these proved limited in real-world conditions. This review traces the evolution of automated concrete crack analysis by grouping prior research into several chronological and thematic categories:
2.1 Numerical Modeling of Concrete Behavior
Numerical simulation has historically played a crucial role in understanding the behavior of concrete under load. Beckmann et al. (2012) used the Discrete Element Method (DEM) to simulate concrete fracture and crack evolution, validating the results with experimental data [1]. Their model captured crack initiation and propagation patterns, aiding in structural failure prediction. Džolan et al. further explored the role of shrinkage in reinforced concrete structures, emphasizing the importance of time-dependent effects in numerical simulations [3]. While accurate, these methods are computationally expensive and not scalable for real-time or field-based inspections.
2.2 Traditional Computer Vision Techniques
Before deep learning, crack detection relied on classical computer vision methods, such as edge detection, morphological operations, and thresholding. These techniques struggled with noise, lighting changes, and complex textures. Wang et al. (2024) used machine vision and skeleton analysis to extract features of cracks from processed images . Although such methods laid the foundation for automation, their limited robustness in uncontrolled environments necessitated more intelligent solutions.
2.3 Deep Learning-Based Crack Detection
With the success of CNNs, researchers turned to deep learning for more robust and scalable crack analysis. Park et al. (2020) introduced a system combining deep learning with structured light scanning to detect and quantify concrete cracks with high precision . Chaiyasarn and Golding et al. developed integrated CNN-based systems capable of identifying and mapping cracks across diverse structures. These approaches significantly improved accuracy, yet most remained focused on binary detection rather than severity interpretation.
2.4 YOLO-Based Advancements
YOLO models have recently become popular for real-time crack detection due to their speed and accuracy. Xu et al. (2025) extended YOLOv8-seg for crack segmentation and quantification [9]. Their model incorporated advanced modules like SPPF-MSA and SPDConv, achieving superior accuracy and efficient deployment through pruning and knowledge distillation. Additionally, they introduced a skeletonization pipeline to quantify crack geometry with over 90% accuracy. Zhu et al. (2024) introduced FD2-YOLO, combining spatial and frequency-domain features to detect fine cracks in aerial and ground-level images, outperforming both YOLO-based and transformer-based models [12]. However, both studies focused on detection or segmentation—not classification—limiting their utility for prioritizing repairs.
Raushan et al. compared YOLOv3–YOLOv10 across various image conditions, showing YOLOv4's superior precision and robustness under complex visual backgrounds . Mohanty and Pani (2023) further combined YOLO with machine learning for strength prediction in mining-affected structures . These works confirm YOLO's adaptability but highlight the lack of image-level, multi-class severity classification aligned with inspection standards.
2.5 UAV and Edge Computing Applications
Yang et al. (2022) and others have emphasized the synergy of UAVs and edge computing for infrastructure monitoring. UAV-enabled inspection allows access to hard-to-reach structures, while real-time inference at the edge enables immediate assessment . This fusion is ideal for emergency response and large-scale condition surveys. However, many deployed models focus on detection and segmentation rather than nuanced severity interpretation.
2.6 Cross-Domain Innovations
To demonstrate YOLO's versatility, researchers have applied it beyond civil engineering. Li et al. proposed THDet, a compact YOLOv8-based model for helmet detection, optimized for speed and edge deployment [5]. Liang et al. used an ensemble of YOLO variants for butterfly classification, enhancing performance on small, diverse datasets [6]. While tangential, these studies illustrate YOLO's flexibility for lightweight, domain-adapted modeling and motivate its application in concrete crack severity classification.
2.7 Identified Research Gaps
Real-Time Multi-Severity Classification: Existing YOLO-based methods focus primarily on binary crack detection or pixel-level segmentation, with little attention to severity gradation essential for civil infrastructure triage.
Deployable Models: Most advanced models are too resource-intensive for edge deployment. There is a need for lightweight classifiers that maintain accuracy without sacrificing speed.
Standards Integration: Few studies align their outputs with established civil engineering inspection standards, limiting practical use by field engineers.
This study addresses these gaps by using YOLOv8n-cls—a classification-specific variant of YOLO—trained to categorize cracks into six severity levels aligned with ACI 224R-01 and AASHTO guidelines. Table 1 presents a comparative summary of prior studies and the proposed analysis.
| Study | Method/Model | Task Type | Dataset Size/Source | Output Type | Performance (Top-1/mAP/F1) | Notes |
| Xu et al. (2025) | YOLOv8-seg + Pruning | Segmentation + Measurement | Custom (real-world) | Crack masks + geometry | mAP↑ 6.2%, IoU↑ 4% | Instance segmentation and quantification |
| Zhu et al. (2024) | FD2-YOLO | Detection | RDD2022, UAV-PDD2023 | Bounding boxes | mAP↑, Recall↑, Precision↑ | Dual-backbone with frequency and spatial fusion |
| Raushan et al. (2023) | YOLOv3-YOLOv 10 | Detection | 3,750 varied images | Bounding boxes | YOLOv4: F1 = 88.9% | Tested across complex backgrounds |
| Mohanty & Pani (2023) | YOLO + ML prediction | Detection + Strength Estimation | Satellite, LiDAR, GPS | Damage + Strength | MAE, RMSE, RSE↓ | Predictive maintenance in mining zones |
| Proposed Work (2025) | YOLOv8n-cls | Image Classification | 11,501 annotated crack images | Severity class | Top-1 = 97.1%, Top-5 = 99.9% | Real-time, aligned with ACI/AASHTO, edge-ready |
III. METHODOLOGY
This study proposes a structured pipeline for the classification of concrete crack severity using a deep learning model based on YOLOv8n-cls. The methodology integrates four major phases: (1) dataset preparation, (2) model configuration, (3) training and validation, and (4) performance evaluation. Each phase is aligned with the goal of building a scalable, accurate, and deployable crack severity classifier. In this research, image classification is essential to enabling the AI model to accurately detect surface cracks in construction materials such as concrete. Each image in the dataset is labeled into 5 severity categories and the no crack category, forming the foundation of the model's supervised learning process. These labels allow the model to learn how to differentiate between the severity of structurally compromised surfaces as well as those that are not based on features appearing in each category.
The classification task is critical because cracks often appear in various forms, from thin hairline fractures to wide, deep fissures, and under different lighting conditions or surface textures. Training the model on a diverse and correctly labeled dataset, it learns to recognize subtle variations in shape, brightness, and texture, indicating cracks. In practice, this model's ability to correctly classify these images enables automated crack detection and classification systems, reducing or replacing the need for manual inspections. It also plays a vital role in early warning systems for infrastructure maintenance, helping engineers prioritize repairs and avoid structural failures.
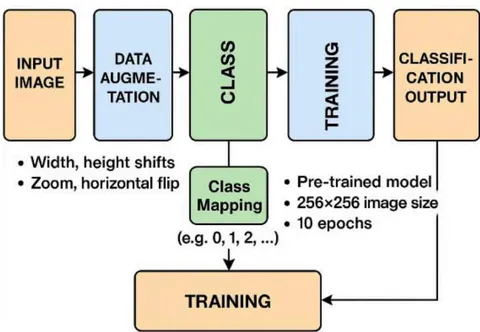
This study presents a comprehensive deep learning framework for the automated detection and classification of cracks on structural concrete surfaces. The core of this framework is built upon the YOLOv8 architecture, specifically the YOLOv8n-cls variant, which was meticulously selected for its optimal balance of speed, accuracy, and computational efficiency. This architecture is particularly well-suited for real-time applications and resource-constrained environments, such as those encountered in Unmanned Aerial Vehicle (UAV)-based inspections or mobile-device applications. The overall model architecture, as illustrated in Figure 2, is a multi-layered system designed to process and classify concrete surface imagery with high precision. The architectural components and their functions are as follows:
Input Layer: The model accepts input images of size pixels with three RGB color channels. This standardized input size ensures consistent processing and computational efficiency.
Data Augmentation Layer: To enhance the model's generalization capabilities and prevent overfitting, a suite of data augmentation techniques is applied to the input images. These techniques include random shifts in width and height (up to ), a zoom range of , and horizontal flipping. The use of nearest neighbor interpolation ensures that these transformations do not introduce spurious artifacts. This process simulates the natural variability of real-world imagery and improves the model's robustness.
Backbone: The backbone of the model is the CSPDarknet architecture, specifically the efficient and compact variant from YOLOv8n. This layer is responsible for extracting a hierarchical set of features from the input images through a series of convolutional blocks. The CSP (Cross-Stage Partial) structure is optimized for efficient feature extraction, reducing computational overhead while preserving rich semantic information.
Neck (PAN + FPN): Following the backbone, a combined Path Aggregation Network (PAN) and Feature Pyramid Network (FPN) architecture forms the model's neck. This component is crucial for feature fusion, enabling the network to combine high-level semantic features from deep layers with low-level, high-resolution spatial features from early layers. This fusion process strengthens the model's semantic understanding and significantly enhances its ability to localize features, a critical step for accurate classification.
Classification Head: Diverging from traditional YOLO architectures that perform object detection with bounding box regression, this model utilizes a dedicated Classification Head. This head is designed to predict a single class label for the entire input image, rather than detecting and localizing objects within it. The model's task is to categorize the concrete surface into one of six predefined classes: "Hairline," "Small," "Moderate," "Large," "Very Large," or "No Crack."
Output Layer: The final output of the model is a Softmax vector of size 6, corresponding to the number of classification categories. The model's prediction is the class with the highest probability value in this vector.
Training Configuration: The base model, a lightweight YOLOv8 classifier, was trained for 10 epochs. The loss function used to guide the training process was Cross-entropy, a standard choice for multi-class classification problems. The model's performance was evaluated using a comprehensive suite of metrics, including Accuracy, F1-Score, a Confusion Matrix, and the Precision-Recall Curve, ensuring a thorough assessment of its predictive capabilities.
The selection of YOLOv8n-cls as the core architecture was a deliberate choice driven by the specific requirements of structural health monitoring. This model offers several key advantages over alternative architectures:
Efficiency: Compared to computationally intensive models like ResNet or EfficientNet, which are designed for high accuracy on large-scale datasets at the expense of speed and memory, YOLOv8n-cls is a lightweight classifier variant. This optimization for real-time inference makes it ideal for deployment on hardware with limited resources, such as embedded systems or mobile devices.
Task-Specific Optimization: Unlike segmentation-based approaches that require pixel-level annotations and are computationally expensive, the classification-focused head of YOLOv8n-cls allows for rapid categorization of crack severity. This provides a direct and efficient solution for automated condition assessment without the overhead of detailed, pixel-level mapping.
Scalability: The modular design of the YOLOv8 framework facilitates a streamlined workflow for training and deployment. This enhances the scalability of the proposed solution, making it easily adaptable to large-scale structural health monitoring programs.
3.1 Dataset
The "Crack Dataset" on Kaggle, Yatata [11] is a collection of labeled images specifically created for training machine learning models to detect surface cracks. It includes two categories: "Crack" and "No Crack," with each image clearly showing damaged or undamaged surfaces like concrete or pavement, as shown in Figure 1.
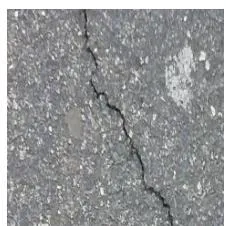
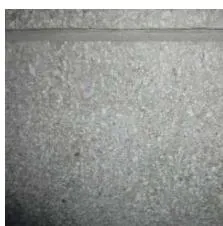
The dataset used in this study is designed to train the selected models to detect and classify concrete cracks under diverse real-world conditions, making it suitable for applications in infrastructure inspection, construction safety, and automated maintenance systems. To ensure the model's ability to generalize effectively to unseen surfaces, the dataset includes images from varied sources and conditions. Each sample consists of a raw image along with its corresponding mask. Initially, the dataset contained 8,819 images of cracked concrete and 1,184 images without visible cracks. To balance the dataset for classification purposes, a subset of 3,600 crack images was selected and combined with the no-crack samples.
These 3,600 crack images were then categorized into six distinct severity classes, including one "no crack" category, through a structured expert survey. The survey involved 30 professionals—civil engineers, inspectors, and contractors—with 5 to over 20 years of field experience in concrete construction and structural evaluation. Participants classified the images based on visual crack characteristics, primarily width, and structural implications, in line with widely recognized standards such as the American Association of State Highway and Transportation Officials (AASHTO) codes. These codes emphasize crack severity in the context of inspection, safety, and serviceability of reinforced concrete structures.
The severity classification criteria used in the labeling process were as follows:
No Crack: No visible signs of surface damage.
Hairline Cracks: insignificant cracks that are very narrow cracks, often less than 0.012 inches (0.3 mm) in width, that are generally not a cause for immediate concern and may not even be considered a defect.
Small Cracks: Narrow cracks under 0.012 inches (0.3 mm) in width, concentrated in a small area and often densely spaced.
Moderate Cracks: Cracks ranging from 0.012 to 0.05 inches (0.3–1.3 mm) in width, potentially allowing water ingress and indicating the need for further inspection.
Large Cracks: Cracks 0.05 inches (1.3 mm) or wider, possibly reflecting structural issues or advanced material degradation or lead to accelerated deterioration of the concrete.
Very Large Cracks: Cracks significantly wider than 0.05 inches (1.3 mm), including patterns of deep longitudinal and transverse cracking that result in isolated sections or "island concrete."
This expert-guided labeling process produced a high-confidence ground truth dataset, serving as the foundation for evaluating the YOLOv8n-cls-based classification model. The final class distribution and examples are summarized in Table 2.
| Severity Level | Image | Severity Level | Image |
| Hairline |  | Large |  |
| Small |  | Very Large |  |
| Moderate |  | No Crack |  |
3.2 YOLOv8 Architecture
This study presents the comprehensive technical implementation of a deep learning model designed for crack detection in structural concrete images. The methodology covers all essential stages of the pipeline—from data preprocessing and augmentation to the design, training, and deployment of the YOLOv8 architecture as shown in Figure 2. A step-by-step overview of the codebase is provided to demonstrate how raw imagery is processed, enhanced, and fed into the model to ensure accurate and efficient classification. Each phase—such as image enhancement, dataset partitioning, and model training—has been meticulously structured to maximize robustness, accuracy, and computational performance. By integrating AI and computer vision, this implementation offers a practical and scalable solution for real-time infrastructure monitoring. In particular, it focuses on developing a high-speed, YOLOv8-based classification system capable of detecting and distinguishing concrete cracks by width and severity, thereby supporting automated condition assessment in structural engineering applications.
The model architecture shown in Figure 2 consist of Input Layer, Data Augmentation Layer, Backbone: CSPDarknet (YOLOv8n variant), Neck:
In the input phase, images are processed with size: RGB that visualize concrete surface images. In the Data Augmentation Layer, techniques that are used is shifting width and height , zoom range , horizontal flip, nearest neighbor to improve generalization, prevent overfitting, and simulate real-world variability. The Backbone layer, extracting hierarchical image features and compact and efficient convolutional blocks optimized for speed and accuracy. The Neck layer (PAN + FPN) feature fusion across different scales, and strengthens semantic understanding and enhances spatial localization. The classification Head replaces bounding box detection with class prediction, and predicts one of 6 class labels (Hairline, Small, Moderate, Large, Very Large, No Crack). In the Output Layer, a softmax vector of size 6 (number of categories) interpreted with highest probability is chosen. The Training Configuration base model is a lightweight YOLOv8 classifier over 10 epochs, loss function using Cross-entropy. It is Evaluated based on accuracy, F1-Score, confusion Matrix, precision-recall curve YOLOv8n-cls was selected as the backbone architecture for this study due to its unique balance between speed, accuracy, and computational efficiency, making it particularly well-suited for edge deployment scenarios such as UAV-based inspections or mobile applications. Unlike heavier classification models like ResNet or EfficientNet, which offer high accuracy at the cost of increased memory and inference time, YOLOv8n-cls is a lightweight classifier variant optimized for real-time applications with limited hardware resources. Compared to segmentationbased approaches that require detailed pixel-level annotations and longer processing time, the classification head in YOLOv8n-cls allows for rapid severity categorization without compromising overall performance. Additionally, the modular YOLOv8 framework facilitates streamlined training and deployment, further enhancing the scalability of the proposed solution in practical structural health monitoring workflows.
3.3 Augment Data
Data augmentation is a fundamental technique in deep learning, particularly useful when working with image datasets that may be limited in size or diversity. In this study, data augmentation is applied to artificially expand the training dataset by introducing slight variations to the original images. These variations include shifting the image slightly to the left or right, up or down (width and height shifts), zooming in or out, and flipping the image horizontally. Such transformations help the model become more robust by exposing it to a wider range of image orientations and compositions, improving its ability to generalize to new data. Additionally, these techniques help prevent overfitting by ensuring the model does not become too narrowly tailored to the original training images. All augmented images are generated using appropriate fill techniques to maintain visual integrity at the image borders. As a result, this process enhances the overall quality and diversity of the dataset, ultimately contributing to more accurate and reliable crack detection in structural imagery.
The following list is a description of what each type of augmentation does and how much it affects the image. These are randomly distributed for each image that is processed, so there is a high chance for each image an augmentation can occur twice. For example, an image may be shifted 20% left even with the variable set to 10%. With these ranges the augmentation does not remove any important information of the image, allowing for more noise in what the model will be able to identify.
Width and height shift (0.1): Randomly shifts images horizontally and vertically by 10%.
Zoom range (0.1): Randomly zooms in or out by 10%.
Horizontal flip (True): Flips images horizontally to introduce variation.
Fill mode ('nearest'): Fills empty spaces created by transformations using the nearest pixel values.
The function augment_class() applies these transformations to images in each folder as shown in Table 3. It ensures that each class has a specified target number of images by calculating how many augmentations each original image needs. The images are then loaded, converted to arrays, and passed to the Image Data
Generator.flow() function, which generates augmented images and saves them to the specified directory. This method ensures that the dataset remains balanced and diverse, improving the model's ability to recognize patterns and variations in real-world data.
| Augmentation Type | Original Image | Augmented Image | |
| Shift Up 20%Shift Left 10% | a) |  |  b) b) |
| FlipShift Left 20%Shift Down 10% | c) |  |  d) d) |
| FlipShift Left 20%Shift Down 10% | e) |  |  f) f) |
3.4 Class Mapping
Since YOLOv8 requires class folders to be numbered starting from 0, we use a class_mapping dictionary to convert our original human-classification category folders such as Category_1_Hairline, Category_2_Small into numeric folder names (0, 1, 2,...) that YOLOv8 expects. This mapping allows us to reorganize the dataset automatically, ensuring that YOLOv8 can correctly associate each image with its class label based solely on the folder structure, without needing separate label files for classification tasks.
3.5 Model Training
In the training segment, we begin by initializing the YOLOv8 classification model using the pre-trained lightweight base model yolov8n-cls.pt. The model is trained on the reorganized dataset found under version_1.1/ Categories_Augmented, which includes images sorted into five severity-based categories. All input images are uniformly resized to 256×256 pixels to match model expectations. Training is conducted over 10 epochs, leveraging GPU acceleration to optimize performance.
Following training, the model is evaluated on a separate validation dataset to assess its ability to generalize to unseen examples. This validation phase is essential to verify that the model's strong performance is not due to overfitting on the training data. Once complete, we locate the most recent training run directory, from which we extract the model weights and training logs for further analysis. These outputs enable downstream visualization and deployment, ensuring traceability and reproducibility of model behavior.
3.6 Confusion Matrix
The confusion matrix, illustrated in Figure 3, serves as a key diagnostic tool for evaluating the performance of a classification model. It presents a comprehensive comparison between predicted and actual labels, offering insight into the model's ability to correctly distinguish between classes.
The matrix includes four core components:
True Positives (TP): Cases where the model correctly identifies a positive instance.
False Positives (FP): Instances where the model incorrectly classifies a negative case as positive.
True Negatives (TN): Cases where the model correctly identifies a negative instance.
False Negatives (FN): Instances where the model fails to detect a positive case, predicting it as negative.
By analyzing the distribution of these values, one can assess not only overall accuracy but also precision, recall, and the balance of class-specific predictions. To achieve this in the model we must first flatten the validation images into one folder for our model to predict.
{"image_source":{"path":"images/e98ee8119b6160e64b490c6192898a9a85e5a87fe0e3cb1bafab08bece4f5291.jpg"},"content":"","chart_caption":[{"type":"text","content":"Figure 3: Confusion Matrix on Flatten Validation Dataset"}],"chart_footnote":[]}
3.7 Accuracy
Monitoring accuracy over training epochs is a critical part of evaluating and refining deep learning models. It helps researchers understand how well a model is learning over time, detect potential overfitting or underfitting, and make informed decisions about early stopping, learning rate schedules, or architecture changes. For multi-class classification problems like crack severity analysis, these plots provide insight into the model's convergence behavior and consistency across iterations.
Figure 4 shows the Top 1 and Top 5 accuracy of the YOLOv8n-cls model across 10 training epochs. The Top 1 accuracy curve begins at approximately 90.1% in the first epoch and steadily climbs, reaching about 95.7% by the final epoch. This gradual increase with minor fluctuations, such as a dip around epoch 4 followed by a strong recovery demonstrates a healthy learning curve. Importantly, the model continues improving beyond the midpoint, suggesting that additional epochs could lead to even better results without immediate signs of overfitting.
Meanwhile, the Top 5 accuracy remains remarkably stable, hovering just below throughout the training process. This almost perfect Top 5 performance indicates that the correct label consistently ranks among the model's top predictions, even in the early stages of training. Such a pattern is particularly valuable in real-world applications where multiple severity levels might appear visually similar, and model confidence can be leveraged to inform inspection priorities.
Overall, the accuracy-over-epochs graph confirms that the YOLOv8n-cls model not only converges effectively, but does so with high stability and deployment in structural health monitoring robustness, reinforcing its reliability for systems.
{"image_source":{"path":"images/8cd50c4905df54019d18d6c78ae38d9c5d56aa21b730c20f02e302eefaa1d851.jpg"},"content":"","chart_caption":[{"type":"text","content":"Figure 4: Accuracy over Epochs"}],"chart_footnote":[]}
3.8 F1 Score
In multi-class classification problems such as crack severity assessment, relying solely on accuracy can be misleading—especially when class distributions are imbalanced or some categories are more difficult to distinguish than others. This is where the F1-score becomes crucial. The F1-score balances precision (how many predicted positives were correct) and recall (how many actual positives were correctly identified), providing a single metric that reflects both false positives and false negatives. The macro F1-score is the unweighted average of F1-scores across all classes, treating each class equally, regardless of how many instances it has. In contrast, the micro F1-score aggregates the contributions of all classes by counting total true positives, false negatives, and false positives, giving more weight to larger classes.
In this model's classification report, both the macro F1-score and micro F1-score are 0.9818, indicating high and consistent performance across all categories. The alignment of these two metrics suggests that the model performs well not just overall, but also at the per-class level, demonstrating fairness and balance in its predictions. Particularly notable is the model's ability to maintain near perfect F1-scores (1.00) for critical classes like "Moderate" and "Small" cracks while still achieving strong scores for more challenging categories like "Very Large" and "No
Crack." This balanced performance is essential in real-world applications, where misclassifying even a single high-severity crack could lead to safety risks or costly maintenance delays. Thus, strong and closely aligned macro and micro F1-scores confirm the model's robustness and reliability in structural health monitoring tasks.
3.9 Precision-Recall (PR) Curve
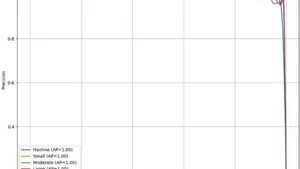
The Precision-Recall (PR) curve shown in Figure 5 illustrates the model's ability to balance precision and recall across all six classes (five severity categories and no crack) in the crack classification task. In this curve, each class, Hairline, Small, Moderate, Large, Very Large, and No Crack, is plotted with a nearly flat line at the top of the graph, with average precision (AP) values of 1.00 for every class. This outcome strongly suggests near-perfect performance, where the model maintains both high recall and high precision throughout the range of thresholds.
This is particularly significant in real-world scenarios where false positives and false negatives have serious implications. For instance, high precision ensures that when the model predicts a "Very Large" or "Corrosive" crack, it is almost always correct, minimizing unnecessary repairs. Conversely, high recall ensures that critical damage is not overlooked. The ability to consistently perform well in both dimensions across all categories, including the often misclassified "No Crack" class, demonstrates a robust and well-calibrated model.
Another key takeaway from this PR curve is the stability of model confidence. The flat segments near the top indicate that the model sustains its high performance across a wide range of threshold values. This is valuable for deployment in varying operational conditions where confidence thresholds might need to be adjusted to favor either sensitivity or specificity depending on safety requirements.
{"image_source":{"path":"images/c2ee423abd8b0cf14844549a6e7a2e1a4873847cb1860915b2648fdda8be3878.jpg"},"content":"","chart_caption":[{"type":"text","content":"Figure 5: Smoothed Precision-Recall Graph for Each Class"}],"chart_footnote":[]}
IV. CONCLUSION
This research presents a comprehensive and highly accurate approach to classifying concrete crack severity using the YOLOv8n-cls model. Starting from foundational convolutional neural network-based detection, the project evolved to encompass multi-class classification aligned with engineering standards. The dataset was carefully curated and reorganized into six distinct categories, with labels reflecting real-world structural implications.
The model was trained in an augmented dataset of over 11,000 images and validated on 1,600 additional samples. It achieved accuracy of 99.9%, reflecting strong generalization and class-wise performance. The precision-recall curve confirmed outstanding reliability, with Average Precision (AP) of 1.00 for each of the six main crack classes. These results point to a model that maintains high confidence and prediction stability across a range of decision thresholds, an essential trait for real-world deployment. The model's inference speed of 0.4 milliseconds per image supports applications in embedded systems, UAV inspection, and real-time structural monitoring environments.
The evolution from basic crack detection to contextual classification marks a critical advancement in infrastructure safety assessment. By embedding engineering relevance into each decision, the model helps bridge the gap between
AI perception and civil engineering priorities. This research offers a deployable, interpretable, and efficient solution for automated crack severity assessment, enabling faster, safer, and more objective evaluations of structural health.
LIST OF REFERENCES
Conflict of Interest
The authors declare no conflict of interest.
Ethical Approval
Not applicable
Data Availability
The datasets used in this study are openly available at [repository link] and the source code is available on GitHub at [GitHub link].
Funding
This work did not receive any external funding.
References
Cite this article
Related Research

Special Issue
Launch a focused special issue to highlight research, emerging trends, and expert insights in your academic field.