




IntelliPaper
Abstract
Drought is a serious problem in Karnataka, which is predominantly a 60 to 70% dry farming state. The development of any micro, mini, sub, or watershed area using a different approach is only the key solution, and it is no longer a secret. The village of Gudumadanahalli is separated into sections depending on the origin and flow direction of water drains / streams. Water harvesting and drainage line treatment buildings were discovered using a study of topo-sheet and LANDSAT images of the region, as well as other parameters such as soil type, slope type, land use / cover, waste lands, hydro-morphology, forest cover, command area, and so on. Prioritization is important in identifying groundwater potential that requires immediate attention so that it can be developed with available resources. An attempt has been made to prioritise the study area based on several criteria, with the total weightage of marks given in the table. Data for these criteria were generated using remote sensing, GIS, and other resources. The study also demonstrates that when remote sensing and GIS are used in tandem, they provide ample scope for the integration of spatial and non-spatial data, which can be successfully used to prioritise any of the watersheds in a more scientific and unbiased manner.
Explore Digital Article Text
I. INTRODUCTION
Groundwater is a highly valued natural resource that promotes human health while also being cost-effective for development and ecological variety. Groundwater is a type of water that fills all of the gaps in a geological section. Water-bearing formations in the earth's crust serve as transmission routes as well as reservoirs for storing water. In India, 80 to 90 percent of the rural population and about 30 to 40 percent of the urban population rely on groundwater for domestic needs (A.A. Akinlalu et al. 2017, Krishnamurthy et al., 1996, Suresha and Taj., 2019, Suresha and Jayashree 2019. Groundwater is a geological formation that exists under the Earth's surface in the pore spaces and cracks of rocks and sediments. The extent of exploitation is essentially determined by the creation of porosity. High relief and steep slopes promote drainage, but topographic depressions improve infiltration. When compared to a low density region, a higher drainage density area increases surface runoff. Surface water bodies include streams, tanks, check dams, and ponds. This serves as the study area's recharging ground water potential zone (Murugesan et al., 2012, Ramya et al., 2019 and Suresha et al 2014).
Certain key characteristics of groundwater, including temperature huge and non-predictability, very good limited vulnerability, lower development expense, and drought dependability, have exposed its impertinence as the single trustworthy provide of water for any weather conditions. 2005, Todd and Mays Heath, R. (2004) Freeze, R., and Cherry, J. (1987) B. M. Hussien, A. S. Fayyadh 1996 William, M., Thomas, E., and Franke, O. (1999)), it is able to be tapped when necessary and is less affected by cartotropic processes (Manap et al 2013 According to the crucial Central Groundwater Department, roughly 85 percent of rural, 50 percent urban, and 65 percent irrigated water demands are met with the help of groundwater throughout the country. Thus, groundwater depletion is a critical issue due to population growth, increasing demand, and limited availability in the last 35 to 40 years across a big portion of India, particularly in the states of Karnataka, Tamil Nadu, Andhra Pradesh, Punjab, Rajasthan, and many others. Unscientific research of floor water growing water pressure situation has resulted from some of the importance of developing groundwater based largely on availability want. This disquieting state of affairs requires a fee and time powerful techniques for proper evaluation of groundwater belongings and management making plans.
Remote sensing (RS) is an emerging technology. It is a very advanced instrument for handling, discovering, analysing, and managing essential groundwater resources (Krishnamurthy and Venkatesesa, 1996, Sabins, 1997; Sander, 1997; Teevw, 1999; Singh and Prakash, 2003; Sikdar et al., 2004, Kusky and Gad, 2006; Sultan et al., 2008; Dinesh kumar et al., 2007). GIS has evolved into a standard and necessary instrument for controlling geographic information in the discovery, development, and management of the earth's resources. ArcGIS software works with data on geographical patterns or features, as well as their properties. It is a higher level computer coded map that allows for the storing, selected dedicated modification, display, and output of geographic information. Remote sensing and geographic information system integration has shown to be efficient, quick, and cost effective. This approach generates useful data on geology, geomorphology, lineaments, and slope, as well as a systematic integration of these data for groundwater potential zone study.
II. STUDY AREA
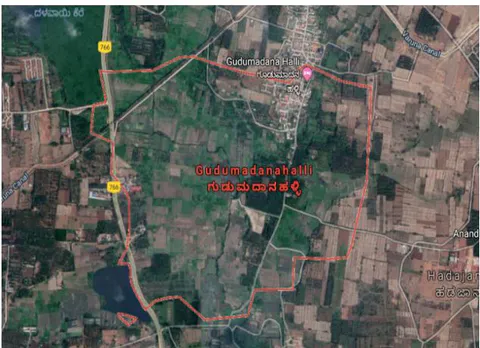
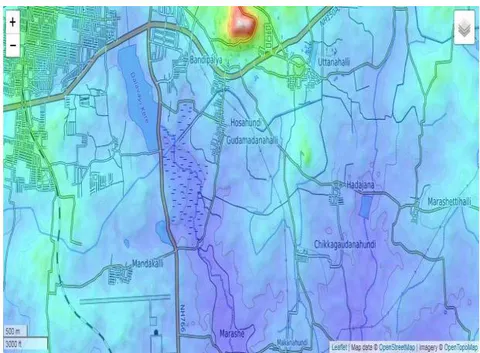
The present work has been carried out for the village of Gudumadanahalli Fig.1 is located in Mysore taluk of Mysore district in Karnataka, India. It is situated 3 Kms away from Mysore, which is both district & sub-district headquarters of Gudumadanahalli village. As per 2009 stats, Hosahundi is the gram panchayat of Gudumadanahalli village (Fig.1 and 2). The total area of village is 179.71 hectares. Gudumadanahalli has a total population of 850 people. Among this, Net shown area of 179.71 ha, Total Un-irrigated land of 118.35 ha and Total irrigated area of 27.24 ha (Table 3.1). As per 2019 stats, Gudumadanahalli village comes under Varuna assembly & Chamarajanagar parliamentary constituency. have another problem. There, drinking water sources have dried up, as water table has depleted by a great extent. Many villages nested at the foot of the Western sides. On one side of the village, greenery abounds. But inside the village, land that has turned dry, plants and trees which have withered due to strong sunshine, dried wells and bore wells have made the people to hanker for water that has vanished. Study is a progressively converting into an urban area. As result of rapid urbanization the demand of water is increasing day by day. Main objectives of the study are as follows:
Identify the underground water potential zones and problematic areas for underground water harvesting.
Mapping of freshwater potential zone using spatial and non-spatial methods.
Supply and securing of clean and sufficient drinking water for the population.
III. METHODOLOGY
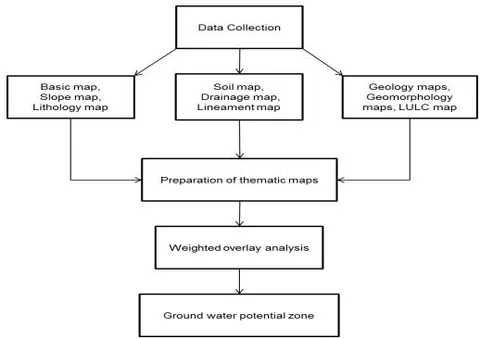
The current research field is comprised of four primary components. It entails gathering data from satellites, analysing topo sheets, creating maps, and making extensive use of supplementary data. PAN and LISS collect satellite data from a specific source. Topo sheet data are utilised as the basis map, which serves as the backdrop for a map. It comes from the Geological Survey of India. Thematic maps are used to collect information about the current research region, such as soil type, slope of the area, rainfall data, geology, and geomorphology. These maps are submitted to supervised classification, and the characteristics for the ARC map are generated. Generated these thematic maps are overlaid using weighted overlay analysis in spatial analyst tools to obtain the final groundwater prospect map of study area.
IV. PRIORITIZATION OF SUB WATERSHED
Some of the restricted resources, if not adequate to handle the research field in a timely manner Prioritization of watersheds is important in identifying any micro watershed or specific region that requires immediate attention or action plan that can be taken of development with available resources. This also makes it easier to address the problematic areas and find appropriate solutions. Because it involves an integrated approach, the resources-based approach is found to be realistic of watershed prioritization. An attempt was made to prioritization of Gudumadanahalli village was done based on several criteria like soil, rainfall, slope, wasteland, irrigated area. Based on this analysis, we found the scores in table thus the study also proves that remote sensing and GIS when synergistically used provide ample scope for the integration of spatial and non-spatial data can successful adopted to prioritization the Gudumadanahalli village in more scientific and unbiased manner.
{"image_source":{"path":"images/f709c6705e64e30e4813e19ecf3a969bf224f30f995e5cb39a04ccb80c41179a.jpg"},"content":"","chart_caption":[{"type":"text","content":"Fig. 4: Rainfall data of Gudumadanahalli"}],"chart_footnote":[]}
The average rainfall in Mysore Taluk is 776.7 to 780 mm. The district has 53 wet days on average, with the southwest monsoon accounting for almost half of the annual rainfall (Fig. 4). Rainfall tends to decrease from west to east. The coefficient of variation ranges from roughly 30% in the west to over 35% in the east, indicating that rainfall is more constant in the west than in the east. Pre-monsoon rainfall is more reliable than post-monsoon rainfall. The southwest monsoon was normal from 1994 to 1999, but excessive in 2012, and the northwest monsoon is significantly better compared to being excessive to normal in recent years. Annually, there are more normal to exceptional rainfall years than deficient years. While the district had excessive rainfall in 2014 and 2016, Rainfall was typical in 2010, 2011, and 2012, with the exception of 2006 and up to the present. In April, the average minimum and maximum temperatures range from 34 to 21.4°C to 16.4 to 28.5°C in January. The relative humidity ranges from 21 and 84 percent.
5.1 Lithology Map
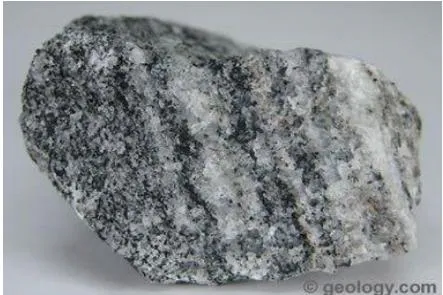
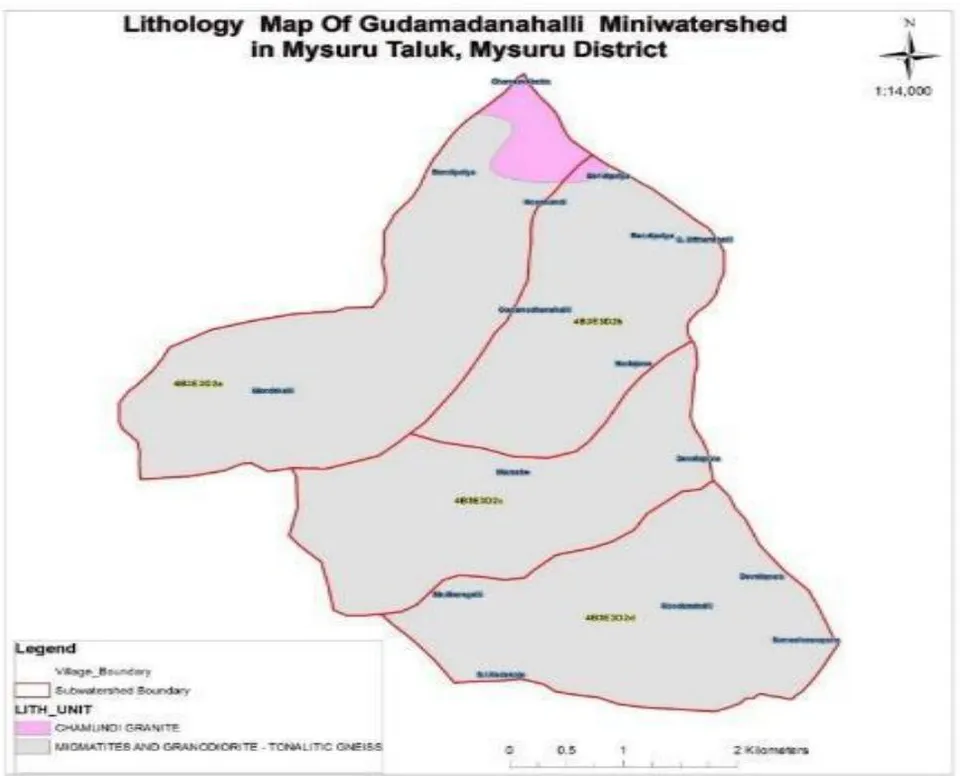
The current research investigation identifies two kinds of rocks: Chamundi granite and tonaltic gneiss. Tonaltic gneiss dominates the region of approximately 34051 m2 (Fig. 6 and 5). Granite intrusion is frequent in the 750 Ma ancient landscape, according to Janardhan et al. (1978). (Srikantappa et al., 1992). Pink granite bodies abound from Chamundi hill onward. The rocks are pink and grey granite geologically, depending on the materials present. When compared to the surrounding peninsular Gneissic rocks of Sargur-kabbal durga, these youngest igneous rocks (0.8 billion years old) are the result of recent volcanic activity (3 billion years old) (Gazetteer., 1988, Srikantappa and Prakash Narasima., 1992). The entire tract areas around is essential made up to of a tract of pinkish granite. It is an igneous rock made with combination of plagioclase feldspar with quartz. The different types of rocks (Gneiss), Fig.5. and its area have been depicted in the Table 3.
| Sl. No | Type of rock | Area (m2) |
| 1 | Chamundi Granite | 850 |
| Migmatities and Granodiorite – Tonalitic gneiss | 34051 |
5.2 Lineament map
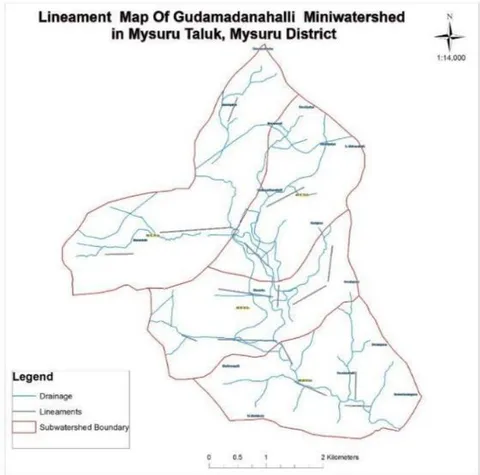
A lineament is a landscape feature that is a linear manifestation of an underlying geological structure, such as a fault. A lineament is typically depicted as a fault-aligned valley on geological or topographic maps, and it is visible on aerial or satellite pictures, as seen in Fig.1. Lineaments are the primary conduits of freshwater in impermeable rocks all around the world. Indeed, the fracture planes form the useful void volume, which corresponds to the potential space that water can occupy in such a medium. The aperture, positioning, interconnection, and direction of fracture planes all have an effect on the occurrence and flow of underground water supplies in broken aquifers. As a result, zones with open, regular, and jointed fractures can be favorable for water occurrences. The majority of the lineaments in the region follow the pattern of stream courses. Lineaments are concerned with high porosity and hydraulic conductivity zones (Subba Rao and Prathap, 1999; Subba Rao et al., 2001 and Pojashree et al., 2021) Normalized transmissivity is elevated near the lineaments, and there is an outstanding association between higher fracture densities and higher well yields (Magowe and Carr, 1999). In general, the thickness of weathered/fractured rock is supposed to be greater along the lineaments, and hence the lineaments are thought to have a control on the supply of underground water (Fig.75). The fractures and lineaments are important in rocks where secondary permeability and porosity dominate. Some fracture lines/linear features are observed in study area. Lineaments are fracture lines/linear features formed by tectonic action that represent a general surface manifestation of underground fractures with inherent porosity and permeability characteristics of the underlying
5.3. Soil Map
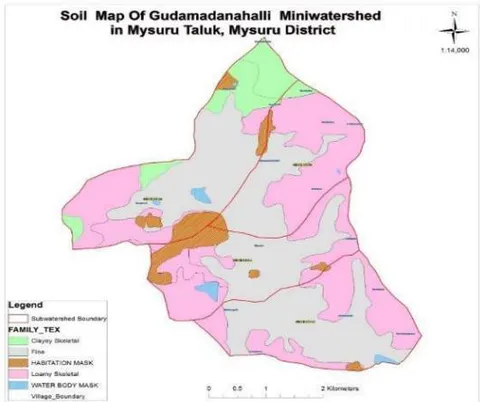
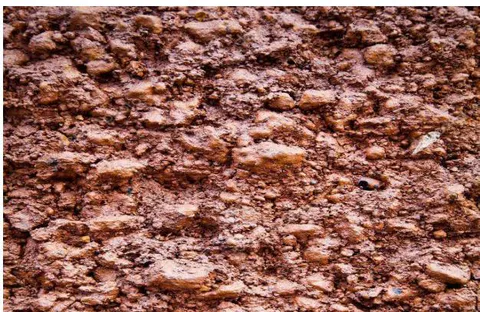
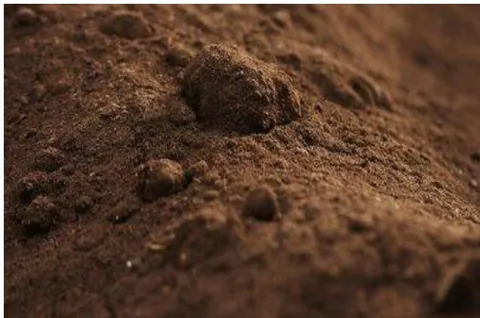
Soil map In Gudumadhanahalli, Mysuru taluk, soil consisting of different types based on soil profile available (Fig.8& 9) and considering one gram panchayats, the soil analysis made for the profile analysis. Soil maps (Fig.8) were originally produced by field surveys and Mapping using software techniques such as aerial photography and satellite-based. Image analysis and Global Positioning Systems (GPS), for ground truth verification and collection of soil samples for analysis of engineering parameters for the resources development Fig.9 and 10. Soil map is a map is a geographical representation showing diversity of soil types and soil properties like soil textures, soil pH in the area of interest. Varied soils have different reflectance, resulting in a distinct colour. These colours are examined and compared to existing charts. The loamy skeletal soil found near the riverbanks dominates the majority of the study region. Soil ranking is linked to infiltration capability, which is determined by soil thickness and grain size (permeability). Fine-grained soils have lower permeability than coarse-grained soils. Meanwhile, clay is categorised as poor because to its poor drainage, sluggish permeability, severe erodibility, and low hydraulic conductivity. The geological research of the area has been divided into five groups, each with its own geographic extent, as shown in Table 4.
| Sl. No | Type of soil | Area (m2) |
| 1 | Clayey skeletal | 2644.11 |
| 2 | Loamy skeletal | 14587.94 |
| 3 | Habitation mask | 1968.00 |
| 4 | Water body mask | 280.00 |
| 5 | Fine soil | 15421.00 |
5.4 Geomorphology
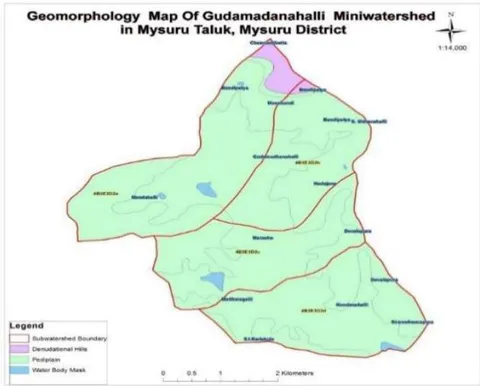
The geomorphology of a region was determined by the structural development of the geological formation. It reflects varied landforms and structural characteristics. The map is generated using a visual interpretation of Landsat TM and IRS LISS - III data on a 14000 scale, as well as the research area's geo-hydrology characteristics. Various geomorphological units have been delineated using photo geology features such as tone, texture, form, size, and association. Denudation hills, pediplains, and water body masks are the geomorphologic features. The figure depicts a geomorphology map.
- A pediplain is a large and generally flat rock surface created by the connecting of many pediments, and is considered the final step of landform evolution caused by erosion processes. The categories of the geomorphological study of the area are depicted in the Table 6.
Denudation hill:-Covers an area of about . A group of massive hills with resistant rock bodies, with medium to high relief. These are characterised by high topography and high surface runoff zones where the rate of infiltration is low or negligible with poor groundwater prospects.
| Sl. No | Description | Area ( ) |
| 1 | Denudational hills | 842.00 |
| 2 | Pediplain | 33779.00 |
| 3 | Water body | 280.00 |
A pediment, as the name indicates, is a feature that frequently occurs at the base of a mountain. Pediments resemble gently undulating plains with a gentle slope. The pediment is a low-sloped terrestrial erosional foot slope surface that lacks significant relief in all directions. Any lineaments or cracks may allow for some movement of groundwater potential. The pediments form because of weathering in dry and semi-arid environments, representing the last stage of cyclic erosion. A pediment is developed because of a combination of activities such as stream erosion, weathering, sheet wash, and lateral planting. When sediment accumulates across a vast area as a consequence of a continuous process of pedimentation, this is referred to as a Pediplain. Pediplain is seen on large portion of basin with an aerial extent of . Most of the study area is constituted by pediplain and groundwater potential is very good to moderate in this region. Water mask:-Surface water bodies like river, ponds, etc., can act as recharge zones, enhancing the groundwater potential in the neighbourhood.
5.5 LU/LC map
Land Use and Land Cover (LULC) data files describe plant, water, natural surface, and cultural elements on land surfaces. Remote sensing (LISS IV) gives good information on the geographical distribution of plant types and land use data (Fig.12), which is important in the development of groundwater resources. It regulates numerous hydrogeological processes in the water cycle, including infiltration, evapotranspiration, and surface runoff. Surface cover roughens the surface, reducing discharge and increasing infiltration. The volume, timing, and recharging of the groundwater system are also affected by LULC. Croplands and forests, both in terms of land use, are ideal locations for groundwater investigation. Infiltration will be greater and discharge will be less in forest regions. Meanwhile, in urban areas or built-up terrain, the rate of infiltration is low due to reduced recharging of the groundwater regime caused by aquifer inhibition. A revised categorization of the study area reveals that agricultural land accounts for the majority of land use, occupying an area of 3134 m2. (Table.7).
| SL.No | Type of Land | Area in |
| 1 | Agriculture Land | 31364 |
| 2 | Built up land | 2025 |
| 3 | Forest | 872 |
| 4 | Waste lands | 360 |
| Water bodies | Water bodies | 280 |
{"image_source":{"path":"images/249f2fe6f392b95f39b417fbe00fd7d197f90a1ee9a56ac10ed14f953fd26692.jpg"},"content":"","chart_caption":[{"type":"text","content":"Fig. 12: LULC map of Gudumadanahalli"}],"chart_footnote":[]}
5.6 Slope map
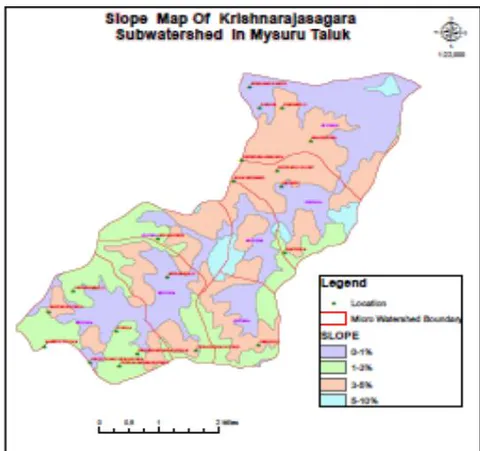
Slope is the elevation variation of a surface and the primary determinant of superficial water flow since it influences the gravity impact on water movement. To create the slope map, first extract the elevation contours at 20 m intervals from the topographic sheet (Fig.13). Table 8 shows how the research region was developed using contours generated from SOI Topographical data.
| Sl. No | Slope Gradient | Slope Category | Area (m2) |
| 1 | 35 – 50 | Steep | 583.90 |
| 2 | 10 – 15 | Strong | 310.26 |
| 3 | 5 – 10 | Moderate | 541.63 |
| 4 | 3 – 5 | Gentle | 1805.00 |
| 5 | 1 – 3 | Very gentle | 20542.09 |
| 6 | 0 – 1 | Nearly level | 11117.00 |
5.7 Drainage map
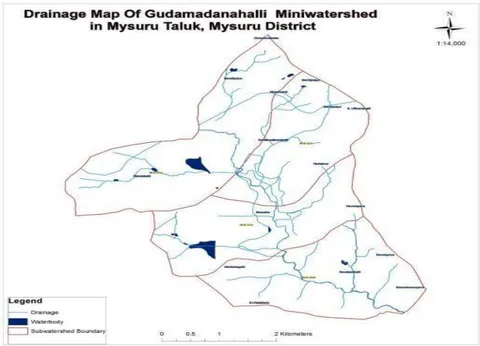
The drainage map depicts the geographical region where precipitation drains off into creeks, streams, rivers, lakes, and reservoirs. It is a terrain feature that may be recognised on a map by drawing a line along the greatest height between two points. Larger drainage basins flow into smaller drainage basins, which are commonly referred to as watersheds. The stream order was determined using the Strahler technique Fig 14 tables no.9 and 10.
| Sl. No | Zones | Km/ K |
| 1 | Sub-watershed 1 | 1 -1.5 |
| 2 | Sub-watershed 2 | 2.5 – 6 |
| 3 | Sub-watershed 3 | 1.8 – 2.2 |
| 4 | Sub-watershed 4 | 2.2 – 2.9 |
| Sl. No | Km/ K | Drainage density category |
| 1 | 0 – 1.2 | Very low |
| 2 | 1.2 – 2.4 | Low |
| 3 | 2.4 – 3.6 | Moderate |
| 4 | 3.6 – 4.8 | High |
| 5 | 4.8 – 6 | Very high |
5.5 Groundwater prospect map
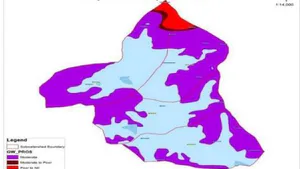
Groundwater potential zones were defined and categorised as moderate, moderate to poor, poor to nil, and very good to good in Fig.13: Groundwater potential map of GudumadanahalliFig.13 by integrating all maps (soil, geomorphology, lithology, LULC, slope, drainage, and lineament). The 14184 m2 research area was identified as order potential zone in a few spots with slopes ranging from 1-3 percent to 3-5 percent and 5-10 percent. The 15421-m2 research area was assessed as an excellent good prospective zone with a slope of 0-1 percent. Table 8 displays the many probable zone ranges discovered (Fig.15)
| Sl. No | Particulars | Area in |
| 1 | Sub-watershed 1 | 11063.51 |
| 2 | Sub-watershed 2 | 7139.38 |
| 3 | Sub-watershed 3 | 7889.04 |
| 4 | Sub-watershed 4 | 8809.40 |
| 5 | Total Area | 34901.34 |
| Sl. No | Potential zone | Area ( ) | % Area |
| 1 | Moderate | 14184.02 | 40.64 |
| 2 | Moderate to Poor | 838.72 | 2.40 |
| 3 | Poor to Nil | 302.27 | 0.87 |
| 4 | Very good to Good | 15421.00 | 44.18 |
| 5 | Water Body mask | 280.00 | 0.80 |
| Parameter | Classes | Groundwater prospect | Weight | Rank |
| Geomorphology | Pediplain | Very good | 5 | |
| Water body | Good | 30 | 4 | |
| Denudational hills | Moderate | 3 | ||
| Slope classes | Nearly level (0 -1) | Very good | 5 | |
| Very gentle (1 -3) | Good | 4 | ||
| Gentle (3 -5) | Moderate | 20 | 3 | |
| Moderate (5 -10) | Poor | 2 | ||
| Strong (10 -15) | Very poor | 1 | ||
| Steep (35 - 40) | Very poor | 1 | ||
| Drainage density (Km/ K m^2) | 0 - 1.2 | Very poor | 1 | |
| 1.2 - 2.4 | Poor | 2 | ||
| 2.4 - 3.6 | Moderate | 15 | 3 | |
| 3.6 - 4.8 | Good | 4 | ||
| 4.8 - 6 | Very good | 5 | ||
| Land use/ Land cover | Agricultural land | Very good | 5 | |
| Water bodies | Good | 4 | ||
| Forest | Moderate | 15 | 3 | |
| Built-up area | Poor | 2 | ||
| Waste land | Very poor | 1 | ||
| Migmatites and Granodiorite | Very good | 5 | ||
| Geology | - Tonalitic gneiss | 5 | ||
| Chamundi | Poor | 1 | ||
| Granite |
{"image_source":{"path":"images/4f87d342efe2e86332de16751ee6a081fb9a485b0d89f8dfa5ba8a8ba00b0563.jpg"},"content":"","chart_caption":[{"type":"text","content":"Figure 15: Prospect Map of Gudumadanahalli mini watershed"}],"chart_footnote":[]}
VI. CONCLUSIONS
The following points might be stated as closing remarks based on the findings of the current study:
From remotely sensed data, thematic maps of the study area such as soil, geomorphology, lithology, lineaments, landforms, and slopes were created. The groundwater prospect map obtained comprises moderate and excellent to good potential zones comprising 14184.02 m2 and 15421 m2 respectively. The modest potential zone consists of an area with a slope of 1-3 percent. The background is made up of loamy-skeletal earth. The area with excellent to decent potential has a 0-1 percent potential, which is practically flat. The beautiful soil serves as the backdrop. Loamy-skeletal soil and fine soil have infiltration rates ranging from 1.2 mm/hr to 3.8 mm/hr. Surface runoff is slower in flat and gently slopped areas, giving rainfall more time to percolate. Check dams and vegetative checks can be built in regions with a slope of 3-5 percent to improve rainwater percolation and boost the region's groundwater recharge capacity.
Conflict of Interest
The authors declare no conflict of interest.
Ethical Approval
Not applicable
Data Availability
The datasets used in this study are openly available at [repository link] and the source code is available on GitHub at [GitHub link].
Funding
This work did not receive any external funding.
References
Cite this article
Related Research


Special Issue
Launch a focused special issue to highlight research, emerging trends, and expert insights in your academic field.
