


IntelliPaper
Abstract
In Japan, the commercialization of the autonomous ship is aiming at the full-scale commercial operation around 2030 with the cooperation of industry, academia and government. The autonomous navigation system that the ships will be equipped with is one of the main functions of the autonomous ship. Commercialized autonomous ships coming soon are scheduled to operate on domestic routes. In areas covered by the Collision avoidance Regulations (COLREGs), autonomous ships will basically navigate without human intervention, including in congested waters. The Japan Captains’ Association believes that ships equipped with such autonomous navigation systems must have the same safety level as conventional ships and comply with the COLREGs. In other words, the autonomous ship should not cause anxiety to encountering ships. Based on the above basic policy, the Japan Captains’ Association and ClassNK conducted a large-scale verification experiment aimed at formulating standards for classification companies to objectively evaluate the safety of autonomous navigation systems and developed evaluation area diagrams for certification. This paper introduces the evaluation area diagrams that objectively evaluates autonomous navigation systems to have the same or higher safety level as conventional ships and to objectively evaluate compliance with COLREGs. In the evaluation area diagram, “Safety area”, “Caution area”, and “Danger area” are calculated based on the relative distance and bearing (compass bearing) change rate etc, between the autonomous ship and the encountered ships. When a ship using an autonomous navigation system navigates in a way that avoids entering “Caution area” and “Danger area”, it can be said that the ship is reducing risk before there is a risk of collision.
ClassNK will use the evaluation area diagram introduced here to carry out certification work for the autonomous navigation system which will undergo demonstration experiments in 2025.
This paper also discusses how to objectively explain compliance with the COLREGs, which contains many ambiguous expressions.
Explore Digital Article Text
I. INTRODUCTION
In Japan, the autonomous ship (MASS) has been undergoing long-term demonstration experiments with the aim of implementing it in society. One of the main functions of MASS is the autonomous navigation system (ANS), an automatic collision avoidance system.
The Japanese government's Ministry of Land, Infrastructure, Transport and Tourism and ClassNK have stated that the basic approach to the inspection and certification of autonomous ships is that "ANS must ensure the same level of safety as conventional ships and comply with the Collision avoidance Regulations (COLREGs)". This basic concept is agreed upon by maritime stakeholders, including the Japan Captains' Association. In accordance with this basic concept, the Japan Captains' Association has proposed the following specific desirable requirements for ANS.
It is desirable for ANS to take advantage of its characteristic of being able to process a lot of information simultaneously without oversight and to perform risk reduction manoeuvres in advance. By performing risk reduction manoeuvres in advance, it is possible to ensure the same level of safety as conventional ships without violating COLREGs. In other words, it is important for ANS to perform risk reduction manoeuvres in advance so as not to cause anxiety to other ships. The reason for making this proposal is that, based on the current capabilities of ANS [1][2][3][4], although it has advantages over human navigation, such as fewer oversights, it is difficult to operate a ship in full compliance with COLREGs, which contains many ambiguous expressions.
Based on this idea, the authors have developed an automatic collision avoidance system and proposed an evaluation area diagram [5][6]. The paper aims to consider objective criteria for ClassNK to certify ANS in practice in 2025 and reports the results of new large-scale simulator experiments and a questionnaire survey carried out to improve the previously proposed evaluation area diagram.
II. TOWARDS THE CERTIFICATION OF COMPLIANCE WITH COLREGS
The Japan Captains' Association has held a study session on COLREGs with ClassNK for the purpose of certifying that ANS comply with COLREGs. In particular, detailed explanations were given on Section II, Article 17 (Action by stand-on vessel), and Part A, Article 2 (Ordinary practice of seaman) of COLREGs.
Figure 1 is an example of the rules regarding the behaviour of stand-on vessels that were explained to ClassNK at the study session. In addition to the rules for keeping the course and speed of stand-on vessels stipulated in Article 17(a)(i) of COLREGs, there are rules such as 17a(ii), 17b, Rule2a, Rule2b, etc. (within the square frame in Figure 1). However, there is no specific description of when and how to perform the best aid to avoid collision (the best cooperative action) in 17b. There is also no specific description of what should be done for "Ordinary practice of seamen". As such, COLREGs contains many ambiguous expressions, making it difficult for ANS development engineers who are not seafarers to understand.
Figure 2 shows the ship encounter situation (actual data from November 2024) based on AIS data in the sea area where domestic container ships that will undergo long-term demonstration experiments on a new MASS in 2025 will be sailing. There is a high possibility that ship A will be a stand-on vessel against ships B and C according to Article 17. Ships B and C may also be stand-on vessels against ships D and E. If ship A maintains its course and speed against ships B and C, while ships B and C also maintain their course and speed as stand-on vessels against ships D and E, and ship A approaches ships B and C quite closely and then performs a hard starboard turn as a best aid to avoid collision according to Article 17b, it may cause anxiety to other ships sailing nearby and create an extremely dangerous situation. MASS needs to avoid getting into such a situation as much as possible. The manoeuvring method of ship A recommended by Japan Captains' Association is to change course slightly in advance so as not to become a stand-on vessel against ships B and C, and at the same time consider passing ships D and E port-to-port.
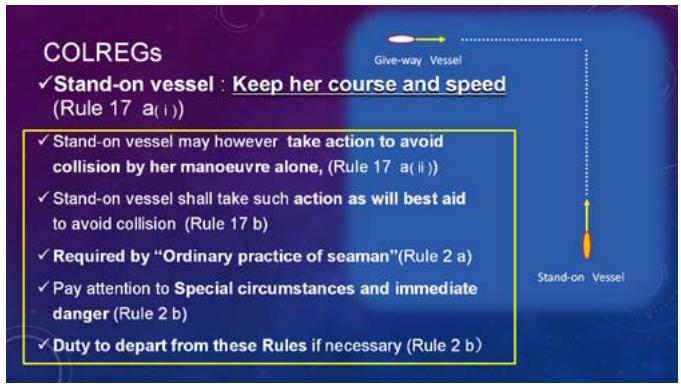
Figure 1: Rules Relating to Vessel That May Become Stand-On Vessel as Described in Colregs
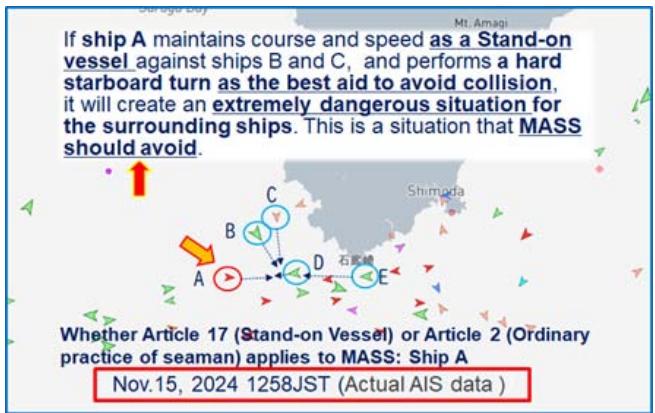
Figure 2: The Ship Encounter Situation based on AIS Data (Actual Data from November 2024)
This type of manoeuvring should be considered to be applicable to Article 2 (Ordinary practice of seamen) of COLREGs, not Article 17 (Stand-on vessel). In Japan Marine Accident Tribunal, "Ordinary practice of Seaman" is often applied as the cause of an accident.
As these examples show, Japan Captains' Association proposed that it is desirable for MASS to perform risk reduction manoeuvre in advance so as not to violate COLREGs and to not cause anxiety to other ships. And, also pointed out that, at the current level of technology, unless such an approach is adopted for the time being, it will be difficult to provide a rational explanation for not violating COLREGs.
Specific objective criteria are required to fairly evaluate the "risk reduction manoeuvre in advance" proposed by Japan Captains' Association. The evaluation area diagrams proposed previously [6] was formulated based on the results of experiments conducted quite some time ago. So large-scale verification experiment and a questionnaire survey were conducted by Japan Captains' Association and ClassNK in order to formulate new evaluation area diagrams that will serve as a more reliable objective criterion for the ANS certification.
III. LARGE-SCALE VERIFICATION EXPERIMENTS FOR FORMULATING THE EVALUATION AREA DIAGRAM
3.1 Overview of the Verification Experiments
In order to formulate new objective certification criteria, large-scale experiments were conducted using a ship manoeuvring simulator and evaluation area diagrams were formulated. The evaluation area diagrams follow the basic concept of the area diagrams proposed previously [6] and were conducted from 2022 to 2023 with the aim of improving reliability. They were conducted with the full cooperation of major Japanese shipping companies that own full mission ship-handling simulators, NYK Line, Mitsui O.S.K. Lines, and K Line. The relative distance between MASS and other ships that encounter it, and the bearing change rate (also some closest point of approach distances / CPA)
Table 1: The Definition of Evaluation Area
| Category | Definition |
| “Safety area” | Acceptable area |
| “Caution area” | The area where own ship commences to avoid or expect another ship to avoid |
| “Danger area” | Unacceptable area |
were used as indicators to formulate the evaluation area. The evaluation area was classified into "Safety area," "Caution area," and "Danger area" as defined in Table 1.
Even in situations where it is difficult to evaluate using only relative distance, by combining relative distance and the bearing change rate, it is possible to formulate an evaluation area diagram that is easy for seafarers to understand.
A total of 1,631 captains participated in the experiment, and verification experiments were conducted to develop evaluation area diagrams using 181 experimental cases. Experimental scenarios were prepared with multiple bearing change rates at any given relative distance, and captains/evaluators entered into the recorder the situation defined in Table 1 that corresponded to their situational awareness of being on board a target vessel that had encountered an autonomous vessel. Scenarios were prepared for the crossing case, with a bearing change rate of to at 1.5 miles. (The 1.5 miles point was chosen as the representative point for setting the bearing change rate.) In addition, scenarios were prepared for the same-way situation and overtaking and head-on situation, with the closest point of approach (CPA) distance was 0.1 miles to 0.85 miles. Captains/evaluators will board ships with LOA:147.9m to 400.0 m. The target autonomous ships are assumed to be autonomous ships that will undergo demonstration experiments in Japan in 2025 and with LOA: 81.5m to 107.4m in size. Additionally, to grasp the impact that differences in the size of MASS have on the area diagram, a ship (MASS) with LOA 333m was also added to the scenario.
Usually, when conducting such evaluation experiments, the scenario is set by setting only the closest point of approach (CPA) distance parametrically. However, this time, the evaluation area diagram is created by combining the relative distance and the bearing change rate, so the scenario setting work is somewhat complicated, but in the case of crossing situation, the scenario was set to change the bearing change rate parametrically at a relative distance of 1.5 miles.
One of the experimental scenarios is shown in Figure 3. This is the case where the bearing change rate is when the relative distance is 1.5 miles (A scenario in which a MASS passes the bow of a target ship on which captains/evaluators are aboard). Part of the experimental results for this case are shown in Figure 4. The horizontal axis represents the relative distance, and the vertical axis represents the recognition status of six evaluators. Almost all six evaluators changed from "Safety" to "Caution" at a relative distance of about 1.8 to 2 miles. The relative distance at which the recognition changes from "Caution" to "Danger" varies from almost 1 miles to 1.5 miles.
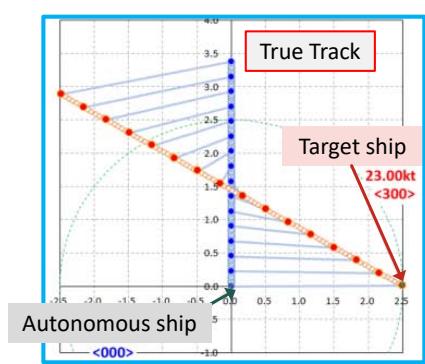
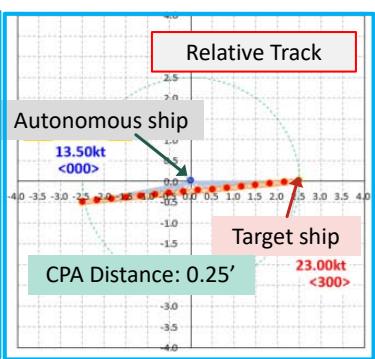
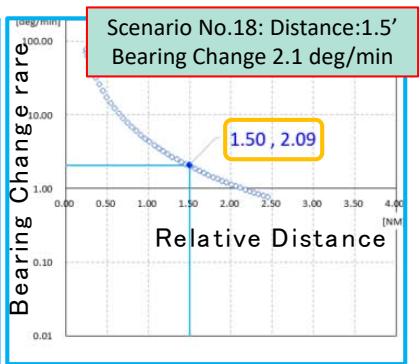
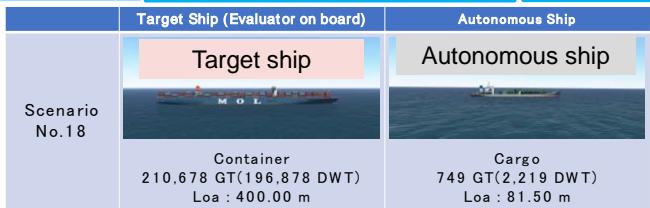
Figure 3: One of the Experimental Scenarios, the Case Where the Bearing Change Rate is When the Relative Distance is 1.5 Miles (A Scenario in Which a Mass Passes the Bow of a Target Ship on Which Captains/Evaluators are Aboard)
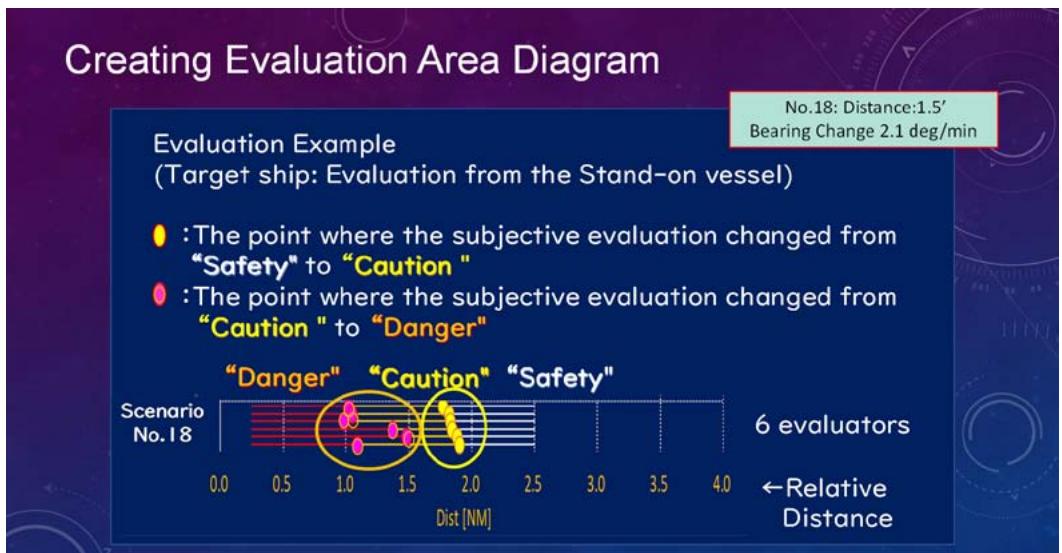
Figure 4: One of the Experimental Results, the Case Where the Bearing Change Rate is When the Relative Distance is 1.5 Miles (A Scenario in Which a Mass Passes the Bow of a Target Ship On Which Captains/Evaluators Are Aboard)
As shown in Figure 5, the experimental results were plotted by plotting the bearing change rate at which of the subjects changed their evaluation awareness from "safety" to "caution" or from "caution" to "danger" for every 0.1 mile of relative distance, and a regression equation was developed for the plot points. The vertical axis showing the bearing change rate is in logarithmic notation.
A representative point where of evaluators changed their awareness from "Caution" to "Danger"
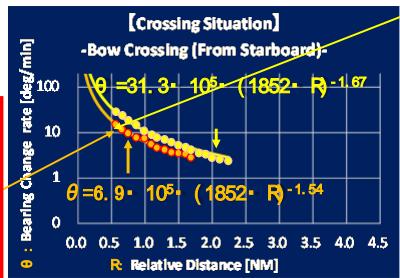
Figure 5: The Experimental Result (Crossing Situation/Bow Crossing from Starboard)
A representative point where of evaluators changed their awareness from "Safety" to "Caution"
The rising part of the Diagram (relative distance to enter the area) is the relative distance that of the evaluators considered "Caution" or "Danger".
Crossing and overtaking are shown by relative distance and bearing change rate, while head-on situation is shown by relative distance and closest point of approach (CPA) distance.
The evaluation formula showing the boundary of the area determined from the experimental results is shown in Figure 6 and Figure 7. The details of the regression formula are shown in Figure 8.
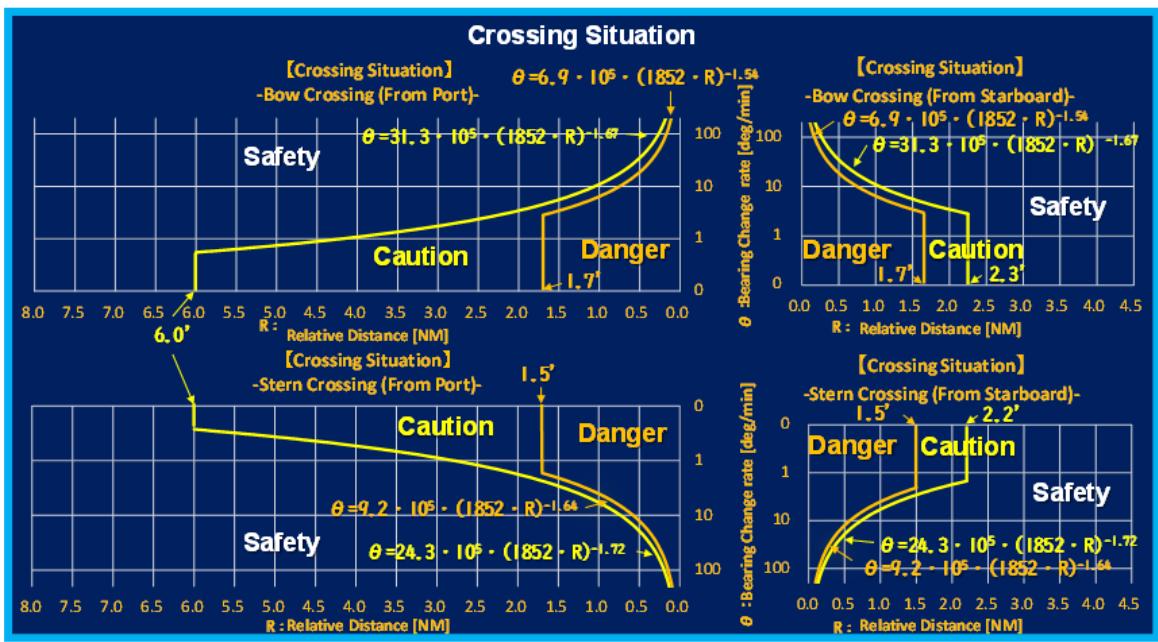
Figure 6: The Newly Created Evaluation Area Diagram (Crossing Situation)
Figure 6 shows the case of crossing, but for crossing from the port side, the starting point is 6 miles, which is the distance that avoids becoming a stand-on vessel as much as possible. These 6 miles is the result of a questionnaire survey conducted separately from the verification experiment. The questionnaire survey will be described in the next section.
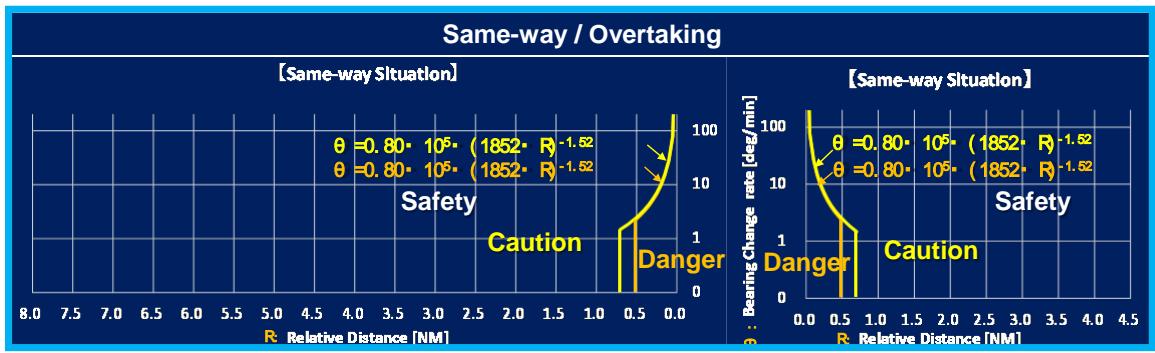
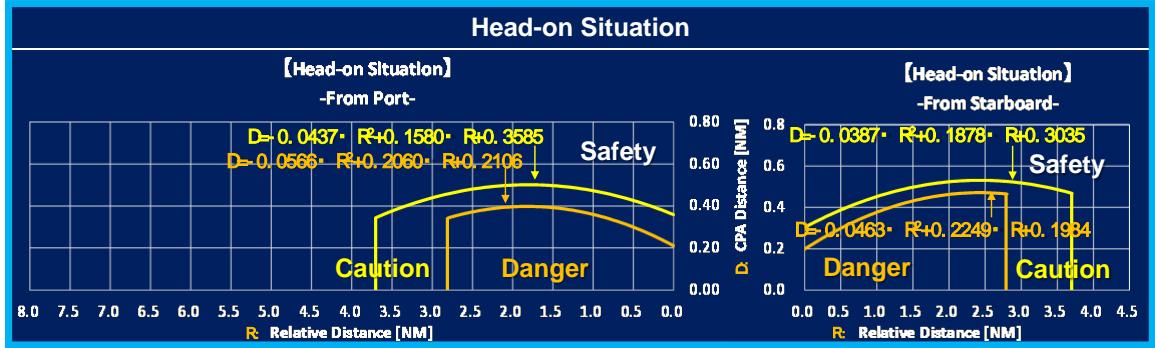
Figure 7: The Newly Created Evaluation Area Diagram (Same-Way, Overtaking, Head-On Situation)
Figure 8: The Details of the Regression Formula (Evaluation Boundary Formula)
| Encounter situation | Evaluation boundary formula | Evaluation | ||
| Crossing from Starboard | Bow Crossing | θ ≤ 6.90 × 10^5 × (1852 × R)^{1.54} | R < 1.7 [NM] | Danger |
| θ ≤ 31.30 × 10^5 × (1852 × R)^{-1.67} | R < 2.3 [NM] | Caution | ||
| Range excluding danger area and caution area | Safety | |||
| Stern Crossing | θ ≤ 9.20 × 10^5 × (1852 × R)^{-1.64} | R < 1.5 [NM] | Danger | |
| θ ≤ 24.30 × 10^5 × (1852 × R)^{-1.72} | R < 2.2 [NM] | Caution | ||
| Range excluding caution area | Safety | |||
| Crossing from Port | Bow Crossing | θ ≤ 6.90 × 10^5 × (1852 × R)^{1.54} | R < 1.7 [NM] | Danger |
| θ ≤ 31.30 × 10^5 × (1852 × R)^{-1.67} | R < 6.0 [NM] | Caution | ||
| Range excluding danger area and caution area | Safety | |||
| Stern Crossing | θ ≤ 9.20 × 10^5 × (1852 × R)^{-1.64} | R < 1.5 [NM] | Danger | |
| θ ≤ 24.30 × 10^5 × (1852 × R)^{-1.72} | R ≤ 6.0 [NM] | Caution | ||
| Range excluding caution area | Safety | |||
| Same-way | From Starboard / Port | θ ≤ 0.8 × 10^5 × (1852 × R)^{-1.52} | R < 0.5 [NM] | Danger |
| θ ≤ 0.8 × 10^5 × (1852 × R)^{-1.52} | R < 0.7 [NM] | Caution | ||
| Range excluding caution area | Safety | |||
| Head-on | From Starboard | D ≤ -0.0463 × R^{2}+ 0.2249 × R+ 0.1984 | R < 2.8 [NM] | Danger |
| D ≤ -0.0387 × R^{2}+ 0.1878 × R+ 0.3035 | R < 3.7 [NM] | Caution | ||
| Range excluding danger area and caution area | Safety | |||
| From Port | D ≤ -0.0566 × R^{2}+ 0.2060 × R+ 0.2106 | R < 2.8 [NM] | Danger | |
| D ≤ -0.0437 × R^{2}+ 0.1580 × R+ 0.3585 | R < 3.7 [NM] | Caution | ||
| Range excluding caution area | Safety | |||
| θ: Rate of change in bearing [deg./min] D: CPA Distance [NM: Nautical Mile] R: Relative distance [NM: Nautical Mile] | ||||
| Danger : Unacceptable area | ||||
| Caution : The area where own ship commence to avoid or expect another ship to avoid | ||||
| Safety : Acceptable area | ||||
3.2 Example of Evaluation using Evaluation Area Diagram
Figure 9 shows the situation as seen from the autonomous ship (the give-way vessel) and the target ship (the stand-on vessel) in a typical crossing situation, reproduced by a simulator.
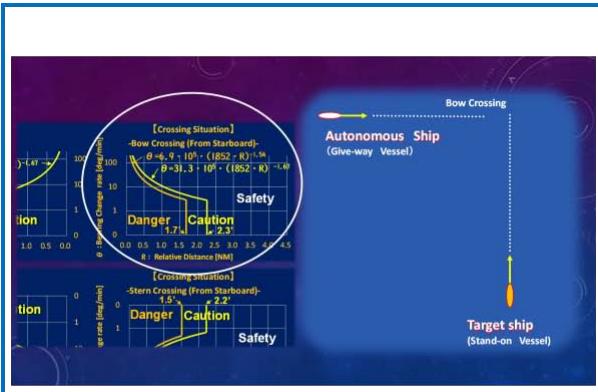
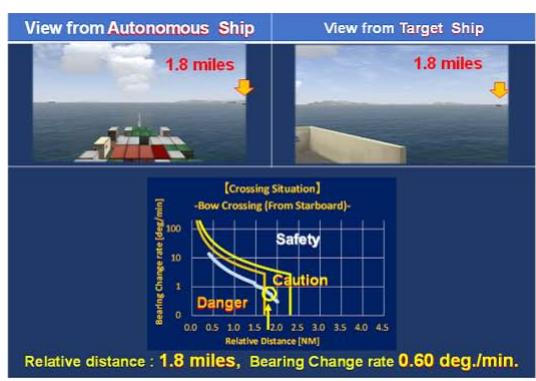
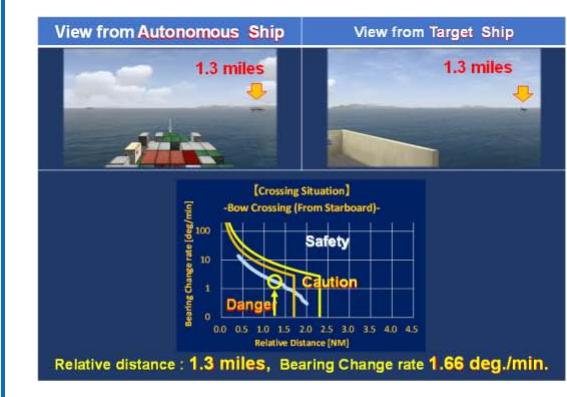
Figure 9: Example of Evaluation using Evaluation Area Diagram
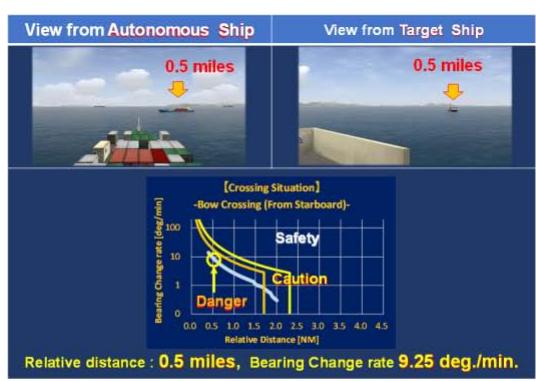
At a relative distance of 1.8 miles, the bearing change rate is 0.60 deg/min, plotted in the "Caution area." (In the figure, top right). At a relative distance of 1.3 miles, the bearing change rate is 1.66 deg/min, entering the "Danger area." (In the figure, bottom left). At a relative distance of 0.5 miles, the autonomous ship is about to pass by its bow, with the bearing change rate of 9.25 deg/min (In the figure, bottom right). A collision is avoided, but the autonomous give-way vessel is still showing its starboard side.
In this situation, the target ship passed the bow of the autonomous ship at a distance of 0.4 miles, but in the newly formulated evaluation area diagram, of the captains evaluated this situation as unacceptable. The certification standard for autonomous ships requires that the autonomous ship takes avoidance action with sufficient bearing change rate (more than 10 deg/min) and with ample time (more than 2.3 miles away).
IV. QUESTIONNAIRE SURVEY
It is desirable for an autonomous ship to avoid situations where it is necessary to perform the "best aid to avoid collision" of COLREGs Article 17 shown in Figure 1 and Figure 2. As already mentioned, given the current level of ANS technology, acting to avoid becoming a stand-on vessel as much as possible will not violate COLREGs and will not cause anxiety to other ships that encounter it. In order to encourage such proactive risk reduction manoeuvres, a questionnaire survey was conducted to understand the distance at which the "Caution area" should be raised for crossing from the port, as shown in Figure 6.
The questionnaire survey asked, "in a situation where there is a possibility that a MASS encountered in a crossing may become a stand-on vessel, up to what distance would be acceptable for that MASS to perform risk reduction manoeuvre?". In other words, from what distance would a stand-on vessel need to keep its course and speed.
The questionnaire was conducted with the cooperation of shipping companies and ship management companies, and responses were received from 523 captains from 12 countries. The nationalities of the captains who responded are shown in Figure 10.
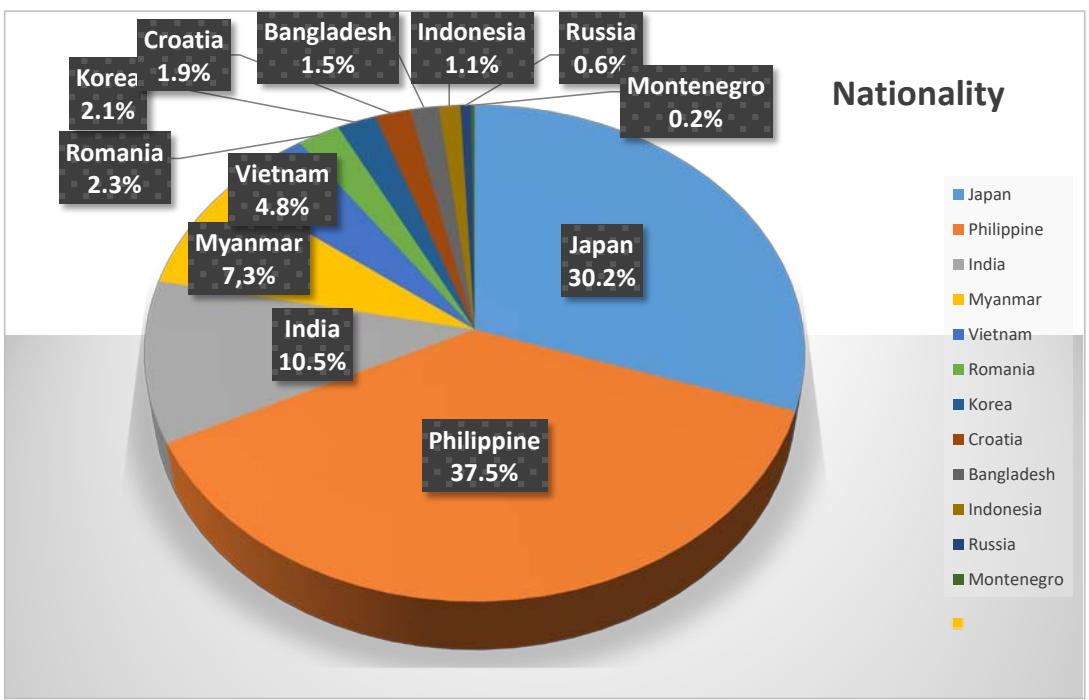
Figure 10: The Nationalities of the Captains Who Responded to the Questionnaire Survey
The questionnaire asked questions based on the LOA of their own ship (the ship the survey respondents assumed to be aboard) being between 100m and 360m, and the LOA of the other ship they may encounter (MASS that may become a stand-on vessel) being 100m. Figure 11 shows the results when the LOA of the own ship is 100m and the LOA of the other ship (MASS) is 100m. The left side of the figure shows examples of responses by distance, with the first one being a Japanese response, the second being a non-Japanese response, and the third being all responses. The right side shows the cumulative totals from the closest distance. The distance at which the cumulative total reached was 6 miles. The cumulative total distance at which the cumulative total reached varied slightly depending on the size of the ship, but 6 miles was used as the average.
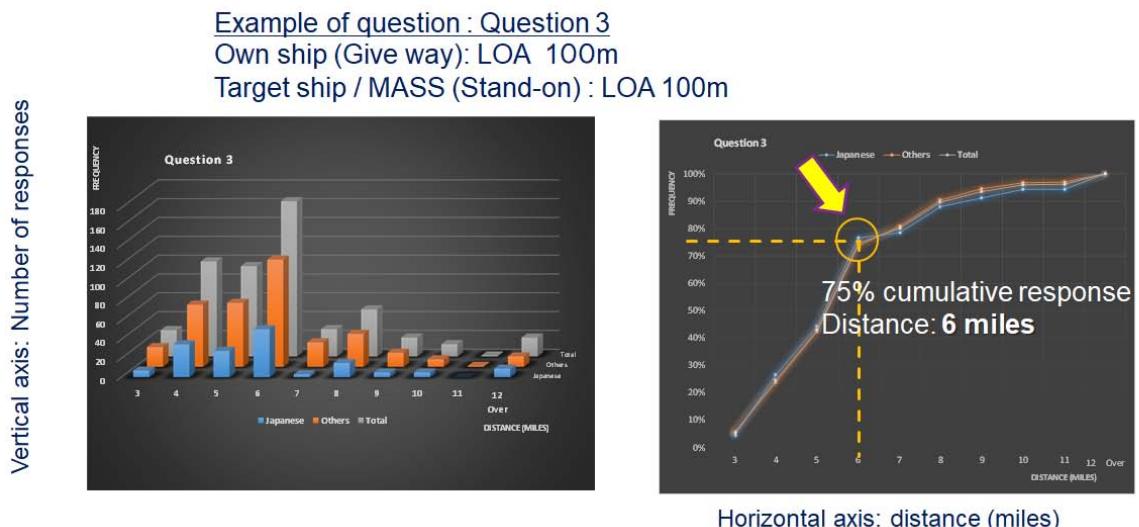
Figure 11: Part of The Questionnaire Survey Results
V. EXAMPLE OF CERTIFICATION USING EVALUATION AREA DIAGRAM (SIMULATED CERTIFICATION)
Verification is carried out using a ship-handling simulator incorporating the ANS to be certified. The scenario in Figure 12 is a scenario simulated for demonstration purposes.[7]
The target MASS is a PCC (LOA: 200m). The MASS is surrounded by crossing ships from starboard , a ship sailing in the opposite direction (Head-on) from port head , a ship sailing slightly faster than the MASS at 300m starboard side , and ships crossing from port , making it a difficult scenario to manoeuvre.
The results of automatic manoeuvring of the PCC incorporating the simulated verification ANS are shown in the top row of Figure 13. The results are shown as ships tracks and a time series of speed and steering conditions. First, the ship slowed down because there was a same-way ship 5 300m to starboard that was slightly faster than MASS. After that, the ship changed course to starboard, avoided the same-way ship on the starboard side, resumed speed, and headed north on the original course.
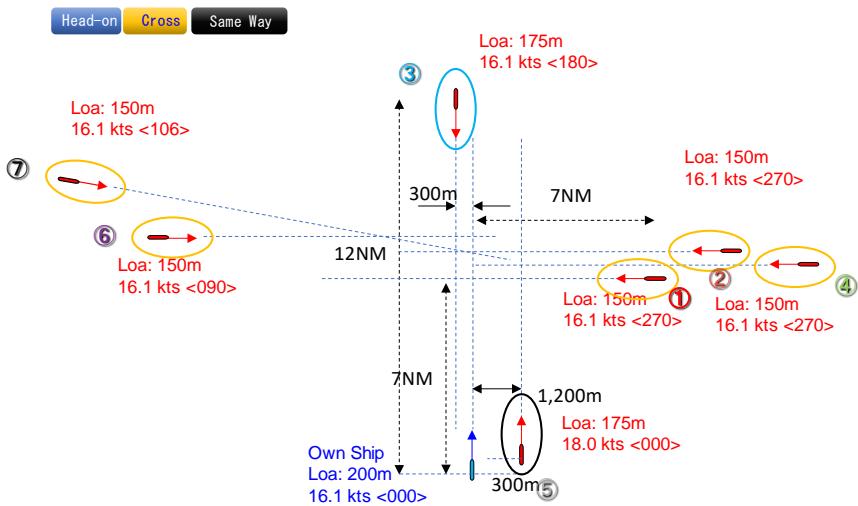
Figure 12: Scenario for Demonstration
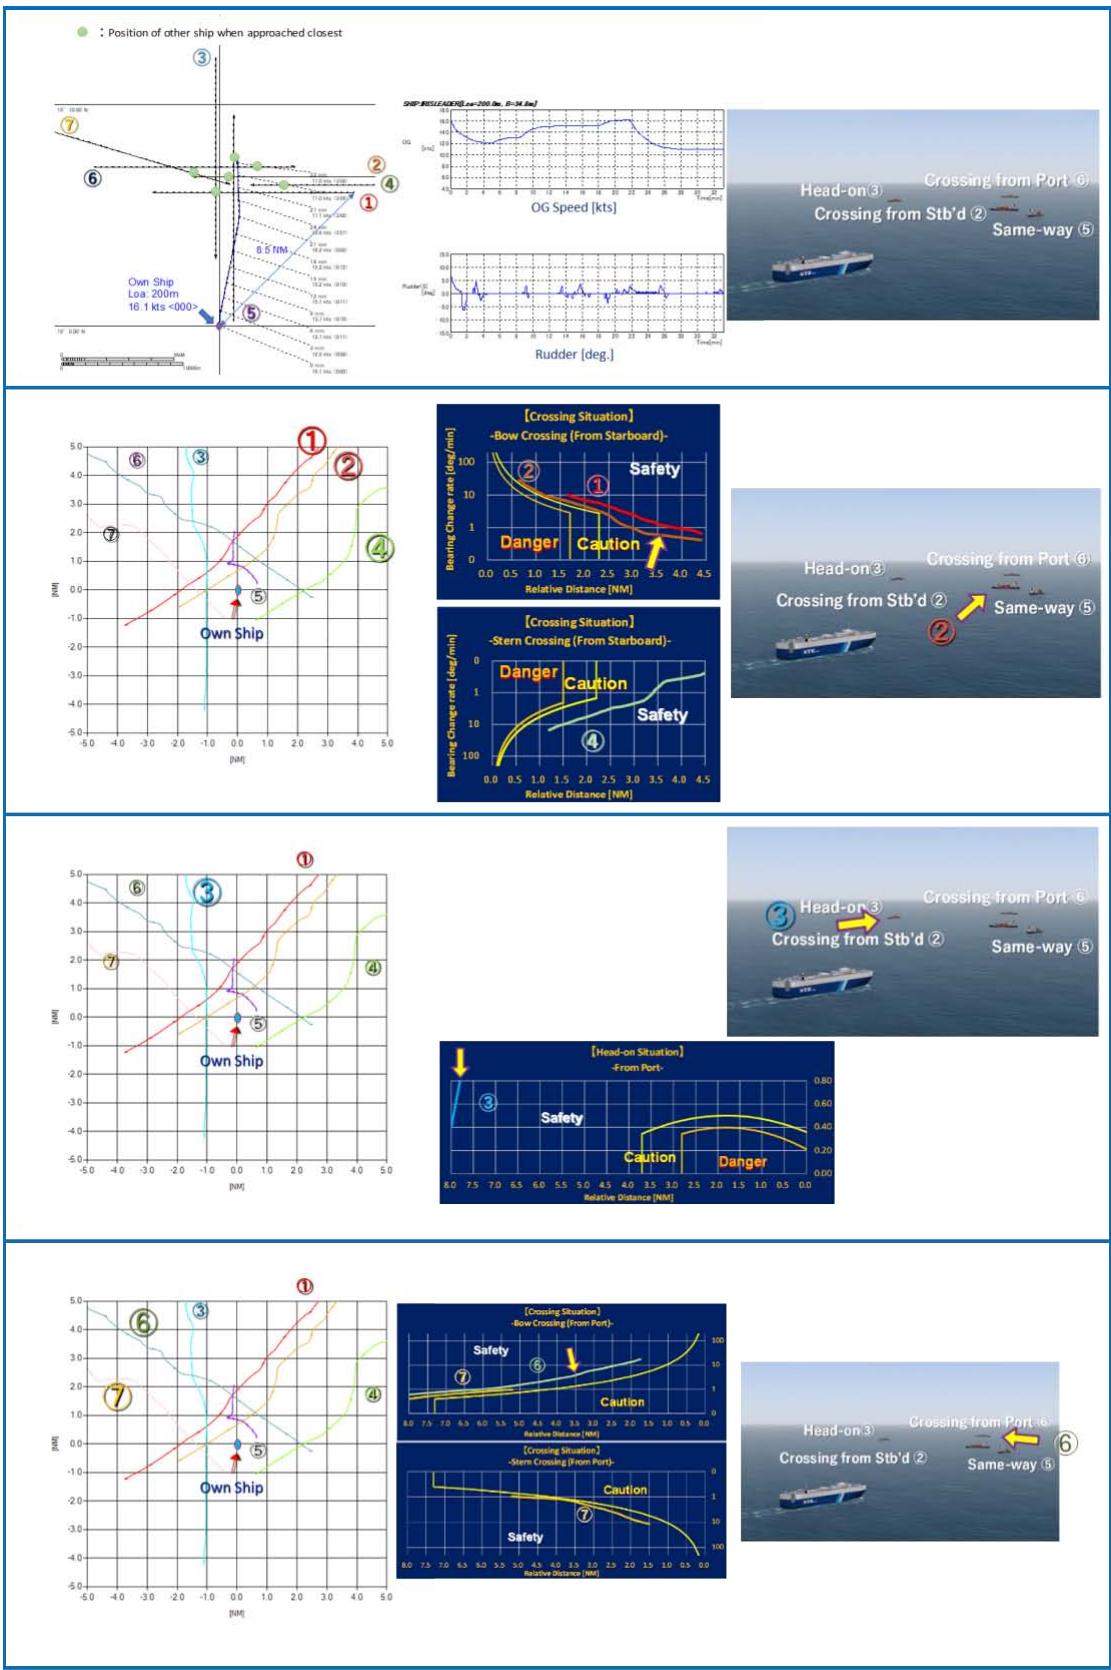
Figure 13: Example of Certification using Evaluation Area Diagram (Simulated Certification)
The relative tracks and evaluation area diagram of the ANS manoeuvring results are shown in the second and subsequent rows of Figure 13. As shown in the evaluation area diagram, there was a sufficient bearing change rate for crossing ship 2 approaching from starboard, and it was passed within the "Safety area".
In order to avoid the same-way ship coming from port head, the course was changed to the starboard, therefore head-on ship 3 was passed within a sufficient “Safety area”. Crossing ships 6 and 7 from port were also passed within “Safety area”, and MASS passed these ships without becoming a stand-on vessel.
During this simulated certification, no navigation through caution or danger zones area was observed, and the ship's tracks and manoeuvring methods were also deemed appropriate, so it has been determined that there are no problems with certification.
In addition, the ClassNK guidelines state that if a ship ends up entering an "Caution area" or "Danger area" the duration of the intrusion will be taken into consideration, and an evaluation will be made by "experts" such as the captain, with a final decision on whether or not to grant certification.
SUMMARY
The Summary of this Paper is as Follows:
- Through large-scale verification experiments and questionnaire survey, a practical "Evaluation area diagram" for evaluating ANS was successfully introduced.
- The newly developed "Evaluation area diagram" is based on the idea that it is desirable for ANS to take advantage of its characteristic of being able to process a lot of information simultaneously without overseeing anything and to perform risk reduction manoeuvres in advance.
- If it is possible to navigate in the "Safety area" using this "Evaluation diagram", it can be explained that COLREG is complied with.
- Although it is judged that this evaluation method has reached a practical level, future issues are noted below.
It has been confirmed that if the hull size of a ship navigating with ANS increases, the "Evaluation area diagram" will expand. A sufficient number of data has not necessarily been obtained regarding the spread of the "Evaluation area diagram" due to the size of the autonomous ship. This is an issue for the future. (Some experimental results suggest that when MASS's LOA is increased to 300m, evaluation area increases by to ).
- Currently, when actually carrying out certification, if an autonomous ship enters a "Caution area" or "Danger area" it is necessary for experienced captains to judge the situation.
- ClassNK states in its guidelines "Guidelines for Automated/Autonomous Operation on ships (Ver2.0)[8]" that the evaluation area diagram introduced here will be used.
Conflict of Interest
The authors declare no conflict of interest.
Ethical Approval
Not applicable
Data Availability
The datasets used in this study are openly available at [repository link] and the source code is available on GitHub at [GitHub link].
Funding
This work did not receive any external funding.
Cite this article
Related Research


Special Issue
Launch a focused special issue to highlight research, emerging trends, and expert insights in your academic field.
