Physico-Chemical, Rheological, Structural, Thermal, Mechanical and Barrier Properties of Hybrid Powder and Films from Cassava Starch Crosslinked with Xanthan Gum
Provide your details below to request scholarly review comments.
×
Verified Request System ®
Order Article Reprints
Please fill in the form below to order high-quality article reprints.
×
Scholarly Reprints Division ®
− Abstract
Starch and xanthan are viscosifying, film-forming polysaccharides obtained from renewable sources. The main objective of this work was to assess the effects of the cassava starch/deacetylated xanthan proportion and reaction time in the crosslinking performed with sodium trimetaphosphate on the Physico-chemical, rheological, structural, thermal, mechanical and barrier properties of resulting hybrid polymeric powder and films. Xanthan deacetylation, performed to improve crosslinking, increased xanthan viscosity and pseudoplasticity. For further crosslinking, the crosslinking agent (SMTP) and the alkalizing agent sodium sulfate (SS) concentration was set at 5% and 3% respectively relative to the total polymeric mass (5%m/v); and according to the Central Composite Rotatable Design (DCCR 22) the starch/deacetylated xanthan proportion and reaction time was varied, totalizing 11 treatments with 3 repetitions at the central point. Physical and chemical features of the crosslinked polymers were checked, as well as films based on the crosslinked hybrid polymers were prepared and tested. Treatments that showed best results were T1 (s/x: 4.5/0.5; 52 min.) and T4 (s/x: 3.5/1.5; 127 min). These resulted in low solubility, thickness and permeability to water vapor, with high tensile strength.
− Explore Digital Article Text
# I. INTRODUCTION
Starch and xanthan are polysaccharides obtained from renewable sources, having a number of applications in food products as thickening agents and for coatings, films, microspheres, nanoparticles and matrices (Jain et al., 2008; Nsengiyumva & Alexandridis, 2022; Teng et al., 2025). Starch is one of the most abundant natural materials and has already countless industrial applications (Lecorre et al., 2012). In spite of the benefits of starch, as relates to biodegradability, biocompatibility, non-toxicity and excellent cost-benefit ratio (Li et al., 2012), it does not meet totally the properties required by food coatings and protecting films, with highlights for mechanical performance and poor water barrier of the formed films. In order to improve or adapt these properties, starch can be submitted to physical and chemical modification processes (Sandhu et al., 2008; Zavareze et al., 2012; Wang & Copeland, 2015; Villela et al., 2024).
Modified starch has been employed in the development of biodegradable films and coatings for food packaging because they are endowed with improved physical, chemical, morphological and mechanical properties as compared with those of native starch films (Zavareze et al., 2012; Fonseca et al., 2015). A recent study showed that cross-linked cassava starch films had better easiness of handling, continuity, and brightness than the control film. Generally, cross-linking reduced the water solubility and tensile strength and increased thickness, elongation and the films' yellowish color and opacity (Karow et al., 2025).
Starch/hydrocolloids associations have also been studied aiming at new formulations for the improvement of film features (Matta et al., 2011). Hydrocolloids can intervene in the gelatinization and retrogradation of starches (Pongsawatmanit & Srijunjthongsiri, 2008; Weber et al., 2009), these properties being able to affect film features. Among the explanations for such are the association of same with swollen starch or with amylose chains lixiviated in the paste and competition for water with starch. Such associations are highly dependent on the hydrocolloid structure (Chaisawang, 2006).
Researches involving xanthan as polymeric matrix for preparing films and coatings are still limited. However, its use in association with starch or other hydrocolloids is better known (Shalviri et al., 2010). Xanthan is a polysaccharide produced by bacteria species of the Xanthomonas genus, normally Xanthomonas campestris pv campestris. It is soluble in cold or hot water, being stable as relates to temperature, pH and ionic strength variation. It has been used in foods as thickening agent and stabilizer (García-Ochoa et al., 2000) and as edible coating (Luvielmo & Scamparini, 2009; Medeiros et al., 2012) on minimally processed papaya (Cortez-Veja et al., 2013), apple (Freitas et al., 2013), peach (Pizato et al., 2013), strawberry (Borges et al., 2013) and pomegranate (El-Rhouttais et al., 2025); however, results depend on the specific fruit as well as on the additives. Chemical modifications have been applied to xanthan (Pinto et al., 2011; Erten et al., 2014; Klaic et al., 2016), chiefly deacetylation and crosslinking. Polymer crosslinking is a process occurring when linear or branched polymer chains are interconnected; it is known as crosslinking, that is, links among linear molecules leading to high molar mass tridimensional polymers (Bejenariu et al., 2009).
The objective of this work was to assess the crosslinking effects of native manioc starch/deacetylated xanthan with sodium trimetaphosphate and sodium phosphate mixture as a function of reaction time on the filmogenic and rheological properties.
# II. MATERIAL AND METHODS
# 2.1. Material
Native marketed manioc starch YOKI® was used, purchased at the local markets of the town of Pelotas-RS, and chemically modified by crosslinking at the Biopolymers Laboratory - CDTec/UFPeL. Commercial (Jungbonz Laver) xanthan was employed in the study; it was deacetylated at the Biopolymers Laboratory - CDTec/UFPeL. Sodium trimetaphosphate p.a. (Synth®), anhydrous sodium sulfate p.a. (Synth®), glycerol p.a. (Synth®), alcohol $96^{\circ}\mathrm{GL}$ and distilled water were employed for the chemical modification.
# 2.2. Chemical Modification
At first natural xanthan was deacetylated in an alkaline homogeneous medium, in accordance with Klaic et al (2016). Determination of the native manioc starch/deacetylated xanthan proportions and reaction time was obtained with the aid of Central Composite Rotatable Design. The proportions of native manioc starch/deacetylated xanthan $4.5 / 0.5$ ; $3.5 / 1.5$ ; $4.7 / 0.3$ ; $3.3 / 1.7$ ; $4.0 / 1.0 \mathrm{~m} / \mathrm{m}$ ; and the reaction times 37; 52; 90; 127 and 142 minutes were assessed through 11 treatments with three repetitions at the central point. Crosslinking of the native manioc starch/deacetylated xanthan mixtures was performed in accordance with Soares et al (2013), with modifications on the time of chemical reaction and reagents' concentration. The concentrations of the crosslinking agent sodium trimetaphosphate and the alkalinizing agent sodium sulfate, as well as the polymer mass, were determined in a previous study, in which the crosslinking of cassava starch was performed (Karow et al., 2025). In the present study, part of the initial concentration of cassava starch was replaced with deacetylated xanthan. All the proportions used totalized $5\%$ of polymer mass. The dispersion of the different mixtures was performed in distilled water at ambient temperature and the suspensions were placed in a water bath under agitation up to $65^{\circ}\mathrm{C}$ for $15\mathrm{min}$ . Then the $\mathsf{pH}$ was adjusted to 9.5 with a 0.5M NaOH solution and sodium trimetaphosphate (STMP) in the proportion of $5.0\%$ and sodium sulfate (SS) in the proportion of $3.0\%$ was added relative to the starch/xanthan (s/x) mass and transferred to another water bath at $45^{\circ}\mathrm{C}$ . Whenever needed, the $\mathsf{pH}$ was again adjusted to 9.5. This mixture was kept under magnetic agitation for 37; 52; 127; 142 minutes in accordance with DCCR $2^{2}$ . When the reaction time was completed, the $\mathsf{pH}$ was adjusted to 6.0 with the aid of a 2M HCl solution. The samples were washed with ethanol, filtered, oven-dried at $45^{\circ}\mathrm{C}$ and later on thoroughly milled.
Table 1: Central Composite Rotational Design (CCRD $2^{2}$ ) for crosslinking of the native manioc starch/deacetylated xanthan mixture
<table><tr><td rowspan="2">Treatment</td><td colspan="2">Codified Levels</td><td colspan="2">Actual Levels</td></tr><tr><td>Xa</td><td>Yb</td><td>Starch + Xanthan (%)</td><td>Reaction Time (min)</td></tr><tr><td>T1</td><td>-1</td><td>-1</td><td>4.5 + 0.5</td><td>52</td></tr><tr><td>T2</td><td>+1</td><td>-1</td><td>3.5 + 1.5</td><td>52</td></tr><tr><td>T3</td><td>-1</td><td>+1</td><td>4.5 + 0.5</td><td>127</td></tr><tr><td>T4</td><td>+1</td><td>+1</td><td>3.5 + 1.5</td><td>127</td></tr><tr><td>T5</td><td>-1.41</td><td>0</td><td>4.7 + 0.3</td><td>90</td></tr><tr><td>T6</td><td>+1.41</td><td>0</td><td>3.3 + 1.7</td><td>90</td></tr><tr><td>T7</td><td>0</td><td>-1.41</td><td>4.0 + 1.0</td><td>37</td></tr><tr><td>T8</td><td>0</td><td>+1.41</td><td>4.0 + 1.0</td><td>142</td></tr><tr><td>T9</td><td>0</td><td>0</td><td>4.0 + 1.0</td><td>90</td></tr><tr><td>T10</td><td>0</td><td>0</td><td>4.0 + 1.0</td><td>90</td></tr><tr><td>T11</td><td>0</td><td>0</td><td>4.0 + 1.0</td><td>90</td></tr></table>
Starch + xanthan (\%).
Reaction Time (min).
# 2.3. Determination of acetyl and pyruvate content of the natural and deacetylated xanthan
The acetyl content of natural and modified xanthan gums was performed with the aid of the hydroxamic acid colorimetric method as taught by McComb & McCready (1957) while the pyruvate contents were determined by the 2,4-dinitrophenylhydrazine colorimetric method, according to Sloneker & Orentas (1962). Acetyl and pyruvate contents were quantified with the aid of a standard curve at the concentration of $0 - 450~\mu \mathrm{g/mL}$ and $0 - 0.25\mathrm{mg/mL}$, respectively.
2.4. Characterization of native starch manioc, natural xanthan and native manioc starch/deacetylated xanthan crosslinked mixtures
# 2.4.1. Humidity
In accordance with the AOAC (2012) method. Results were expressed in percentage.
# 2.4.2. Scanning Electron Microscopy (SEM)
The morphology of native starch, of the natural and deacetylated xanthan gums and of the crosslinked mixtures of native manioc starch/deacetylated xanthan was observed with a digital scanning electron microscope (Leo® model 440). The previously $40^{\circ}\mathrm{C}$ oven-dried samples were manually dispersed on a carbon adhesive tape contained in an aluminum sample holder and recovered with gold, the cover thickness being $20\mathrm{nm}$. The beam current was $1\mathrm{pA}$ and the beam power, $10\mathrm{kV}$.
# 2.4.3. Infrared Spectroscopy - IV
Native manioc starch, natural xanthan, deacetylated xanthan and crosslinked native manioc starch/deacetylated xanthan mixtures infrared spectra were obtained by patching $2\mathrm{mg}$ of the samples, milled (100 mesh) and dried, in $200\mathrm{mg}$ of spectroscopic grade potassium bromide. Analyses were conducted in a (Model IR Prestige 21, Shimadzu®) spectrophotometer, in the wave number range from 4,000 to $400\mathrm{cm}^{-1}$ under transmittance mode, with 60 scannings and $4\mathrm{cm}^{-1}$ resolution.
# 2.4.4. Rheometric Analyses
Native manioc starch, natural xanthan, deacetylated xanthan and crosslinked native manioc starch/deacetylated xanthan mixtures were analyzed; as a control of the crosslinking process, the physical mixtures of native manioc starch/deacetylated xanthan with the higher and lower xanthan level were also analyzed. Rheometry was performed with a rheometer (Haake® Rheostress 600, model RS150) with a temperature controller (Peltier, ± 0.1 °C). The viscosity of the 3% aqueous solutions was determined by shear stress curves versus deformation rate at $25^{\circ}\mathrm{C}$, with the aid of cone and plate geometry ($\mathrm{C}35/10$ sensor; 0.052 mm gap) and shear rate 0.1-400 s $^{-1}$ for 400 s. The index of consistency K (Pa/s) and flow n (nondimensional) parameters of the Ostwald-de-Waele rheological model were obtained from the viscosity curves (mPas) versus deformation rate ($s^{-1}$) at $25^{\circ}\mathrm{C}$, of the 3% (m/v) aqueous solutions.
# 2.4.5. Thermal Properties - DSC
The thermal properties of the native manioc starch, natural and deacetylated xanthan and native manioc starch/deacetylated xanthan mixtures were assessed in a scanning differential calorimeter (ASTM, 2013). Approximately $5\mathrm{mg}$ of each sample were weighed in an aluminum capsule and closed hermetically. The samples' containing capsules were heated, together with an empty capsule as reference, under a nitrogen atmosphere to secure an inert atmosphere during the analyses, under a flow of $50~\mathrm{mL/min}$; the equipment was a DSC-60 Shimadzu, heating was performed between $25^{\circ}\mathrm{C}$ and $240^{\circ}\mathrm{C}$, under a heating rate of $10^{\circ}\mathrm{C/min}$ and cooling from $250^{\circ}\mathrm{C}$ to $100^{\circ}\mathrm{C}$ at a $10^{\circ}\mathrm{C/min}$ rate.
The samples start, peak and final melting temperatures were obtained, as well as the melting enthalpy. The temperature variation was calculated by subtracting the final and starting melting temperatures.
# 2.5. Preparation and characterization of films
# 2.5.1. Preparation of films
Based on the native manioc starch and the 11 native manioc starch/xanthan deacetylated mixtures (T1 to T11) obtained by the crosslinking process, as stated in experimental design CCRD $2^{\circ}$, 13 films were produced by the casting method, being named as FC (Control Film) and F1 to F11, respectively. The different filmogenic solutions were prepared by casting $3.0\mathrm{g}$ of the native manioc starch/deacetylated xanthan crosslinked mixture and $0.9\mathrm{g}$ glycerol in $100\mathrm{mL}$ water as solvent. This solution was kept for $30\mathrm{min}$ at $85^{\circ}\mathrm{C}$ under mechanical agitation and $20\mathrm{mL}$ aliquots were distributed in $9\mathrm{cm}$ diameter Teflon plates and dried in an oven at $56^{\circ}\mathrm{C}$ for $24\mathrm{h}$, being stored in a desiccator at $25^{\circ}\mathrm{C} \pm 3^{\circ}\mathrm{C}$ with relative humidity of $55\% \pm 3\%$ (in the presence of a magnesium nitrate saturated solution).
# 2.5.2. Macroscopic Assessment
Films were assessed macroscopically by the general aspect, followed by the parameters described by Gontard et al. (1992) to select the homogeneous films (absence of insoluble particles and bubbles, uniform color), continuous (without the presence of cracks or brittle zones) and that make handling possible (ease in withdrawing films from the support).
# 2.5.3. Scanning Electron Microscopy (SEM)
Films SEM was performed as described in 2.4.2 item, with a small fragment of each film, previously $40^{\circ}\mathrm{C}$ oven dried, being manually laid on the carbon adhesive tape.
# 2.5.4. Water Vapor Permeability (WVP)
Permeability was assessed in accordance with Gontard and collaborators (1992). The film was placed in a silica gel-containing cell $(\mathrm{RU} = 0\%, 0\mathrm{mmHg}$ vapor pressure), forming a membrane. The cell was then placed in a desiccator with distilled water $(\mathrm{RU} = 100\%; 32.23\mathrm{mmHg}$ vapor pressure) under a controlled temperature of $22^{\circ}\mathrm{C}$ . The cell was weighed in a semi-analytical scale on the sixth day. The permeability was calculated by means of equation 2:
$$
WVP = \frac {G \times V}{A \times t (p_1 - p_2)} \tag{2}
$$
Where: WVP = water vapor permeability (g.mm/m².day.mm.Hg); G = weight acquired by the cell during 24 hours (g); V = film average thickness (mm); A = film permeation surface (m²); t = time (days); p1-p2 = vapor pressure gradient between the film surfaces (32.23 mmHg).
# 2.5.5. Water solubility
The films were assessed as for their water solubility according to the methodology described by Zamudio-Flores and collaborators (2010) with modifications. Films' samples were cut into 2 cm squares and the initial dry matter percentage of each one was determined after drying in an oven at $105^{\circ}\mathrm{C}$ for $24\mathrm{h}$. After weighing, the samples were placed in an Erlenmeyer flask with $50~\mathrm{mL}$ of distilled water and agitated at $200~\mathrm{rpm}$ for $24\mathrm{h}$.
# 2.5.6. Thickness
Films' thickness was assessed in accordance with ASTM F2251-13 (2013) Method by the arithmetic average of ten random measurements on their surface, with the aid of a digital micrometer (Insize, model IP-54), and the results expressed in mm.
# 2.5.7. Mechanical properties
Tensile strength and films' elongation percentage were assessed in a texture analyzer (TA.TX Plus, Texture Analyzer) in accordance with the ASTM D 882-12 (ASTM, 2012) Method. Three samples of each treatment, with $80\mathrm{mm}$ length and $25\mathrm{mm}$ width were assessed, with initial claw separation of $40\mathrm{mm}$ and test velocity $0.8\mathrm{mm/s}$. Tensile strength was calculated by dividing the maximum strength at film failure by the cross-sectional area. Elongation was determined by dividing the final attained distance at film failure by the initial separation distance ($40\mathrm{mm}$), multiplied by 100 (Jangchud & Chinnan, 1999).
# 2.5.8. Opacity
Film opacity was assessed as the relationship between the opacity of the film superimposed on the black standard (Sblack) and white standard (Swhite) (Hunterlab, 1997).
# 2.6. Statistics
Results were submitted to variance analysis (ANOVA) and the comparison of averages by the Tukey test at $5\%$ significance with the aid of the Statistica 9.0 program. Central Composite Rotatable Design (DCCR$2^{2}$) was used and the generated response surfaces, the Statistica 8.0 program.
# III. RESULTS AND DISCUSSION
# 3.1. Chemical characterization of natural and deacetylated xanthan
Table 2 lists the figures obtained for the acetyl and pyruvate contents for natural xanthan and those from the xanthan chemical modification.
Table 2: Contents for natural xanthan and from xanthan chemical modification Sample Contents (%) Acetyl Pyruvate
<table><tr><td>Sample</td><td colspan="2">Contents (%)</td></tr><tr><td></td><td>Acetyl</td><td>Pyruvate</td></tr><tr><td>Natural xanthan</td><td>2.76a</td><td>4.00b</td></tr><tr><td>Deacetylated xanthan</td><td>0.71b</td><td>5.09a</td></tr></table>
Results represent the average of three determinations. Figures with different letters in the same column are significantly different by the Tukey test $(\mathrm{p} < 0.05)$. Standard curves: Acetyl: $y = 0.0003x + 0.0002$ $(R^2 = 0.999)$ / Pyruvate: $y = 6.703x + 0.0479$ $(R^2 = 0.957)$.
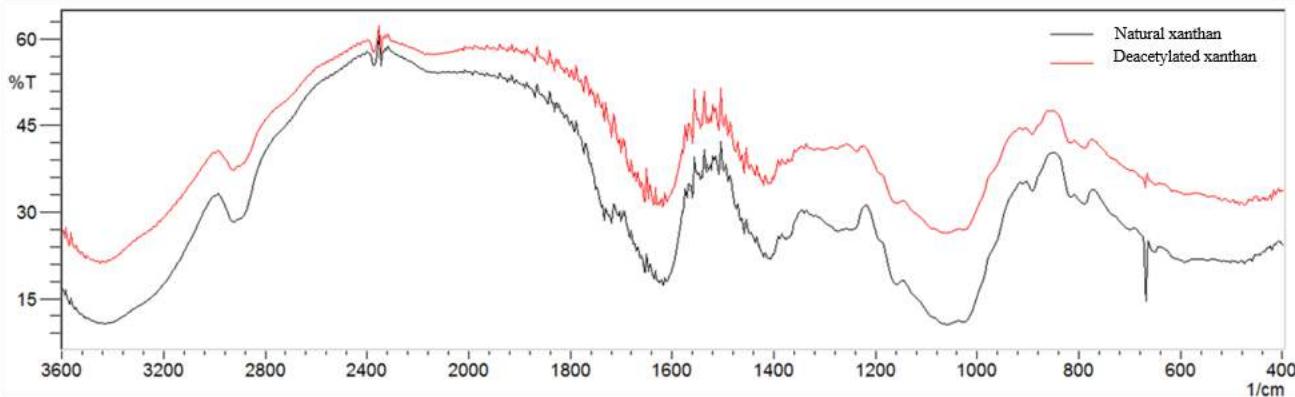
The deacetylation method was efficient for acetyl groups removal from natural xanthan, according to the chemical analysis of the acetyl content in Table 2. Infrared spectroscopy results confirm these data (Fig. 2) by the absence of the band at 1710 to $1730~\mathrm{cm}^{-1}$, related to $\mathrm{C=O}$ bond esters axial deformation. The literature reports acetyl values varying from 1.9 to $6.0\%$ for xanthan (García Ochoa et al., 2000).
According to Burdock (1997) the lower limit for pyruvate content in commercial xanthan is $1.5\%$ and Garcia-Ochoa and collaborators (2000) point to values from 1 to $5.7\%$, the findings of this study being in conformity. Smith and collaborators (1981) established that commercial xanthan gums exhibited variations in the degree of substitution of acetate and pyruvate groups and according to the researches, these variations can be observed between different batches of the same source.
# 3.3. SEM
Fig. 1 illustrates the morphology of the neat polysaccharides and of the crosslinked mixtures of native manioc starch/deacetylated xanthan.
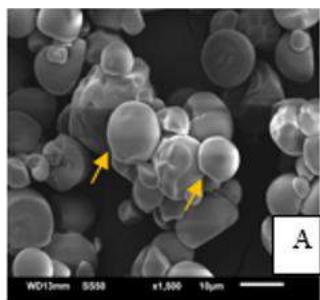
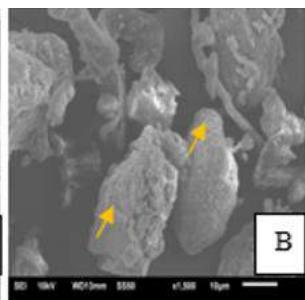
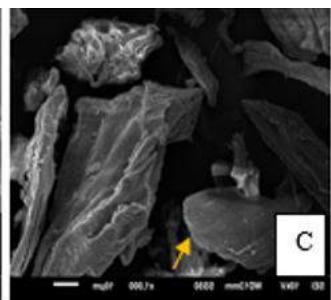
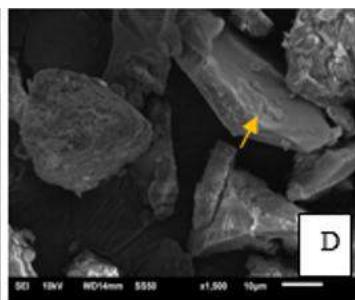
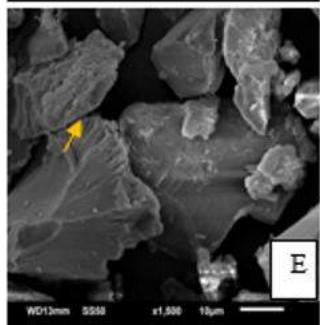
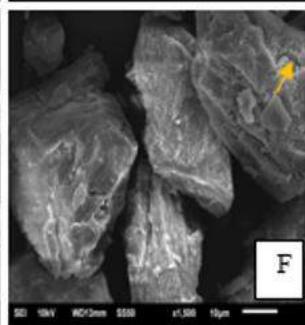
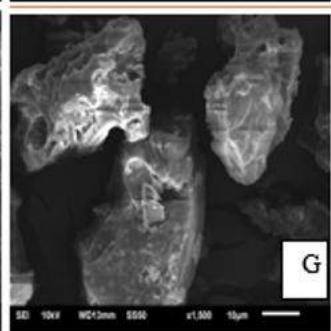
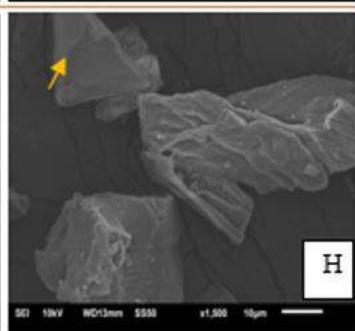
Fig. 1: Scanning Electron Micrography 1500x magnification, for neat polysaccharides and for crosslinked native manioc starch/deacetylated xanthan. (a) native manioc starch; (b) natural xanthan; (c) deacetylated xanthan; (d) T1 (starch 4.5/xanthan 0.5 to 52 min); (e) T3 (starch 4.5/xanthan 0.5 at 127 min); (f) T4 (starch 3.5/xanthan 1.5 at 127 min); (g) T6 (starch 3.3/xanthan 1.7 at 90 min); (h) T12 (starch 4.0/xanthan 1.0 at 90 min).
For native manioc starch (Fig. 1, a) in a characteristic way, granules of varied size could be seen, of predominantly oval shape. According to Rickard, Asaoka & Blashard (1991) native manioc starch has $5-35\mu \mathrm{m}$ diameter round, oval, polygonal and cylindrical granules. For natural xanthan fiber remains can be observed (Fig. 1, b) formed during recovery, when the polymer is made insoluble with a non-solvent such as ethyl or isopropyl alcohol (Vendruscolo et al, 2000). Xanthan deacetylation process involves solubilization, treatment and re-insolubilization, with further drying. The withdrawal of acetyl ions caused reduction in repulsion among molecules (Klaic et al, 2016), enabling higher material compaction (Fig. 1, c). As can be observed, crosslinking of the native manioc starch/deacetylated xanthan caused breakage of granule structure (Fig. 1, b-h). For materials originated from crosslinking of mixtures containing lower proportion of xanthan highly compact polygonal structures could also be observed (Fig. 1, d, e, h), which are absent from treatments where xanthan is in higher amount (Fig. 1, f, g). In some cases, it was possible to observe orifices, probably caused by bubbles trapped in the material (Fig. 1, g).
# 3.4. Infrared
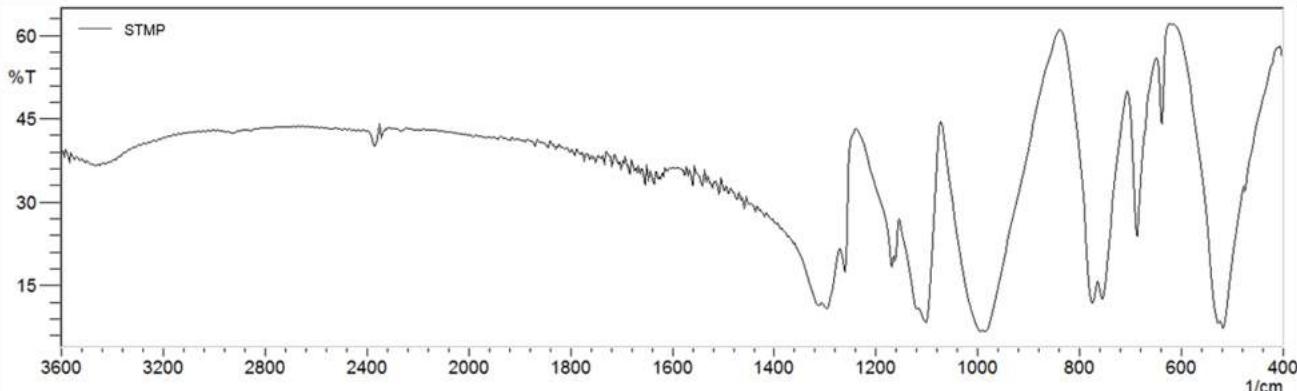
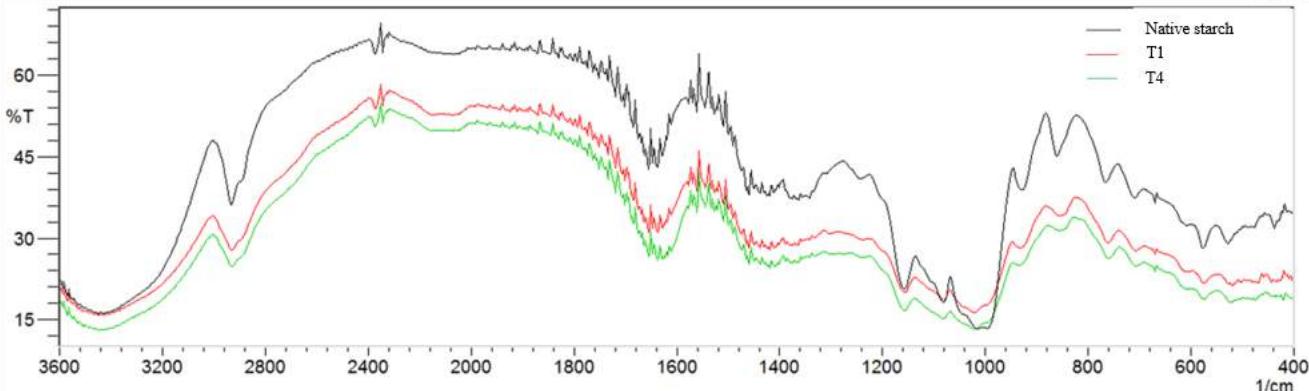
Fig. 2 shows spectra for natural and deacetylated samples (Fig. 2, a), sodium trimetaphosphate (Fig. 2, b), native manioc starch and a few spectra of native manioc starch/deacetylated xanthan crosslinked mixture (Fig. 2, c).
A
B
C
Fig. 2: IR spectra for natural xanthan, deacetylated xanthan (a); SMTP (b); native manioc starch and treatments T1 (starch 4.5/xanthan 0.5; t 52 min) and T4 (starch 3.5/xanthan 1.5; t 127 min) (c) in accordance with the Central Composite Rotatable Design.
Infrared spectroscopy results strengthen those found in the acetyl content chemical analysis (Table 2). The axial deformation of the $\mathrm{C=O}$ linking esters is characterized by a band at 1710 to $1730~\mathrm{cm^{-1}}$ (Faria, 2011), normally present in xanthan spectra. This band is however absent in deacetylated xanthan (Fig. 2, a) and in the crosslinked mixtures of native manioc starch/deacetylated xanthan (Fig. 2, c). This result corroborates deacetylation effectiveness. Spectra of crosslinked mixtures of native manioc starch/deacetylated xanthan samples exhibit a strong and large absorption band at 3200 to $3600~\mathrm{cm^{-1}}$ related to hydroxyl groups (OH), both free and associated through hydrogen bonds, but having lower intensity relative to the controls (native starch and deacetylated xanthan) and at $2931~\mathrm{cm^{-1}}$, related to the asymmetric stretching of methylene group $(\mathrm{CH}_2)$
The main sign of modification as a function of sodium trimetaphosphate is the insertion of absorption bands in the 1000 to $1200\mathrm{~cm}^{-1}$ region, related to the axial deformation of the methyl esters C-O linkage in the crosslinked mixtures. The accentuated intensities of the bands in the region of 516.92 to $687\mathrm{~cm}^{-1}$ are attributed to the vibrational stretching of the phosphorus bridges (O-P-O) and/or $(\mathrm{P=O})$ from 756 to $776\mathrm{~cm}^{-1}$, related to the (P-O-P) symmetrical stretching. The band at $895\mathrm{~cm}^{-1}$ is attributed to the asymmetric vibrational stretching of the P-O-P group, and at the $1210\mathrm{~cm}^{-1}$ region are the bands related to the symmetrical $-\mathrm{P=O}$ stretching (Silverstein et al., 2007). The band aspect at $1022\mathrm{~cm}^{-1}$, related to changes in structural organization, shows that the formed materials are of amorphous character (Li et al., 2009). Phosphate bonds characteristic bands $(1210\mathrm{~cm}^{-1})$ which supposedly occur through STMP insertion to the polymer do not appear in the crosslinked samples spectra, being associated to low crosslinking levels (Li et al., 2009).
# 3.5. Rheometrical Analyses
In Fig. 3 viscosity curves versus shear stress for native manioc starch, natural and deacetylated xanthan gums and the crosslinked mixtures of native manioc starch and deacetylated xanthan gums can be seen. As a control for the crosslinking process effect, the physical mixtures, without crosslinking obtained by the proportions of starch/xanthan used in T5 and T6 respectively, with the lower and the highest xanthan concentration, were also assessed.
Materials exhibited pronounced differences as regards viscosity and pseudoplasticity. Deacetylated xanthan showed the higher viscosity, while natural xanthan did not correspond to the expectations; native starch, however, was the least viscous material. All crosslinked samples were more viscous than native starch. This is a quite significant result, since in a previous study on starch crosslinking it has been identified that some treatments caused increase in viscosity, while other ones showed reduction. The condition used (S $5\%$ ; STMP $5\%$ ; SS $3\%$ ) was the same employed for T1 of the starch crosslinking study, which resulted in a more viscous material than the native manioc starch (Fig. 3) of the previous study.
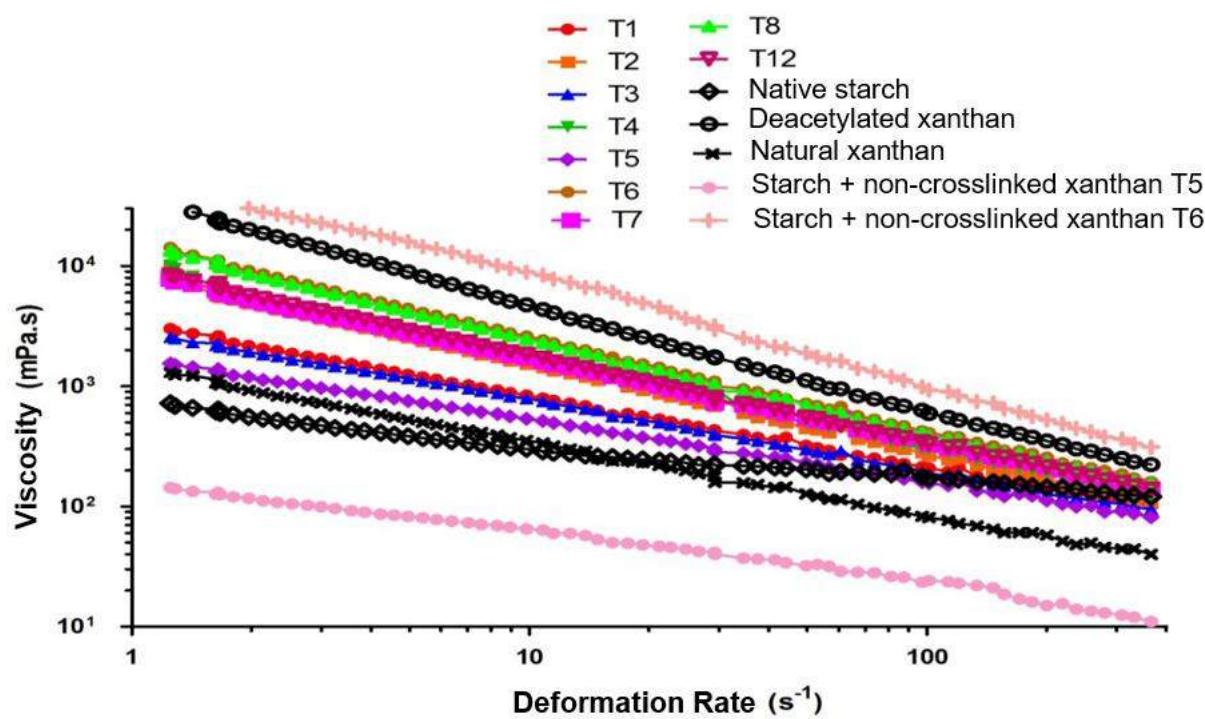
Fig. 3: Filmogenic solution for native and crosslinked manioc starches at $3\%$ , according to the Central Composite Rotational Design (CCRD $2^{2}$ ).
Table 4 contains the values obtained for parameters $K$ and $n$ through the Ostwald-de-Waele rheological mathematical model.
Table 4: Effects of the treatments performed on the humidity and the parameters of the Ostwald-de Waele rheological model of the polymers ${}^{\mathrm{b}}$ Flow index.
<table><tr><td>Treatment</td><td>Humidity (%)</td><td>Ka(Pa.sn)</td><td>nb(non-dimensional)</td><td>R2c(nondimensional)</td></tr><tr><td>Native starch</td><td>11.983±0.01b</td><td>0.69 ± 0.02g</td><td>0.68 ± 0.01a</td><td>0.999</td></tr><tr><td>Natural Xanthan</td><td>12.63±0.02b</td><td>1.367 ± 0.02g</td><td>0.41 ± 0.01bc</td><td>0.997</td></tr><tr><td>Deacetylated Xanthan</td><td>12.010±0.01b</td><td>34.4 ± 3.68b</td><td>0.12 ± 0.05e</td><td>0.999</td></tr><tr><td>T1</td><td>9.880±0.01g</td><td>3.15 ± 0.03fg</td><td>0.41 ± 0.01bc</td><td>0.998</td></tr><tr><td>T2</td><td>11.027±0.01cd</td><td>9.12 ± 0.87de</td><td>0.20 ± 0.08de</td><td>0.997</td></tr><tr><td>T3</td><td>11.333±0.01c</td><td>6.29 ± 0.67ef</td><td>0.28 ± 0.01cd</td><td>0.997</td></tr><tr><td>T4</td><td>9.343±0.01h</td><td>10.43 ± 0.07g</td><td>0.13 ± 0.02e</td><td>0.995</td></tr><tr><td>T5</td><td>10.553±0.02def</td><td>1.83 ± 0.19g</td><td>0.46 ± 0.05b</td><td>0.997</td></tr><tr><td>T6</td><td>10.330±0.03efg</td><td>17.26 ± 1.24c</td><td>0.16 ± 0.07de</td><td>0.995</td></tr><tr><td>T7</td><td>10.740±0.05de</td><td>8.54 ± 0.38de</td><td>0.31 ± 0.01bcd</td><td>0.999</td></tr><tr><td>T8</td><td>12.893±0.03a</td><td>14.50 ± 0.21c</td><td>0.24 ± 0.01de</td><td>0.998</td></tr><tr><td>T11</td><td>10.103±0.01fg</td><td>9.16 ± 0.16de</td><td>0.29 ± 0.01cd</td><td>0.997</td></tr><tr><td>Starch + non-crosslinked xanthan T5</td><td>*</td><td>**</td><td>**</td><td>**</td></tr><tr><td>Starch + non-crosslinked xanthan T6</td><td>*</td><td>45.347 ± 0.05a</td><td>0.30 ± 0.02cd</td><td>0.997</td></tr></table>
a Index of Consistency
b Flow index.
Coefficient of determination.
Equal letters on the same column mean that there is no significant difference between the treatments for $p < 0.05$ . *Not determined. **Negative Value, not Significant Values for humidity are in accordance with the Regulatory Instruction MAPA $n^{\circ}$ 23 of December 14, 2005 (BRAZIL, 2005a) which states that it could be up to $14\%$ . ANVISA, according to RDC $n^{\circ}$ 263 of September 22, 2005 (BRAZIL, 2005b), allows a maximum of $18\%$ . Leonel et al (2009) upon characterizing manioc starch for use in producing extrudates obtained $12.2\%$ humidity. In this study the humidity contents were $12.263\%$ and $12.010\%$ for the natural and deacetylated xanthan gums respectively, higher values than those reported in the literature for commercial xanthan, which normally has a water content of nearly $10\%$ (García-Ochoa et al., 2000), with values from 8 to $15\%$ being acceptable (Born et al., 2002; García-Ochoa et al., 2000). As for viscosity, deacetylated xanthan was the most viscous material, being higher than that of natural xanthan. Studies by Khouryieh and collaborators (2007) reported that both the viscosity and the viscoelasticity of the mixtures with deacetylated xanthan were higher than those with natural xanthan. Authors also attributed the increase in synergistic interaction to deacetylation, due to its contribution to the destabilization of the helicoid structure and consequent disordering of the xanthan molecule.
As relates to native starch, all the manioc native starch/deacetylated xanthan crosslinked mixtures had higher viscosity and pseudoplasticity, corroborated by the higher $K$ and $n$ values, respectively. Treatments T6 and T8, which combined the higher levels of xanthan and time, respectively, had the higher viscosities, without differing statistically, showing the best results. The lower viscosity was observed for T5, obtained with the lowest xanthan level and time at the central value.
The physical mixtures (without crosslinking) obtained by the starch/xanthan proportions used for T5 and T6, respectively with lower and higher xanthan concentration, presented relevant data. T5 did not present significant data, and T6 had the highest viscosity of this study. This is an important information which deserves to be examined; however, the goal of this study is the polymer mixtures crosslinking, to obtain improved properties, such as WVP and solubility.
Figures for $n$ (flow behavior indexes) were lower than the unity (1), which characterizes non newtonian fluids of pseudoplastic behavior, that is, the farther it is from the unity, the higher the pseudoplasticity, characterized by viscosity reduction with increased tensions. This same behavior was observed by López et al (2008) for flow curves of starch filmogenic suspensions.
Treatment T6, which combined the highest xanthan concentration (T6 - S 3.3% and X 1.7%, with 90 min reaction time), resulted in the starch xanthan mixture with the best rheological characterization, higher viscosity.
# 3.6. Thermal Properties (DSC)
Table 5 shows that both the original polymers and those hybridized by crosslinking had endothermic peaks, and that a huge difference in enthalpy variation could be observed among the samples.
Deacetylated xanthan showed lower melting range, indicating lower polydispersity (REF), and occurred at a temperature $(144.18^{\circ}\mathrm{C})$ higher than that of the native manioc starch $(75.99^{\circ}\mathrm{C})$. Therefore, it appears that deacetylation can have a positive effect on xanthan, since Ramasamy and collaborators (2011) determined that commercial xanthan melting temperature is in the range of 90 to $120^{\circ}\mathrm{C}$, with an endothermic peak observed at $108.9^{\circ}\mathrm{C}$. The same value was found for commercial xanthan by Ahuja et al. (2012). According to Horn et al. (2023), who obtained xanthan under different conditions, xanthan degradation starts around $150^{\circ}\mathrm{C}$ and ends at $400^{\circ}\mathrm{C}$. As for starch, the thermal transition occurred at much lower temperatures, consistent with the lower structural stability of native manioc starch and the absence of crosslinking interactions.
In general terms crosslinking increased melting temperature, comparing to deacetylated xanthan and native manioc starch, but the effect on enthalpy variation was dependent on the time variable. The highest melting temperature was observed for sample T4, submitted to a longer reaction time (127 min), while sample T1, crosslinked under milder conditions (52 min) exhibited lower melting temperature as compared to sample T4.
Table 5: Differential Scanning Calorimetry for deacetylated xanthan, native manioc starch, and a few crosslinked treatments; heating from 30 to $205^{\circ}\mathrm{C}$ at a $10^{\circ}\mathrm{C/min}$ rate; and cooling from $250^{\circ}\mathrm{C}$ to $100^{\circ}\mathrm{C}$ at a $10^{\circ}\mathrm{C/min}$ rate.
<table><tr><td>Parameters</td><td>Deacetylated X.</td><td>Native manioc starch</td><td>T1</td><td>T4</td></tr><tr><td>Onset - T° (°C)</td><td>141.22</td><td>33.93</td><td>143.74</td><td>182.74</td></tr><tr><td>Peak-Tp (°C)</td><td>144.18</td><td>75.99</td><td>146.40</td><td>185.41</td></tr><tr><td>Endset Tf (°C)</td><td>150.08</td><td>106.27</td><td>155.33</td><td>185.35</td></tr><tr><td>ΔT (Tf-T0) (°C)</td><td>8.86</td><td>72.34</td><td>11.59</td><td>2.61</td></tr><tr><td>Enthalpy variation ΔH (J.g-1)</td><td>110.35</td><td>316.86</td><td>86.00</td><td>0.67</td></tr></table>
# 3.7. Characterization of the films
# 3.7.1. Macroscopic Properties
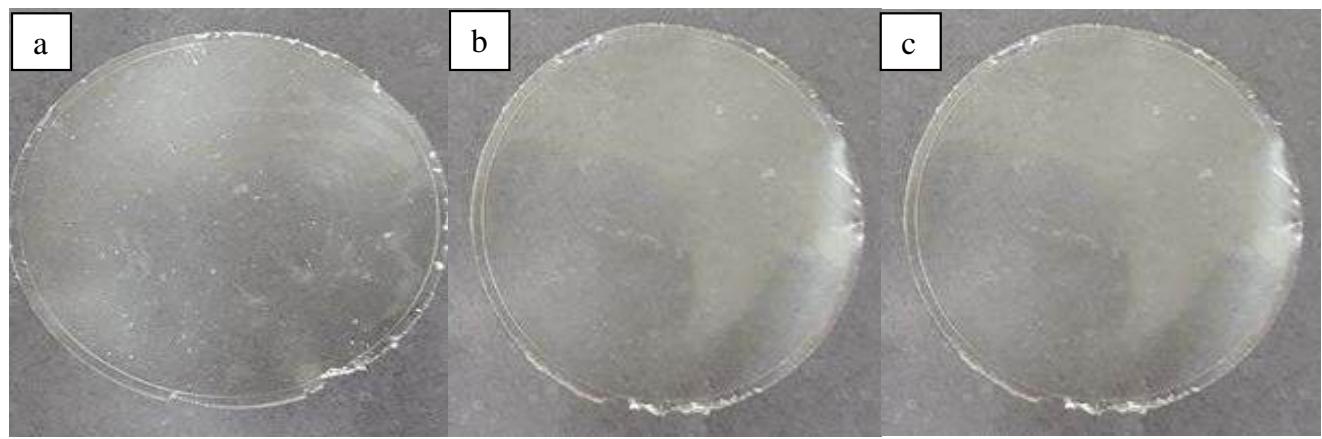
Fig. 4 illustrates the aspect of the produced films from crosslinked mixtures of native manioc starch/deacetylated xanthan.
Fig. 4: Films obtained by casting based on a filmogenic solution containing $3\%$ $(\mathrm{m/m})$ of the crosslinked mixture of native manioc starch/deacetylated xanthan and $0.9\%$ glycerol (a) F1 (T1); (b) F4 (T4); (c) F6 (T6).
Films based on the crosslinked mixture of native manioc starch/deacetylated xanthan were excellent as regards homogeneity, handling and continuity. For films of higher xanthan concentration bubbles were formed, since the higher viscosity provides the imprisonment of air.
Thickeners are commonly used as stabilizers for aerated systems (Damodaran et al., 2010). Films had also fair transparency and gloss.
# 3.7.2. SEM
Fig. 5 illustrates the aspect of films prepared with the crosslinked mixture of native manioc starch/deacetylated xanthan.
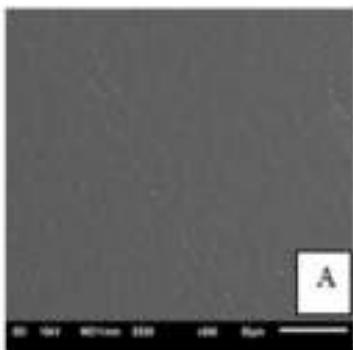
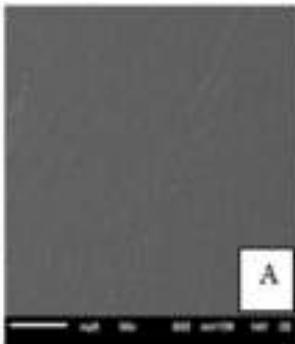
Fig. 5: Films prepared with the native manioc starch/deacetylated xanthan mixture of treatments 1 (a) and 4 (b).
Aiming at observing and analyzing possible roughness and flaws SEM measurements were performed. Fig. 5 illustrates the micrographs for different films of the crosslinked mixture of native manioc starch/deacetylated xanthan. In comparison with films obtained from crosslinked starches, as reported in the previous study, addition of xanthan to starch previously to crosslinking provided more homogeneous films. The surfaces of the crosslinked films do not have pores nor cracks. Xanthan or starch granules were not observed, those being completely solubilized. The films were continuous and homogeneous. Similar results were reported by Henrique et al. (2008), who compared the micrographs of commercial crosslinked starch films to other three different kinds of modified starches.
# 3.7.3. Physical and chemical properties
Table 6 lists the results of the experiment, for the two assessment periods, obtained by applying the second order Central Composite Rotational Design (CCRD $2^{2}$ ) based on the response surface methodology (RSM) employed to assess the effect of crosslinking on the mixture of native manioc starch/deacetylated xanthan, and of the reaction time on the physical and chemical properties of the edible films obtained.
Table 6: Experimental CCRD $2^{2}$ planning matrix, with codified and actual levels, and values of the variable responses obtained for the films. Independent Variables Dependent Variables
<table><tr><td rowspan="2">Treatments</td><td colspan="3">Independent Variables</td><td colspan="5">Dependent Variables</td></tr><tr><td>Starch + Xanthan (%)</td><td>Time (min)</td><td>Solubility (%)</td><td>WVP</td><td>Thickness</td><td>Opacity</td><td>Tensile strength (Mpa)</td><td>Elongation (%)</td></tr><tr><td>1</td><td>-1 (4.5 + 0.5)</td><td>-1 (52)</td><td>17.96</td><td>7.16</td><td>0.099</td><td>10.69</td><td>12.33</td><td>29.08</td></tr><tr><td>2</td><td>+1 (3.5 + 1.5)</td><td>-1 (52)</td><td>19.05</td><td>9.50</td><td>0.104</td><td>10.7</td><td>10.67</td><td>7.7</td></tr><tr><td>3</td><td>-1 (4.5 + 0.5)</td><td>+1 (127)</td><td>12.21</td><td>11.52</td><td>0.125</td><td>10.95</td><td>7.58</td><td>25.08</td></tr><tr><td>4</td><td>+1 (3.5 + 1.5)</td><td>+1 (127)</td><td>12.13</td><td>8.42</td><td>0.099</td><td>10.52</td><td>13.04</td><td>10.08</td></tr><tr><td>5</td><td>-α (4.7 + 0.3)</td><td>0 (90)</td><td>16.19</td><td>8.13</td><td>0.114</td><td>10.66</td><td>5.62</td><td>34.42</td></tr><tr><td>6</td><td>+α (3.3 + 1.7)</td><td>0 (90)</td><td>14.70</td><td>8.66</td><td>0.097</td><td>10.47</td><td>10.33</td><td>4.58</td></tr><tr><td>7</td><td>0 (4.0 + 1.0)</td><td>-α (37)</td><td>15.86</td><td>9.89</td><td>0.137</td><td>9.91</td><td>5.92</td><td>13.58</td></tr><tr><td>8</td><td>0 (4.0 + 1.0)</td><td>+α (142)</td><td>17.78</td><td>10.11</td><td>0.126</td><td>13.54</td><td>6.54</td><td>3.17</td></tr><tr><td>9</td><td>0 (4.0 + 1.0)</td><td>0 (90)</td><td>18.67</td><td>7.22</td><td>0.107</td><td>12.45</td><td>8.57</td><td>12.67</td></tr><tr><td>10</td><td>0 (4.0 + 1.0)</td><td>0 (90)</td><td>18.60</td><td>8.02</td><td>0.107</td><td>11.54</td><td>7.34</td><td>9.83</td></tr><tr><td>11</td><td>0 (4.0 + 1.0)</td><td>0 (90)</td><td>18.44</td><td>7.90</td><td>0.109</td><td>11.27</td><td>7.86</td><td>14.58</td></tr></table>
For the dependent variables, solubility, opacity and tensile strength, the effects were not so statistically significant within the studied ranges, as well as it has not been possible to generate predictive models for these analyses, as well as demonstrate the respective response surfaces.
The best solubility results were obtained at F1 (T1 - 4.5 starch + 0.5 xanthan) and F4 (T4 - 3.5 starch + 1.5 xanthan), where F1 combined the lower WVP value (7.16%) and low solubility (17.96%), poor thickness (0.099 mm) and low xanthan concentration (0.5%), which would imply lower process cost for the industrial application. F4 also revealed itself as efficient, since it had the lowest solubility value (12.13%) and one of the lowest WVP values (8.42%) and thickness (0.099 mm), this set of properties being very positive for obtaining edible packaging films.
For the tensile strength analysis, the proportion of native manioc starch/deacetylated xanthan, its interaction with time influenced the results, however time per se did not show effect in this response. For the opacity results, independent variables did not produce any effects.
For the dependent variables, WVP, thickness and elongation, significant and predictive mathematical models were generated, with $95\%$ confidence and coefficients of determination $(\mathbb{R}^2)$ 0.90, 0.72 and 0.93, respectively. Based on statistical analysis, the significant regression coefficients at $95\%$ were considered in the mathematical models proposed to represent Equations 1 (WVP), 2 (Thickness) and 3 (Elongation) for the films, as a function of the percentage of xanthan and starch (XS) and reaction time (T). See below Equations 3, 4 and 5:
$$
\mathrm{WVP} = 7.71 - 0.003 \times \mathrm{XS} + 0.66 \times \mathrm{XS} ^ {2} + 0.90 \times \mathrm {T} + 2.27 \times \mathrm {T} ^ {2} - 2.72 \times \mathrm{XS} \times \mathrm {T} \tag{3}
$$
$$
\text{Espessura} = 0.11 - 0.01 \times \mathrm {XS} - 0.008 \times \mathrm {XS} ^ {2} + 0.001 \times \mathrm {T} + 0.018 \times \mathrm {T} ^ {2} - 0.016 \times \mathrm {XS} \times \mathrm {T} \tag{4}
$$
$$
Elongação = 12.34 - 19.68 \times \mathrm {XS} + 9.23 \times \mathrm {XS} ^ {2} - 4.08 \times \mathrm {T} - 1.97 \times \mathrm {T} ^ {2} + 3.20 \times \mathrm {XS} \times \mathrm {T} \tag{5}
$$
The response surfaces and contour plots for the analyses of films based on the model generated by Equations 3, 4 and 5 are respectively illustrated in Figures 8, 9 and 10.
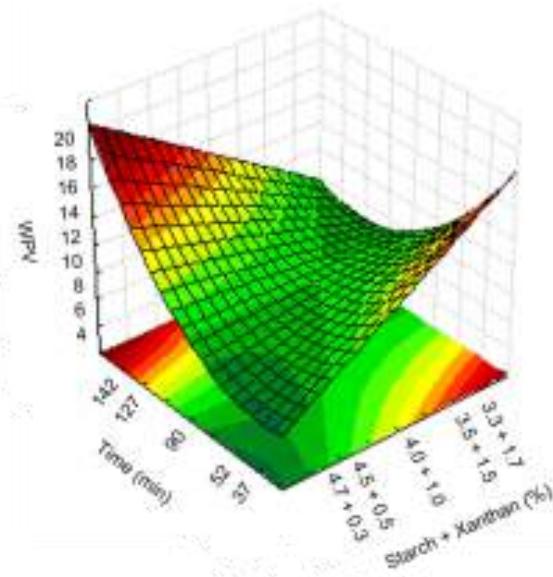
Fig. 8: Response surfaces and contour plots as a function of starch and xanthan proportion and time, related to the WVP analysis.
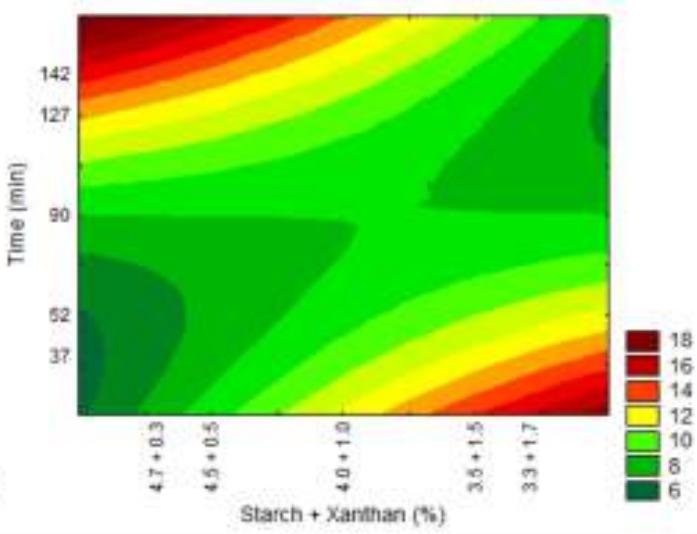
No significant effect of the native manioc starch/deacetylated xanthan crosslinked mixture related to water vapor permeability (WVP) could be observed, it being evidenced only when combined with time. However, reaction time had significant effect per se. Increased xanthan concentration in the treatments provides superior WVP results as can be observed for the contour plot (Fig. 8).
Matta et al. (2011), assessed biofilms obtained from pea starch associated with xanthan gum and glycerol, and found solubility values between 3.14 and $18.19\%$ . In this study the values obtained were between 12.13 and $17.96\%$ .
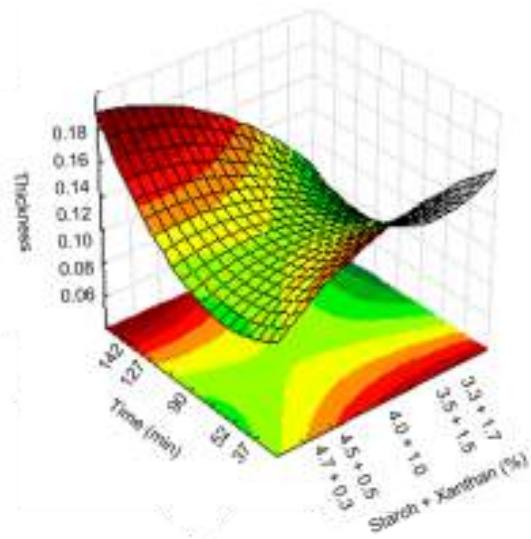
Fig. 9: Response surfaces and contour plots as a function of the starch and xanthan percentage and time, related to thickness analysis.
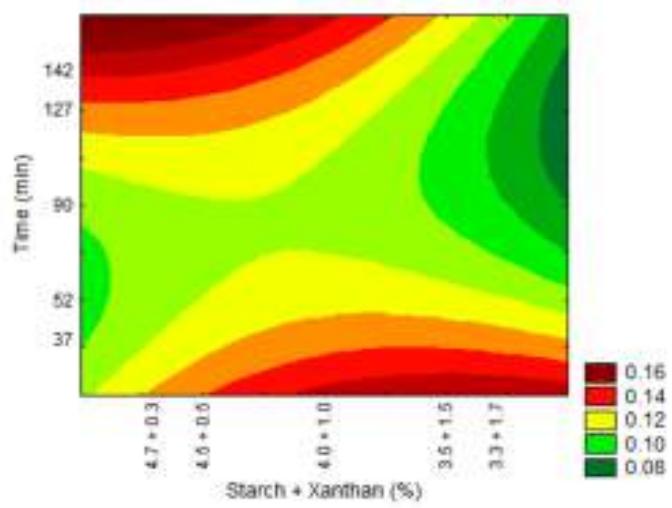
For thickness all the variables had a significant effect, with values between 0.097 and $0.137\mathrm{mm}$ . According to Embuscado & Huber (2009) in general biodegradable films thickness is lower than $0.300\mathrm{mm}$ , this being a main physical feature, since in their use as packaging the type, volume and weight of the food to be stored should be considered. According to the contour plot (Fig. 9) increase in film thickness can be seen as far as xanthan concentration is increased and starch concentration in the mixture is reduced. Silva (2011) found thickness values lower to those obtained in this study for biofilms produced with native pine nuts starch $(0.11\mathrm{mm})$ . Biofilms produced by Matta et al. (2011) with pea starch and xanthan showed thickness variation from 0.055 and $0.098\mathrm{mm}$ .
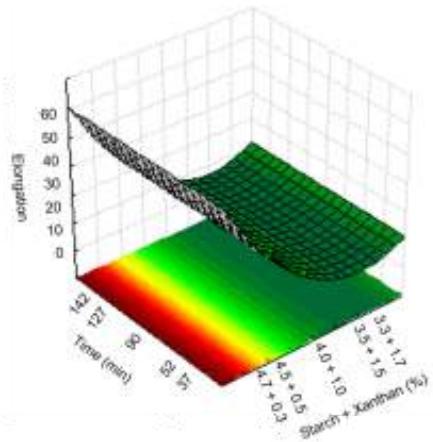
Fig. 10: Response surfaces and contour plots as a function of starch and xanthan percentages, related to elongation analysis.
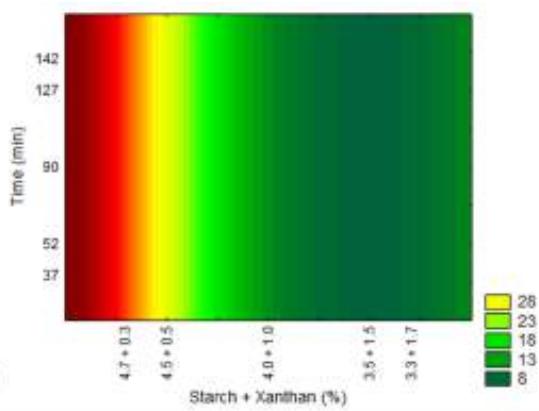
For elongation analysis time did not show any effect on the results, only the starch/xanthan concentration, with values between 3.17 to $34.42\%$ . It could be seen that the increase in xanthan concentration, combined with reduction in starch concentration caused reduced film elongation.
# IV. CONCLUSIONS
Deacetylation resulted in significant increase in xanthan viscosity. Deacetylation and crosslinking were corroborated by absence of the band at 1710 to $1730~\mathrm{cm}^{-1}$, related to $\mathrm{C=O}$ bond esters axial deformation and appearance of bands in the 1000 to $1200~\mathrm{cm}^{-1}$ region, related to the axial deformation of the methyl esters C-O linkage in the crosslinked mixtures, respectively.
Crosslinking variables polymers starch/xanthan proportion and reaction time influenced the hybrid materials - powders and films - properties, which was corroborated by rheological, thermal, SEM and IR analyses. Favorably, crosslinking increased viscosity and melting temperature. Higher proportions of xanthan and reaction time caused increase in melting temperature and reduction in enthalpy variation.
Films prepared from native manioc starch crosslinked with deacetylated xanthan hybrid polymers exhibited excellent results as for macroscopic characteristics, low opacity, low humidity, WVP and solubility. T1, obtained at level -1 of reaction time, combined the lower WVP with low solubility, small thickness and the second highest tensile strength with, favorably, low amount of xanthan, which lowers the industrial application process cost. T4 was also efficient, since it had the lowest solubility and one of the lowest WVP values and thickness and higher tensile strength, this set of properties being very positive for preparing edible packaging films.
# 4.1 CRediT authorship contribution statement
Marisa Karow: Writing - original draft, Visualization, Validation, Methodology, Investigation. Karine Macagnan: Writing - original draft, Visualization, Data curation. Mariane Alves: Writing - original draft, Visualization. Patricia Diaz: Project administration, Conceptualization. Lígia Furlan: Writing - review & editing. Claire Vendrucolo: Project administration, Funding acquisition, Conceptualization. Angelita Moreira: Writing - review & editing, Funding acquisition, Conceptualization, Supervision.
# 4.2 Declaration of competing interest
The authors declare that they have no known competing financial interests or personal relationships that could have appeared to influence the work reported in this paper.
# ACKNOWLEDGEMENTS
The authors also thank the CAPES and CNPq funding agencies for financial support.
Generating HTML Viewer...
− Conflict of Interest
The authors declare no conflict of interest.
− Ethical Approval
Not applicable
− Data Availability
The datasets used in this study are openly available at [repository link] and the source code is available on GitHub at [GitHub link].