

Abstract
CO₂ exchanges between continents, oceans and atmosphere are analyzed over the last 50 years, correcting for the importance of agriculture and forestry. Global crops capture and store an average of 40.4 GtCO₂/year, a flow greater than fossil emissions, both following
population growth. The mineralization of agricultural and forestry biomasses releases 12.3 GtCO₂/year, leading to a stable continental balance of about 7.2 GtCO₂/year emitted.
Contrary to previous studies, this one shows that the ocean has become an increasingly strong source of CO₂, from the neutrality of the 1970s to reaching an average of 10.4 GtCO₂/year over the last decade. Over the half-century, the ocean has contributed 55% to the increase in atmospheric CO₂ concentration, with the remainder coming from the continents. These results challenge common assessments that underestimate the role of crop plants as CO₂ sinks and, as therefore, wrongly attribute to the ocean a role in absorbing anthropogenic
emissions.
Explore Digital Article Text
I. INTRODUCTION
The current global warming supports the theory defended by the Intergovernmental Panel on Climate Change (IPCC) according to which it is the consequence of emissions by combustion of fossil hydrocarbons (IPCC, 2023). Accepting this postulate, most governments have taken binding measures to reduce those emissions by decarbonizing the activities of the society. To this end, they have notably established and promoted carbon capture, utilization and storage (CCS or CUSC) systems, mainly by geological burial (Global CCS Status, 2024).
In a previous paper of which this one is a sequel (Muller-Feuga, 2024b), we examined the contribution of global agriculture and forestry by considering statistics of products marketed and their carbon content, i.e. 40 to 50% of the dry weight. The underestimation of CCS by cultivated plants in most of the literature related to the subject (e.g. Canadell et al., 2021) was thus highlighted. The figures for 2022 showed that agriculture and forestry are the largest global CCS systems in terms of quantity with a mean duration of a quarter of century, offsetting fossil emissions and making their possible impact on the climate non-existent.
These results also suggested that the ocean is likely a source, contradicting widely accepted views (e.g. Friedlingstein et al., 2023). If in a previous paper (Muller-Feuga, 2023) we identified the ocean as a sink, it was because only commercial parts of plants were considered in the balance. Subsequent studies (Muller-Feuga, 2024b) corrected this flaw and demonstrated that these commercial parts represent only half of all cultivated plants storage, as the above-ground and below-ground parts remaining in place after harvest also store carbon.
Having previously modeled captures and releases in duration and amplitude, the present study focuses on exchanges between the continents, the ocean and the atmosphere during the last half-century.
II. MATERIALS AND METHODS
The ocean's contribution to annual atmospheric fluxes, denoted as Co, is the unknown variable in equation (1), which expresses the yearly balance between positive sources and negative sinks:
where:
AW is atmospheric capture for organic matter synthesis,
EW is the release of atmosphericfrom mineralized organic carbon by plant and animal respiration and combustion,
EFOS includes emissions from fossil hydrocarbons combustion,
VTAC is the variation in atmospheric content.
The form of this relation is like the one used in Muller-Feuga, 2023, with simply a distinction between EW and EFOS. We also changed GATM for VTAC to express that atmospheric content could also diminish. The sum of the first three elements on the right constitutes the continental balance.
The first two terms AW and EW were derived from FAO (n.d.) statistics on the quantities of agriculture and forestry products placed on the market between 1970 and 2022, taken every ten years and interpolated. We assume that AW and EW obey two normal distribution laws over time, one increasing, the other decreasing, rendered by Gauss error function (erf). These laws' mean and median durations are equal to half the maximum capture period (CP) plus half the maximum release period (RM) expressed in years.
The theoretical distributions of carbon stocks S(t) over time t are defined as follows:
For capture:
For release:
where:
t is the year considered,
n is the harvest year,
AWn is the carbon stock at harvest year n,
CP and RM are the maximum capture and release periods, respectively,
erf is the standard error function,
and are the cambers (standard deviations).
When , the stock is being formed during the capture period (CP), and the error function erf is added. When , the stock undergoes mineralization during the release period (RM), and the error function erf is subtracted.
In Muller-Feuga (2024b), this modeling was applied to plants harvested in 2022 based on the 160 crop products, 48 livestock products, and 8 forestry products listed by FAO (n.d.) world statistics. This resulted in the parameters in Table 1.
| Parameter | Notation | t≤n | t>n |
| Captured CO2(GtCO2/year) | Sn | 41.6 | 41.6 |
| Camber | σ | 1.4 | 6.5 |
| CP, RM (year) | d | 9.46 | 45.60 |
The exercise was extended to the last half century using the parameters values of 2022. The quantities of captured were calculated based on FAO decadal statistics, which describe marketed agricultural and forestry products. These quantities were converted to anhydrous products, multiplied by their carbon content (40 to 50%), then by the mass ratio (3.37), and finally by the whole plant/commercial part ratio (2.78 for crops, 1.64 for fodder, 1.43 for forestry products).
III. RESULTS
The theoretical distribution over time of annual captures and releases by whole plants modeled by the equations (2) and (3) allows us to construct three 90x53 matrices, which we call C(t,n) for capture, R(t,n) for release and C(t,n) + R(t,n) for capture and release of atmospheric , where t is between 1969 and 2022, and n is between 1940 and 2030. Rows t contain the stocks constituted by successive harvests at time n, and columns n contain the stocks captured and then released in year n as a function of time t.
3.1 Captures
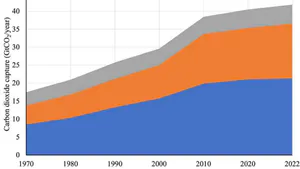
The amounts of captured annually by the main groups of plant production vary as shown in Figure 1. In 2022, the captures of crops (21.3 ) were the majority and exceeded the sum of fodder and forestry captures (13.2 and 6.6 , respectively). An unexplained bump due mainly to fodder breaks the linearity around 2010.
{"image_source":{"path":"images/49a57c6c4164abb02b781380e776ad152bb3c962821f64e78d218e504e86604b.jpg"},"content":"","chart_caption":[{"type":"text","content":"Figure 1: Global CO "},{"type":"equation_inline","content":"{2}"},{"type":"text","content":" capture by whole plants marketed from 1970 to 2022 (GtCO "},{"type":"equation_inline","content":"{2}"},{"type":"text","content":" /year; from FAO, n.d.)."}],"chart_footnote":[]}
Strictly speaking, the captured annually is equal to the change in carbon stock from one year to the next. However, to avoid double counting, the capture AW of year t in equation (1) was calculated based on the harvest of year t. Its variation peaking at 41.1 in 2022 is described by Figure 1.
3.2 Releases
Having defined the stock captured AW, the released into the atmosphere annually EW equals the variation of stock from year to year, or the sum of row t reduced by the sum of row t-1 of the matrix R(t,n) expressed as:
This can be considered as the derivative of the change in stocks. Since they are proportional to
AW which varies quasi-linearly over time (Figure 1), its derivative EW should be quasi-constant.
3.3 Variation Of Stocks Harvested Between 1970 And 2022
The column vectors n of the matrix vary as a function of time t as illustrated in Figure 2 between 1970 and 2022. To cover this entire half-century, it was necessary to go back to 1940 to include all stocks being released in 1970, and anticipate 2030 to include all stocks under construction in 2022. To do this, we extrapolated to 1940 according to the linear regression and to 2030 according to the regression , where n is the year considered. This is an acceptable hypothesis given the high value of the coefficients of determination ( ).
{"image_source":{"path":"images/a76f49f5d05a70b6fd950828e773620aa1b8510931b7c8639deeb8990b7da251.jpg"},"content":"","chart_caption":[{"type":"text","content":"Figure 2: Temporal distribution of global annual "},{"type":"equation_inline","content":"CO_{2}"},{"type":"text","content":" captures and releases by whole plants cultivated between 1970 and 2022 ("},{"type":"equation_inline","content":"GtCO_{2}/year"},{"type":"text","content":"). The thick black lines correspond to the ten-year periods."}],"chart_footnote":[]}
3.4 Continental Balance
The continental balance includes the annual exchange of continental sources and sinks, i.e. - AW + EW + EFOS. Figure 3 brings together the elements of the calculation of these exchanges where the quantities AW and EW result from the previous calculations while EFOS is provided by Global Carbon Budget (2024).
{"image_source":{"path":"images/b43a0a6aa4c00220aab9086a293edb4adc64168f60d55229541e17c1edd88127.jpg"},"content":"","chart_caption":[{"type":"text","content":"Figure 3: Continental balance of "},{"type":"equation_inline","content":"CO_{2}"},{"type":"text","content":" captures and releases and evolution from 1970 to 2022 ("},{"type":"equation_inline","content":"GtCO_{2}/year"},{"type":"text","content":"). Negative values indicate a sink and positive values a source."}],"chart_footnote":[]}
The capture of whole cultivated plants AW and the fossil emissions EFOS followed the evolution of the human population which increased from 3.7 in 1970 to 8.1 billion individuals in 2023. The three quantities have more than doubled over the period. It can also be noted that the capture of whole cultivated plants AW is higher in absolute value than the fossil emissions EFOS over time. As seen above, EW was relatively stable around an average of 10.2 GtCO /year over the period. The continental balance – AW + EW + EFOS is a source of 4 to 10 GtCO /year with an average of 6.8 GtCO /year over the period.
3.5 Atmospheric Balance
According to formula (1), the oceanic contribution Co is equal to the annual variations in atmospheric content (VTAC) minus the continental balance. The VTAC data were measured at the Mauna Loa Observatory (Keeling et al., 2001) and provided by the SCRIPS Institution of Oceanography.
Figure 4 shows that the atmosphere was negative and constituted a sink, while the oceanic contribution Co was mainly positive over the half-century considered here. The ocean, which was neutral in the 1970s, has become an increasingly strengthening source. It provided 52% of VTAC on average over the period, with the continental budget providing the remainder.
{"image_source":{"path":"images/706b62802bb04d28ae82adc1fd44d6ed67e69a372811086703ab356144ce19ed.jpg"},"content":"","chart_caption":[{"type":"text","content":"Figure 4: Evolution of the continental balance, the variation in atmospheric "},{"type":"equation_inline","content":"CO_{2}"},{"type":"text","content":" content VTAC, and the contribution of the oceans Co to atmospheric "},{"type":"equation_inline","content":"CO_{2}"},{"type":"text","content":" exchanges during the last half-century, in "},{"type":"equation_inline","content":"GtCO_{2}/year"},{"type":"text","content":". The fits are polynomials of order 2. Negative values indicate a sink, positive a source."}],"chart_footnote":[]}
IV. DISCUSSION
We are aware that extending the 2022 parameters of formulas (2) and (3) over half a century is questionable, and that we should have taken the true values of the statistics and assigned them the appropriate contents and durations. It would certainly improve the accuracy of the history of exchanges, perhaps make it possible to detect the influence of events such as pandemics, volcanic eruptions, wars, etc., but should not change the major trends at the global level described here. This preliminary exercise is intended to correct an oblivion and give the orders of magnitude resulting from this correction.
To achieve a comprehensive continental balance, it would be necessary to include capture and release by unmanaged vegetation covers. Their contribution is included in the item "rural emissions" of FAO (n.d.) statistics which include forest, savanna, and peatland fires and ranged between 3.8 and 9.2 GtCO /year over the last half-century. They are comparable to our EW.
What the IPCC-cited authors refer to as "land-use change emissions" ( , a source of 4.4 GtCO /year in 2022 according to Friedlingstein et al., 2023) are included in our EFOS fossil emissions which are thus significantly increased.
The CCS system formed by cultivated plants of agriculture and forestry is the main sink on the planet, a role not fully recognized by policymakers, particularly regarding carbon credit allocations (Muller-Feuga, 2024a). These vital productions are expected to grow alongside human demand, facilitated by the fact that increasing atmospheric concentrations enhance photosynthesis and yields (Haverd et al., 2020; Muller-Feuga, 2023).
Global temperatures have risen at a rate of C per decade over the past 50 years (Met Office Hadley Centre, 2024). The ocean appears to be outgassing, likely due to warming which reduces the solubility of gases. However, the ocean's response to climate variations is rarely immediate. Ice core records show that peaks lag temperature peaks by 600 to 1,000 years (e.g., Petit et al., 1999; Fischer et al., 1999; Caillon, 2003; Richet, 2021). This would be the time required for the global ocean to achieve a new thermal equilibrium with the atmosphere.
It may be necessary to trace the warming responsible for this outgassing back to the Medieval Climatic Optimum (1,000–1,200 AD), whose degassing was likely interrupted or slowed by the Little Ice Age (1,500–1,900 AD). The present warming, which coincided with the beginning of the industrial era, has been attributed to emissions from industry by IPCC and its authors without scientifically irrefutable argument. The greenhouse effect of they invoke is doubtful given that it is a trace gas present in the atmosphere at 0.04% of volume.
Neglecting that dry plant biomass contains 40–50% carbon, the role of cultivated plants in carbon budgets has been persistently underestimated by IPCC-cited authors (e.g., Terhaar et al., 2022; Friedlingstein et al., 2023; Gruber et al., 2023; Terhaar, 2024). These authors estimated plant captures ( ) between 9.2 and 13.9 GtCO /year—three times lower than this study's findings. They also underestimated emissions from biomass mineralization, which they call land-use change ( ), which are less than half our EW. These discrepancies explain why cultivated plants are not recognized as the dominant CO sink.
This underestimation has led these authors to assign a sink role of 10.3 to the ocean in 2022 (Friedlingstein et al., 2023) to account for excess . By using the notation Socean for the oceanic contribution, IPCC-cited authors implicitly conceive of the ocean solely as a sink (e.g. Rödenbeck et al., 2015). This conclusion is supported by numerous marine measurements of fugacity and total inorganic carbon, suggesting that the ocean absorbs a quarter of anthropogenic emissions (NOAA-SOCAT). Yet, most vertical carbon concentration profiles in the ocean show higher values at depth than at the surface, suggesting that the ocean acts as a source rather than a sink (e.g., Takahashi et al., 1979). According to McKinley et al. (2023), oceanic would be of deep origin. So, measurements on land and at sea seem insufficient to accurately describe mass exchanges due to gaps in spatial and temporal coverage, as well as limitations in sensor precision and interpolation models (e.g. McGillis et al., 2004; Crisp et al., 2022). The estimates for continental and oceanic fluxes are highly imprecise, fueling controversies (e.g. Luyssaert et al., 2008; Gundersen et al., 2021; Luyssaert et al., 2021; Zhong et al., 2024).
V. CONCLUSION
Assessed on the basis of their products placed on the market and their carbon content, agricultural and forestry capture and storage constitute the planet's main sink, absorbing 39.9 over the last ten years and thus offsetting the 36.0 emitted by fossil fuels combustion over this period. The restitution of atmospheric by mineralization of plant production and the emitting continental balance were stable at around 10.2 and 6.8 , respectively, on average over the half-century.
The ocean, predominantly a source, has grown from neutrality in 1970 to emitting an average of over the past decade. Over the 50 years studied, it contributed 52% of the increase in atmospheric concentration, with the remainder supplied by the continents. By presenting this work, we acknowledge that our results contradict many studies that claim the ocean is a sink absorbing part of anthropogenic emissions, allegedly responsible for climate warming.
These results rehabilitate agriculture and forestry, which constitute an unparalleled carbon sink and which should be rewarded for this, while they are sometimes unfairly accused of being a net source. But above all, they call into question the certainties on which the decarbonization policies of today's society are based, which require considerable efforts and which shame the populations who burn fossil hydrocarbons to escape poverty. Furthermore, they discredit international bodies like IPCC and the scientific community it cited which wanted to make us give up the use of fossil fuels supposedly responsible for climate warming. The credibility of these institutions will depend on the intentionality of concealing the facts reported here and yet scientifically accessible. It is not impossible that they were deliberately kept silent to promote a global ideological current believing in climate change under the influence of emissions. If this is proven, then these institutions would be disqualified for any issue affecting climate, energy and society.
ACKNOWLEDGMENTS
We are particularly grateful to all the data collectors at FAO, GCL, NASA, UN, BP, without whom this analysis would not have been possible. We thank the many people involved in collecting and making the world's data available, and acknowledge the considerable resources, people, and time that have gone into collecting this invaluable data. We also thank the engineers who wrote the programs to process this data, put it online, and make it easily accessible to users.
Conflict of Interest
The authors declare no conflict of interest.
Ethical Approval
Not applicable
Data Availability
The datasets used in this study are openly available at [repository link] and the source code is available on GitHub at [GitHub link].
Funding
This work did not receive any external funding.
References
Cite this article
Related Research


Special Issue
Launch a focused special issue to highlight research, emerging trends, and expert insights in your academic field.