


IntelliPaper
Abstract
Artificial intelligence (AI) has brought about a lot of revolution in financial analytics by helping to accurately analyse the stock market data. This paper explores the significance of artificial intelligence in risk and return analysis by taking a practical example of selected Indian listed firms. The objective of the research is to analyse the annual returns of selected stocks, measure risk by volatility, evaluate risk and returns characteristics of the stocks and draw Risk – Return plots. Furthermore, the research will apply some artificial intelligence techniques to help in identifying patterns in historical stock market data to predict stock performance. The study combines the use of traditional financial measures together with artificial intelligence in analysing investments. It is anticipated that the research will be able to show that AI is effective in capturing complex market dynamics and therefore risk assessment will be made in a more reliable way.
Explore Digital Article Text
Introduction
Artificial Intelligence (AI) has emerged as a transformative technology in the financial sector, revolutionizing investment analysis, portfolio management, and risk assessment. By leveraging machine learning, deep learning, and predictive analytics, AI enables financial institutions and investors to process vast amounts of financial data, identify hidden patterns, and generate more accurate forecasts than many traditional statistical approaches (Nazareth & Reddy, 2023). The increasing availability of big data and advances in computational intelligence have further accelerated the adoption of AI-based techniques in financial decision-making (Goodell et al., 2021). Risk and return are the two fundamental concepts in investment analysis, as every investment decision involves balancing the potential for profit against the possibility of financial loss. Traditional financial models, such as the Capital Asset Pricing Model (CAPM), Modern Portfolio Theory (MPT), and regression analysis, have long been employed to evaluate investment performance. However, these methods often rely on assumptions of linearity and normally distributed returns, which may not adequately represent the complex and dynamic nature of financial markets (Markowitz, 1952; Sharpe, 1964). AI-based models overcome many of these limitations by learning nonlinear relationships from historical data and continuously improving prediction accuracy through adaptive algorithms (Chen et al., 2023). The Indian stock market has experienced significant growth over the past decade, supported by increased retail participation, digital trading platforms, and greater financial inclusion. Consequently, financial institutions and investors are increasingly adopting AI-driven analytical tools to improve investment strategies and portfolio performance (Reserve Bank of India, 2024). Publicly available secondary data from the National Stock Exchange (NSE), Bombay Stock Exchange (BSE), Yahoo Finance, and the Reserve Bank of India provide researchers with extensive historical financial information that can be used for empirical analysis without the need for primary data collection. Secondary financial data facilitate the computation of key performance indicators such as daily returns, annualized returns, volatility, Beta, Sharpe Ratio, Maximum Drawdown, and Value at Risk (VaR). These indicators provide valuable insights into the risk-return characteristics of securities and portfolios. AI algorithms such as Random Forest, Support Vector Machine (SVM), Artificial Neural Networks (ANN), and Long Short-Term Memory (LSTM) networks can further enhance the predictive capability of these financial metrics by identifying complex relationships that may not be detected using conventional statistical techniques (Fischer & Krauss, 2018; Patel et al., 2015). This study investigates the role of AI in risk and return analysis using secondary data from selected Indian listed companies. Historical stock price data are analysed using R programming to compute financial performance measures and develop AI-based predictive models. The study compares the risk-return characteristics of multiple companies and evaluates the effectiveness of AI techniques in supporting investment decision-making. The findings of this study are expected to contribute to the growing literature on AI applications in finance, particularly in emerging economies such as India. Furthermore, the study provides practical insights for investors, portfolio managers, financial analysts, and policymakers by demonstrating how AI-driven analytical techniques can improve investment decisions, enhance risk assessment, and support evidence-based portfolio management in increasingly dynamic financial markets (Nazareth & Reddy, 2023; Goodell et al., 2021).
Literature review
Artificial Intelligence (AI) has revolutionized the financial sector by allowing us to analyze vast amounts of data with innovative methods and by improving the quality of investment decisions. Machine Learning (ML), Deep Learning (DL), and Predictive Analytics have come to enrich the predictive models of prices of assets, to improve the optimization of the portfolio and the control of the risks of financial markets. In comparison with statistical methods, the nonlinear relationship captured by AI models can be adapted to dynamic market conditions, thereby making more accurate forecasts (Goodell et al., 2021). MPT, pioneered by Markowitz (1952), establishes that investors should maximize the risk by spreading the portfolio. CAPM developed by Sharpe (1964) explains the risk/return relationship with the measure beta. Both models provide a framework for investment analysis, but these are based on hypotheses like the efficiency of markets, linear relationships, and normal distribution of returns which often are violated in reality (Fama, 1970). With the growing complexity of financial markets, it is interesting to focus on AI techniques to analyze high-dimensional, non-linear, and complex datasets such as those in finance. To provide predictions of stock market prices and to outperform traditional statistical methods, various machine learning algorithms have been employed. Among these methods, the hybrids machine learning methods achieved higher prediction accuracy than conventional statistical methods (Patel et al., 2015). Long short-term memory (LSTM) neural networks proved outperforming Random Forest and logistic regression methods for stock price forecasting of the S&P 500 (Fischer and Krauss, 2018). The recent review indicates that AI is an important topic within financial analysis, such as prediction of prices and the optimization of a portfolio or fraud prevention and assessment of the credit risk (Nazareth and Reddy, 2023). AI and machine learning are indeed rapidly developing areas within financial research that have a great potential to improve the decision quality and the market efficiency (Goodell et al., 2021). The control of investment risk is still one central theme. The measures generally used in performance control include the volatility, beta, the Sharpe ratio, VaR and Maximum Drawdown (Sharpe, 1966). Machine learning models go further, identifying patterns that may have not been perceived until now in historical data in order to predict price. Support vector machines, for example, generated better forecast models than statistical models of historical time series under conditions of market instability (Huang et al., 2005). Long short-term memory (LSTM), based on recurrent neural network architecture, have attracted a lot of research in finance, as well as other models based on deep learning for their capability to model temporal dependency (Sezer et al., 2020). Indeed, recurrent networks have been shown to provide more accurate forecasts than traditional models, such as ARIMA or GARCH. In these types of applications, the models were combined with financial indices, both technical and macro-economic (Sezer et al., 2020). There have also been successful studies that make use of ensemble methods. For example, Random Forest, first developed by Breiman (2001), is a popular machine learning method and is well-known for its predictive performance and ability to handle high-dimensional datasets. Another well-known ensemble model used for financial predictions is the gradient boosting method XGBoost (Chen and Guestrin, 2016). XGBoost can effectively predict market prices due to its highly optimized implementation that handles the data more efficiently and at a faster rate (Chen and Guestrin, 2016). A number of research studies have already examined the applications of artificial intelligence in emerging markets. For example, a study performed in a developing economy has shown that machine learning techniques could lead to a higher accuracy for stock market prediction, with ensemble methods generally outperforming other methods (Ballings et al., 2015). In India, a nation that witnessed the proliferation of digital financial instruments and the widespread use of big data analysis on financial markets has also accelerated AI implementation. Indian central bank RBI has highlighted the significance of responsible AI adoption, rigorous validation, and risk mitigation for banks (Reserve Bank of India, 2024). The availability of a rich stock market data from secondary sources like the National Stock Exchange (NSE), Bombay Stock Exchange (BSE) and Yahoo Finance provides the necessary foundation for such empirical studies. Analysing secondary data has numerous benefits, as they provide the market information more economically, readily, and offer a way to investigate longer term market tendencies. They transform price and volume data into specific metrics that are used in statistical and machine learning forecasting models: daily returns, annual returns, volatility, beta, Sharpe ratio, and Maximum drawdown (Fabozzi et al., 2014). Such measures allow for an objective evaluation of different performances. Though a considerable number of papers have contributed to this research field, most are concentrated in the American or European market and have relatively less experience in other emerging economies. Especially concerning India, relatively fewer academic researchers have looked into investment analysis utilizing AI with actual secondary financial data from Indian markets, mostly focused on simple price prediction without involving risk-return metrics. Combining the traditional performance indices along with machine learning algorithms and testing them on real-time secondary data from Indian market seems not common yet. This study therefore will investigate the performance measures based on traditional indices, with R software, using secondary data from selected companies of the Indian listed markets and apply some modern machine learning models for investment analysis based on a data framework incorporating both traditional risk-return metrics and ML algorithm.
Objectives of the study:
To analyse the annual return of selected Indian listed companies.
To measure the investment risk of selected stocks using volatility.
To compare the risk-return characteristics of multiple Indian stocks.
To visualize the relationship between risk and return through a Risk–Return plot
Research Methodology:
Research Design: The current study utilizes a quantitative descriptive research design to study the influence of Artificial Intelligence (AI) on risk and return analysis of secondary data. The research study utilizes AI assisted quantitative analyses via R Programming Language and R Studio to examine the risk and return attributes of certain Indian stocks. Combining basic financial analysis of performance parameters, along with computational tool to extract practical findings regarding investment decision process is applied.
Data Source: Data has been collected completely from second hand data which are available in open financial resources. The study involves collecting data for daily prices of stocks of listed Indian companies using Yahoo Finance, via ‘quantmod’package of ‘R’. Additionally, it collects benchmark market data through the index of the market, Nifty 50, also using the same source.
Sample: The sample of this research is selected as ten large cap Indian listed firms on the National stock exchange (NSE), representing different segments of the economy in India.
Reliance Industries Ltd.
Tata Consultancy Services Ltd.
Infosys Ltd.
HDFC Bank Ltd.
ICICI Bank Ltd.
These companies were selected because of their high market capitalization, liquidity, sectoral representation, and continuous availability of historical market data.
Study Period: The study analyses historical daily stock prices from 1 January 2019 to 31 December 2025.
Software and Analytical Environment: the analysis was implemented in r (Version 4.x) in RStudio Integrated development Environment (ide). This development tool allows to import financial data, run statistical computations, produce statistical graphs, and run Machine learning models.
Data analysis:
We analysed stock data of a set of chosen Indian companies and compiled them into this analysis in R Studio using the R language, where historical stock price data was acquired from Yahoo finance and from these we calculated the return of investment on each of our chosen stocks on an annualised basis, analysed risk using annualized standard deviation, computed the sharpe ratio, beta and maximum drawdown.
Fig 1: R packages
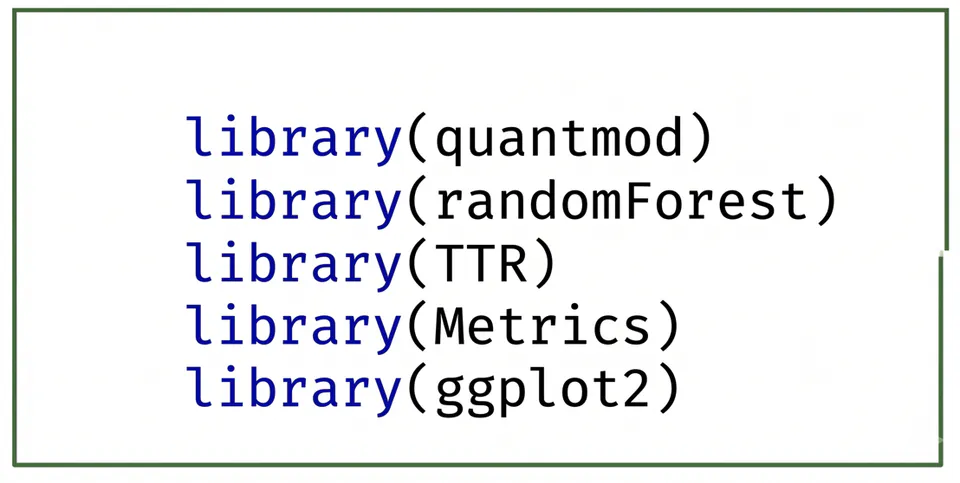
Interpretation: To begin, load all the R packages as follows to have access to the financial data, computation of risk and return, graphical representation, and machine learning functionalities (Fig 1). Download Historical Stock Market Data Using the “quantmod” library, we can download historical stock data directly from Yahoo Finance and use this library to handle financial time-series data. Import and Use for Predictive Modeling We also load “Random Forest” to develop an AI-based prediction model using the Random Forest algorithm for future enhancements of our analysis. Technical Trading Rules The “TTR” library helps calculate various technical indicators relevant for financial market analysis. Performance Measures For computing performance accuracy and other statistical metrics, we load the “Metrics” package. Visualisation of Risk and Return To enable plotting the Risk-Return Scatter plot for visual exploration of risk-return trade-off using ggplot2, we also loaded the “ggplot2” package for producing highly attractive and visually comprehensible graphs. Loading of the above mentioned R packages creates the work environment for financial modelling.
Fig 2: Data Acquisition Stages
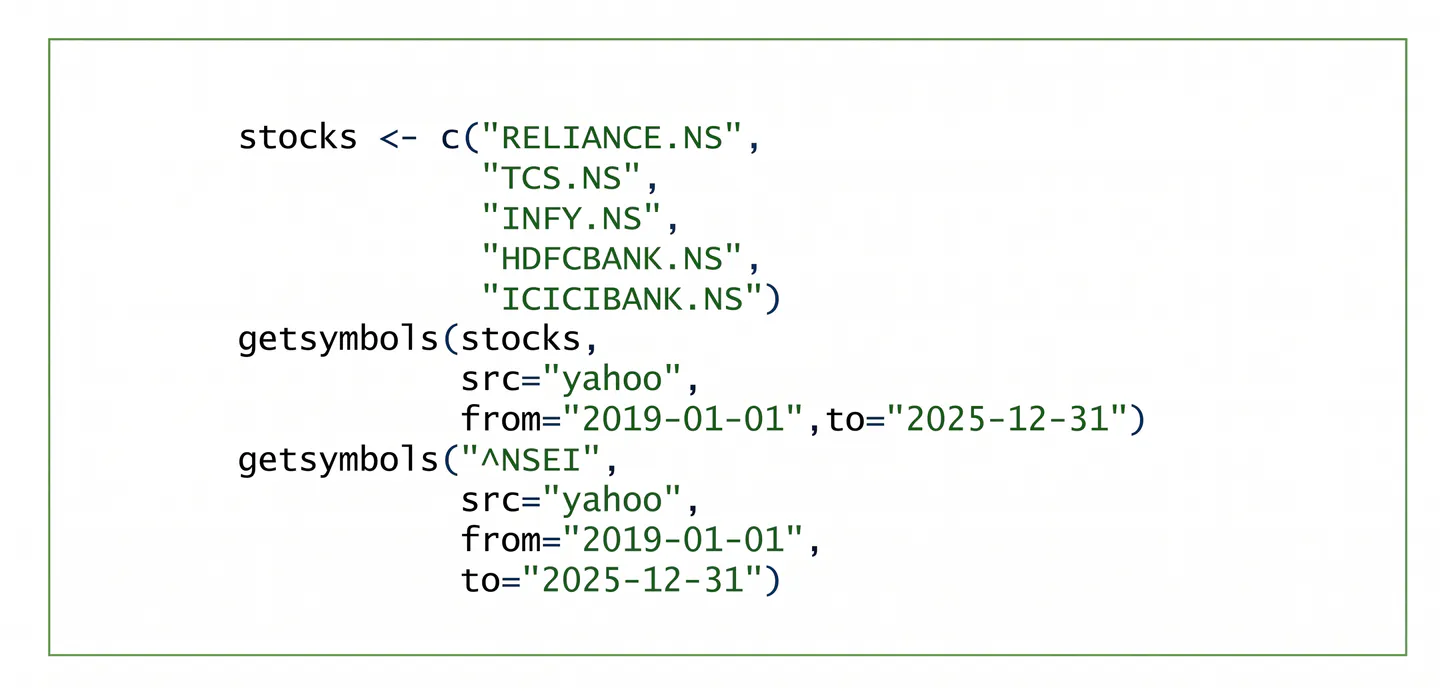
Interpretation: In the above R code (Figure 2), it is evident that the acquisition data set is acquired in first place. Here the ‘stocks’ is created which stores the yahoo finance ticker symbols of selected five Indian stocks that belong to different key sectors of Indian economy; Reliance Industries Limited (RELIANCE.NS), Tata Consultancy Services (TCS.NS),Infosys Limited(INFY.NS), HDFC Bank(HDFCBANK.NS) and ICICI Bank(ICICIBANK.NS). Thereafter the historical daily stock prices data is downloaded from Yahoo finance with the help of ‘getSymbols()’ function of‘quant modpackage’. For the analysis, period from January 1, 2019 to December 31, 2025 was considered for historical analysis for five selected companies and it is ensured that historical data is sufficient to carry out the analysis. These market data consist of opens, high, low, close, adjusted close, and volume data. The historical daily prices of NIFTY 50 index(NSEI) are collected with the help of the same function to obtain its sensitivity and volatility to overall market dynamics with reference to CAPM for estimating Beta.
Fig 3: Key Risk and Return Indicators
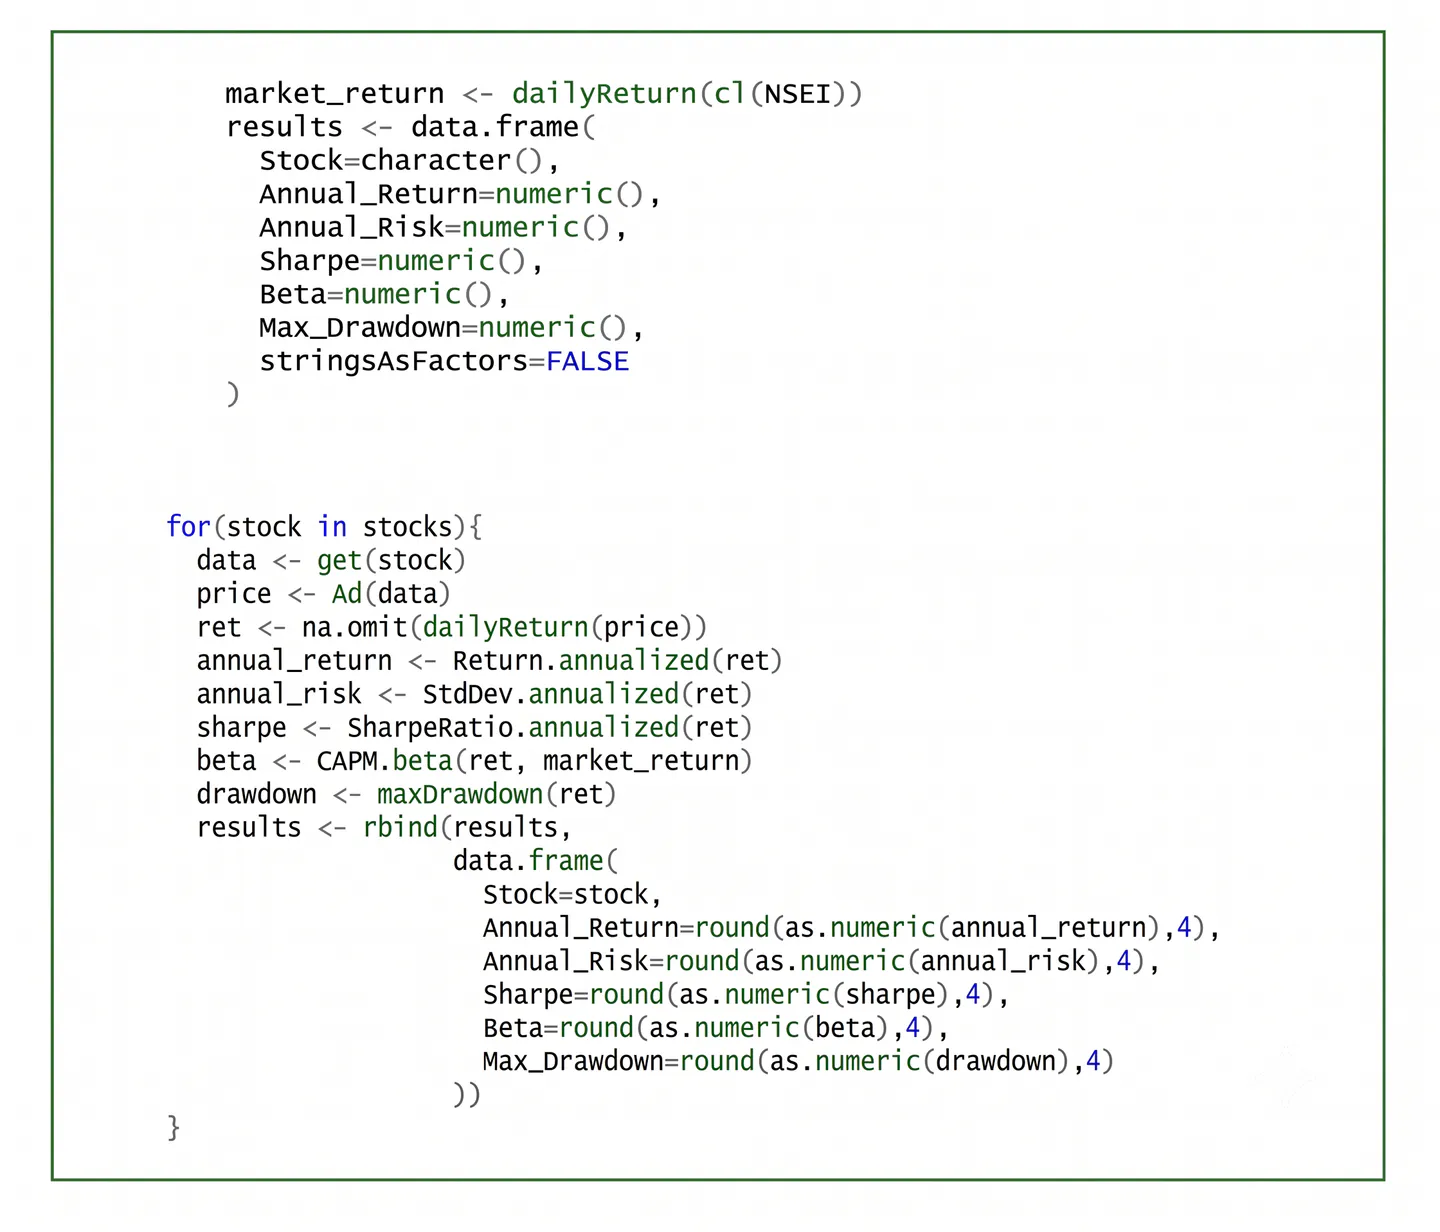
Interpretation: In the second stage, a for loop in R was used to compute essential risk and return metrics for every stock selected. It iterates through each stock in the data frame. Firstly, it fetches all available historical data for each stock using get (), extracts all Adjusted Closing prices of each stock using the Ad () function.
Following this, after eliminating missing data using na.omit(), Daily Returns were computed using the daily Return () function.
The Daily Returns were then utilized to calculate Annual Return and Annual Risk (volatility) using the Return.annualized () and StdDev.annualized() functions, respectively. Subsequently, the Sharpe Ratio was used to examine the performance relative to the risk profile. Moreover, CAPM. beta () function was utilized to compute Beta, which measured the covariance of each stock’s performance against the benchmark market return (NIFTY 50). Maximum Drawdown (the most substantial observed decline) was calculated for each stock.
Lastly, all these calculated risk and return metrics namely-Annual Return, Annual Risk, Sharpe Ratio, Beta, and Maximum Drawdown-were put into a separate R data frame called results by using the rbind()function so that a systematic approach to conduct comparative analysis, to rank, and to graphically represent using the Risk-Return Scatter Plot could be used.
Table 1: Summary of Methods
| Stock | Annual_Return | Annual_Risk | Sharpe | Beta | Max_Drawdown |
|---|---|---|---|---|---|
| RELIANCE.NS | 0.1787 | 0.2809 | 0.6361 | 1.1025 | 0.4509 |
| TCS.NS | 0.1075 | 0.2364 | 0.4550 | 0.7225 | 0.3445 |
| INFY.NS | 0.1696 | 0.2746 | 0.6176 | 0.8640 | 0.3655 |
| HDFCBANK.NS | 0.1034 | 0.2492 | 0.4151 | 1.0681 | 0.4105 |
| ICICIBANK.NS | 0.2160 | 0.2952 | 0.7317 | 1.2745 | 0.4831 |
Interpretation: A comparison of the various Indian Stocks suggests that they do not have a uniform return and risk structure. From the analysis it can be deduced that ICICI Bank performed best of the given stocks in both annual returns (21.60%) and adjusted return (Sharpe ratio=0.7317), while on the other hand had higher market risk (Beta=1.2745) and higher drawdowns (maximum drawdown=48.31%). Both Reliance Industries and Infosys were able to deliver high returns for good risk adjusted returns by performing well on Sharpe ratio, so that investors willing for growth, may choose them for their portfolio. HDFC Bank performed poorly based on risk and adjusted return and was worst in both.
The analysis shows negative relationship between drawdowns and risk as stocks with higher returns faced higher drawdowns. TCS with minimum Beta (0.7225) and lower drawdowns (34.45%) could be preferred by investors with lower risk tolerance. Overall it is concluded that a higher return generally comes along with a higher risk. Investors willing for growth might opt for stocks like Reliance industries, ICICI Bank whereas conservative investors can select stocks like Infosys or TCS for their portfolio.
Fig 4: Risk–Return Scatter Plot
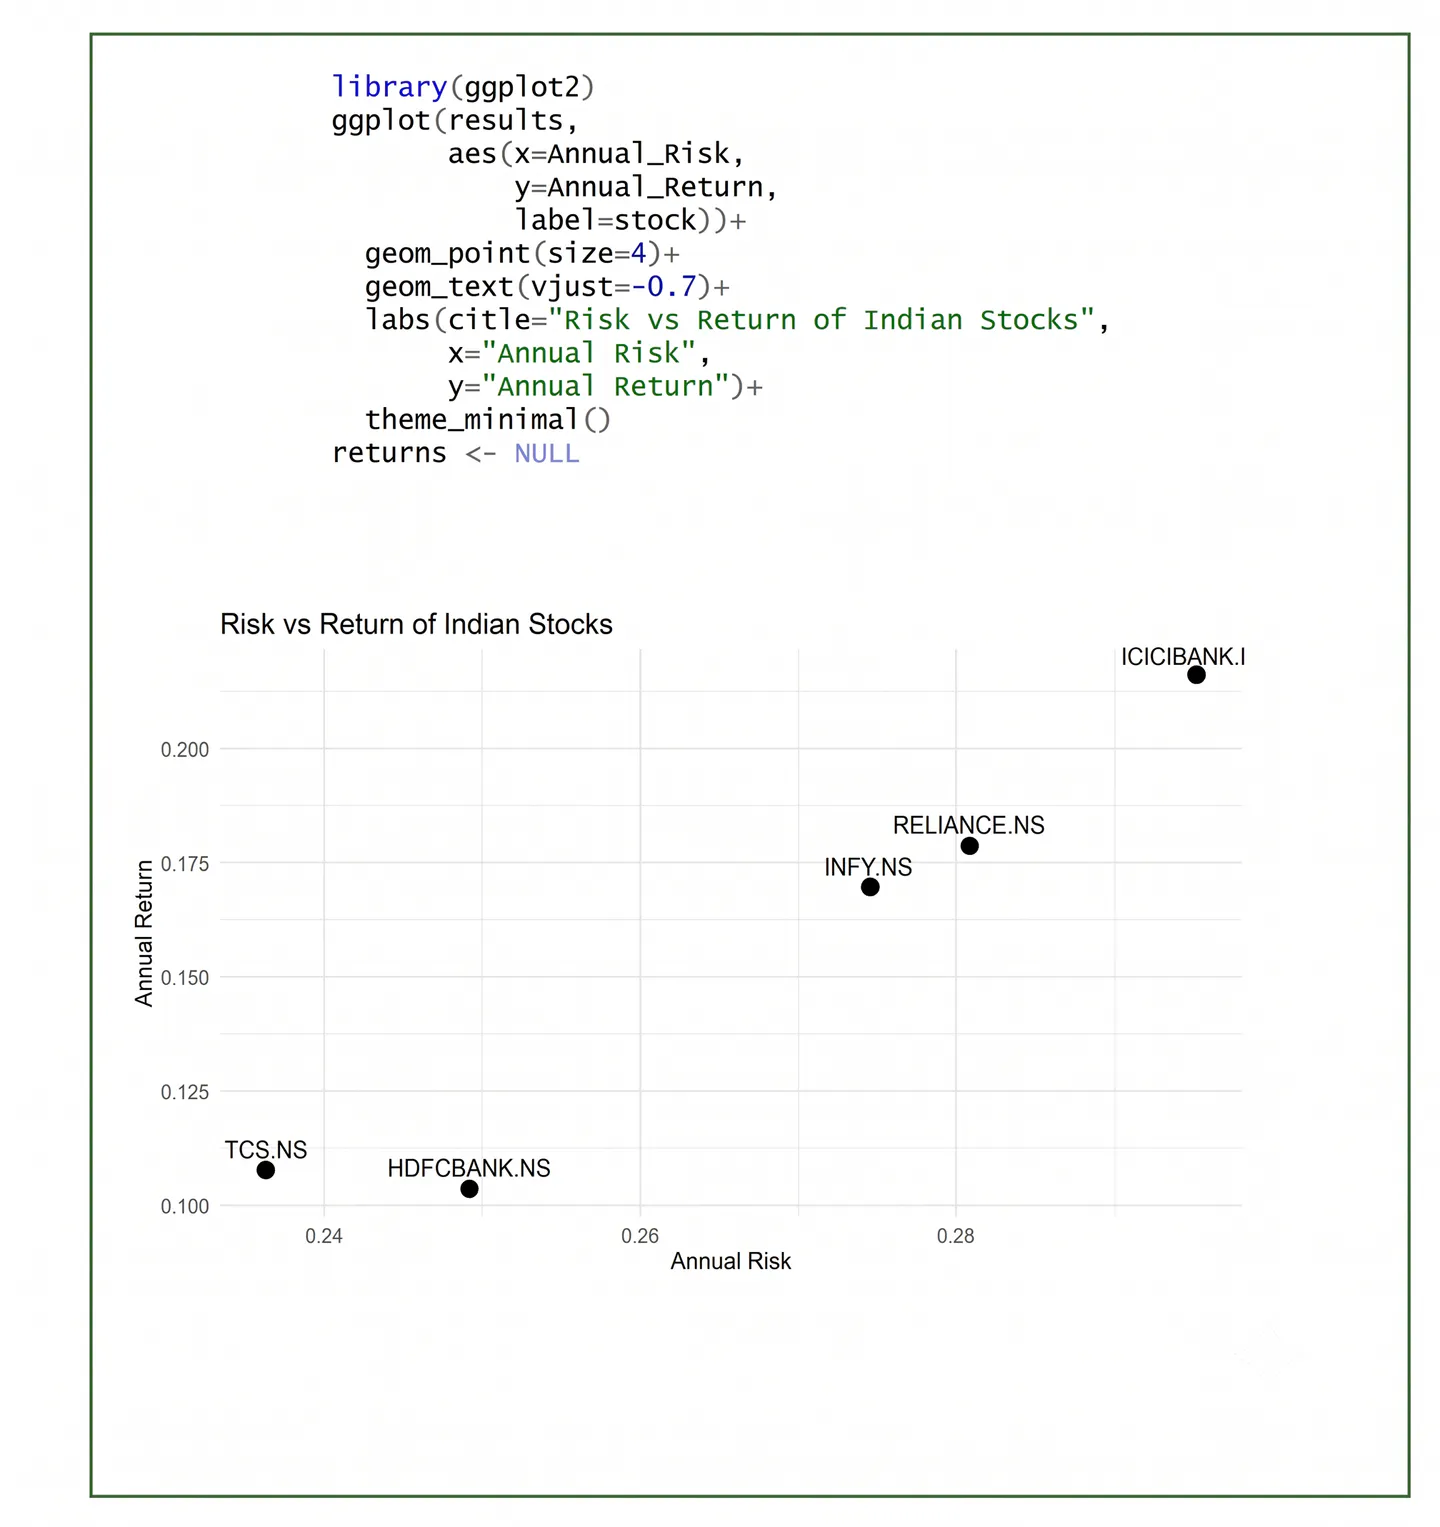
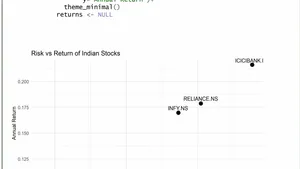
Interpretation: The Risk-Return Scatter Plot, shown in Fig 4 below plots the annualized risk (volatility) on the x-axis against the annualized return on the y-axis of the Indian stocks chosen for our study. This diagram presents a snapshot view of how well the companies performed with their respective investment opportunities during the chosen period of study. The figure shows that ICICI Bank (ICICIBANK.NS) lies in the top right portion of the diagram, implying the fact that it provided the best annualized returns of 21.60% at a high risk of 29.52% of all the stocks chosen in our study. In essence investors earned much in the form of increased returns by taking on high market risk in return.
Reliance Industries (RELIANCE.NS) and Infosys (INFY.NS) lie in the middle top region and provided reasonable good annual returns with moderate risks. Investors willing to go for growth while managing risks can consider these as potential candidates. Tata Consultancy Services (TCS.NS) and HDFC Bank (HDFCBANK.NS) lie in the lower left portion, the companies offering modest returns with least risks are better suited for the investors willing to save on capital and not so much on the returns. On a broad note, the risk-return scatter plot seems to be in harmony with the basic principles of investment, in that high returns come with high risk and vice versa.
It is apparent that among the listed companies in this analysis, ICICI bank has made it to the top while TCS makes a good position for people willing to be conservative with their money, whereas Reliance Industries and Infosys strike a balance between the two.
Conclusion
The study analysed risk and return characteristics of a few select Indian stocks with the help of secondary data and R environment. The study indicated ICICI bank to be having high annual return but at highest risk while TCS to have comparatively less risk with steady return. This also validates the core premise of risk and return trade-off in financial decision making. Using R provided an efficient way to calculate and visualize key financial measures such as annualized return, volatility, Sharpe Ratio, Beta, and Maximum drawdown. The study established that data driven analytical techniques can provide meaningful insights to evaluate a stock and provided an empirical ground for utilizing AI in investment decision and portfolio construction in the days to come.
Conflict of Interest
The authors declare no conflict of interest.
Ethical Approval
Not applicable
Data Availability
The datasets used in this study are openly available at [repository link] and the source code is available on GitHub at [GitHub link].
Funding
This work did not receive any external funding.
References
Cite this article
Related Research

Special Issue
Launch a focused special issue to highlight research, emerging trends, and expert insights in your academic field.