


Abstract
The purpose of this research is to outline a novel methodology for using microstructures to inform Thermal Protection Systems (TPS) materials research. This method involves the Micro- Computed Tomography (Micro-CT) scanning of materials, rendering, segmentation of each element class, and then quantitative analysis of the materials using their microstructures. The microstructures of TPS materials were characterized using the Lawrence Berkeley National Laboratory (LBNL)’s Beamline 8.3.2 at the Advanced Light Source (ALS). The Synchrotron-based Hard X-ray Micro- Tomography instrument allowed for non- destructive 3-Dimensional imaging of 72 different samples of TPS materials.
Understanding the behavior and composition of TPS materials before and after aerothermal testing is key to meeting the demands of new space exploration goals so materials were examined in both virgin and char states. Char materials were tested on an Oxy-Acetylene Test Bed (OTB). The Micro-CT scans were then rendered into 3D images, which were manipulated and examined for qualitative learnings about the materials. Deep learning segmentation was then used to separate and label each element within the samples. Finally, segmented samples were used to calculate various material parameters such as weight percent, volume percent, and thermal conduc- tivity. These computed values are then compared to empirical information in order to validate this novel methodology. The applications of this methodology for improving the development and iteration of novel ablative materials will be discussed
Explore Digital Article Text
I. INTRODUCTION
TPS materials are used to protect vehicles from disintegration during atmospheric reentry due to aerodynamic heating [1]. Ablative materials used in TPS cool the reentry vehicle by sending the shock layer's heat away through gases that are produced during pyrolysis. The pyrolysis reaction results in a char layer within the material that further insulates the vehicle from the free stream heat [2, 3]. The development of modern ablative materials is heavily dependent on both laboratory ground testing and material modeling as actual flight testing for materials in development is rare and expensive. For this study, low-density flexible ablators (LDFAs) and medium-density ablators were examined.
X-ray micro-computed tomography (micro-CT) has been used in medical imaging for over 50 years. It has only recently been applied to the analysis and characterization of TPS materials . The LBNL/ALS synchrotron provides a much brighter X-ray source than standalone CT scan devices can generate. This allows for faster shutter speeds and significantly lower scan times.
The tight wavelength band and high quality of the synchrotron X-rays also permits a higher resolution and cleaner sensor readouts, making this method to be even more applicable to materials science. The method works by taking a series of 2D slices by rotating the material on one axis. These slices can then be compiled through tomographic reconstruction to create a 3D image [6]. Recent work into the analysis and reconstruction of highly porous materials has also contributed to the viability of using this methodology for low-density TPS materials [7].
The microstructures of TPS materials were characterized using the Lawrence Berkeley National Laboratory's (LBNL) Beamline 8.3.2 at the Advanced Light Source (ALS) [8, 9]. Experimental methods and challenges are described.
3D images were then rendered for each sample using the image analysis software ORS Dragonfly [10]. 2D and 3D images were examined for each sample and qualitative differences were examined. Semantic segmentation was then applied to label each voxel as an element class such as fiber or void (air) [11-13]. Once the segmentation was applied to the entire sample using machine learning, the microstructures were quantified. Parameters such as weight percentages, volume percentages, and density were calculated. Finally, NASA's Porous Microstructure Analysis (PuMA) software was used to calculate thermal conductivity of the virgin and char samples [14].
II. MATERIALS AND TESTING
2.1 Material Preparation
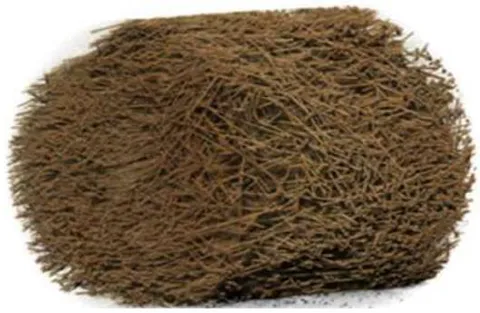
LDFAs used in this study include samples of graphite felt and quartz felt infiltrated with polysiloxane resin (UHTR) [15]. These novel Polymer Matrix Composite (PMC) ablative materials are being analyzed, tested, and developed for the next generation of re-entry mission requirements. The UHTR was infiltrated into the fiber preform (felt) and then the samples were cured and cut to size. The low-density VDG and WDF graphite felts were provided by Morgan
Advanced Materials. VDG is a high purity graphite felt that is heat treated to a minimum of C and exhibits exceptionally low thermal conductivity. WDF is a high purity graphite felt that is heat treated to a minimum of C and exhibits low thermal conductivity [16]. The low-density quartz felt was provided by Saint-Gobain. It is made from pure fused quartz fiber and contains more than 99.95% SiO [17].
The solventless polysiloxane resin UHTR 6398-S is a colorless semi-solid resin system manufactured by Techneglas LLC (Perrysburg, OH) [18, 19]. It is formulated using pro-prietary polysiloxane chemistry tailored for composites in flame shielding applications. The viscosity of UHTR 6398-S is 35,000 cPs at and the density is [20].
The medium-density materials used in this study include the glass/phenolic (G/Ph) material MXB-360. It is manufactured by Sioux Manufacturing, carbon/phenolic (C/Ph) material MX-4926N MC C/Ph manufactured by Solvay and carbon/polysiloxane (C/UHTR) material manufactured by the University of Texas at Austin (UT Austin) [15, 21].
2.2 Oxy-Acetylene Test Bed
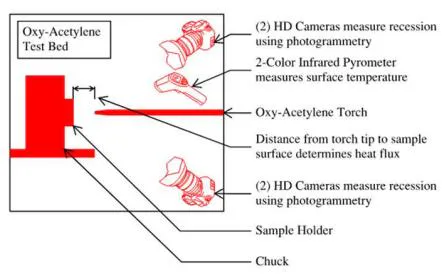
For this project, pre-and post-test materials were investigated. Differences between the virgin and char states must be quantified to understand the materials' ablation behavior and qualities more fully. The segmentation of virgin and char materials is therefore explored in the results section. The char samples included in this study were tested at various heat fluxes and exposure times on the Oxy-Acetylene Test Bed (OTB) at UT Austin, pictured in Figure 1a [22-25]. The standoff distance between the torch tip and the sample surface determined the heat flux. This was calibrated using a water-cooled Gardon heat flux transducer to measure the cold-wall heat flux [26]. The results of this calibration are shown in Figure 1b.
III. THE METHOD
3.1 Step 1: Synchrotron Micro-Computed Tomography
For this project, the microstructures of TPS materials were characterized using the LBNL's Beamline 8.3.2 at the ALS. The synchrotron-based hard X-ray micro-tomography instrument allowed for non-destructive 3-dimensional imaging of 72 different TPS materials. The tomography voxels were used to reconstruct images using the rendering software Dragonfly [27, 28]. A resolution of 3.45 voxels per micron was achieved by balancing scan length and intensity. The Beamline 8.3.2 provided 500 mA of current to the instrument for imaging. The instrument was set to take 2,625 continuous tomographic images over the course of 511.4 seconds.
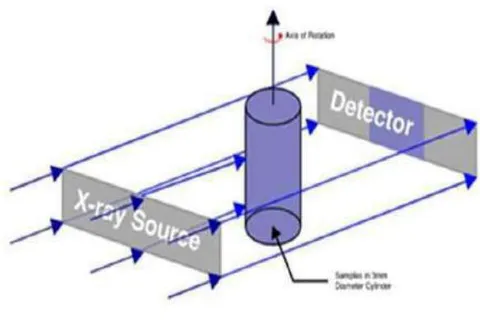
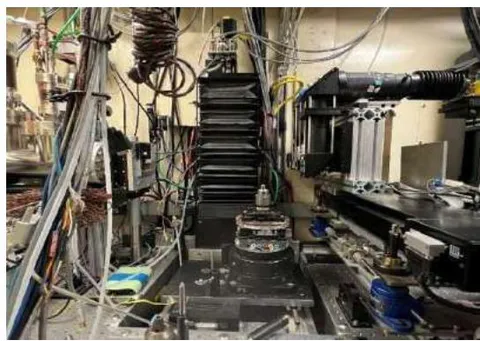
A schematic diagram and image of the synchrotron micro-CT instrument is shown in Figure 2a and Figure 2b, respectively.
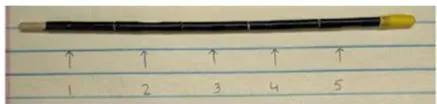
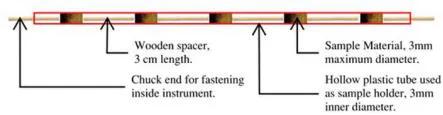
The synchrotron-based hard X-ray microtomography instrument allowed for non-destructive 3D imaging of 72 different samples of TPS materials over two visits in June and October of 2022. Small samples of each TPS material of interest were collected and inserted into small diameter plastic tubes with wooden spacers to separate materials, see Figure 3. A challenge associated with this method is the preservation of low-density samples' original density when put into the sample holder and avoiding crushing or altering the sample configuration.
3.2 Step 2: Image Rendering and Qualitative Comparison
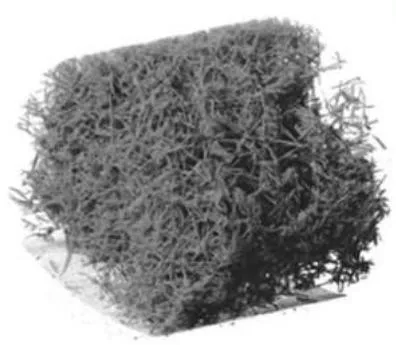
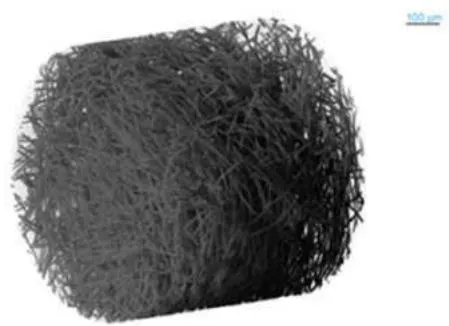
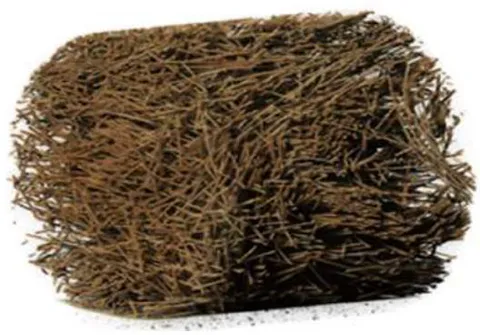
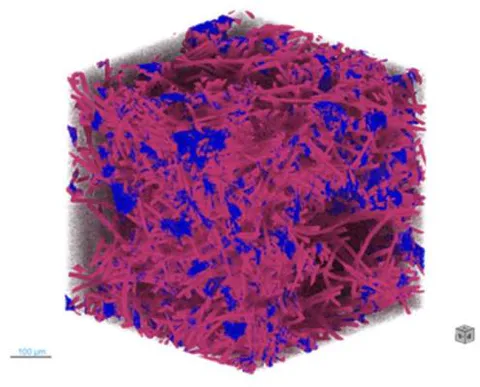
The synchrotron scan data was then loaded into ORS Dragonfly and rendered into 3D images. A selection of the more morphologically interesting samples are shown in Figure 4, Figure 5, and Figure 6. Colors were assigned for contrast and the void (air) was removed using the Otsu method in order to make the images more readable, see Figure 4c, Figure 5, and Figure 6. [29].
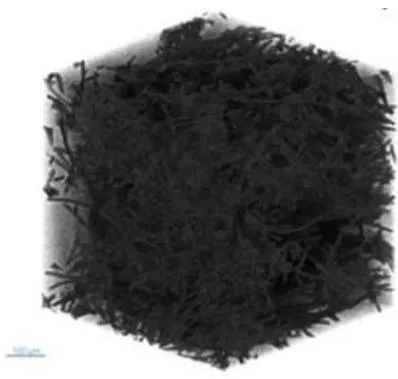
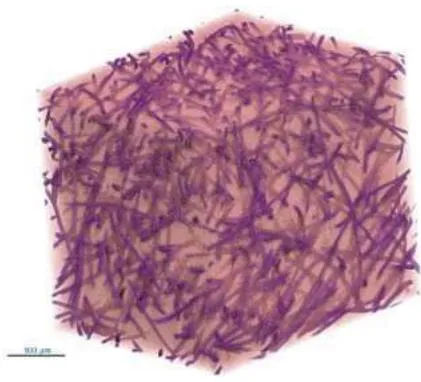
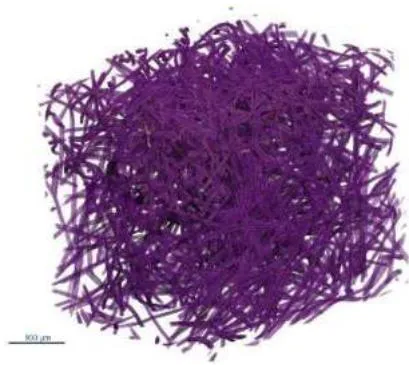
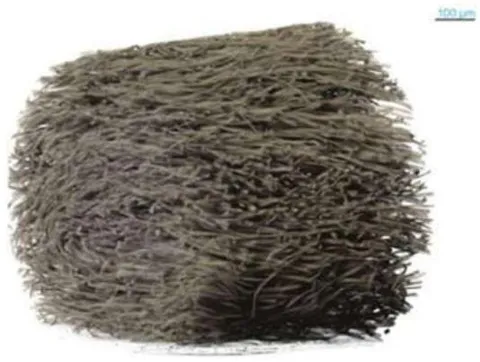
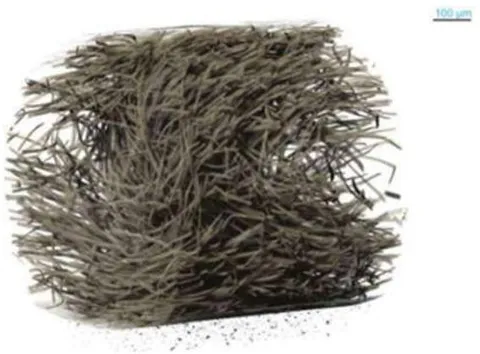
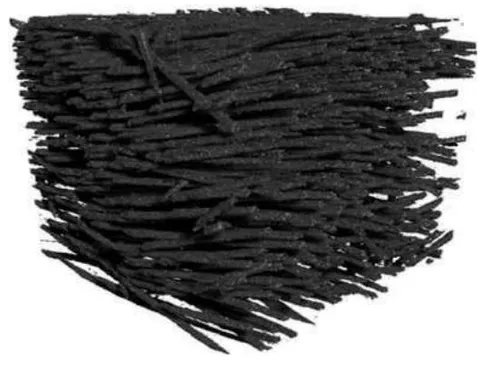
Preforms are pictured below in Figure 5, and Figure 6. These are graphite and quartz felts prior to infiltration with resin. Differences in relative fiber size and shape are clearly visible. The density difference between the low-density and high-density quartz preforms in Figure 6 is also visible to the human eye.
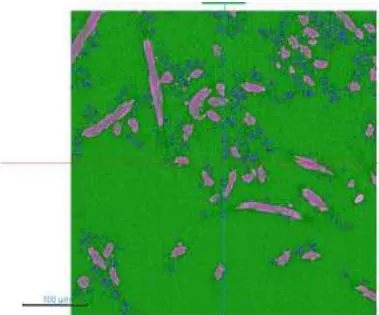
Segmentation of each sample is key to further characterization and analysis. After comparison between gray scale and semantic segmentation methods, it was found that semantic segmentation was more accurate . Rather than dealing with hand painting over 2,000 slices for the semantic segmentation, it was decided to use the machine learning capabilities of Dragonfly to segment the samples . The images were cropped to a size of 750 voxels or around 0.5 mm to lower computation time. They were cropped from 750 to 1500 pixels in the x, y, and z directions. Cropping the images also allowed for the selection of a representative area of the sample volume. 2.5D U-net deep learning models were used to segment all six samples . The patch size was 128, the batch size was 32. The model ran for 50 epochs using a categorial cross entropy loss function and the Adadelta optimization algorithm . The model was built to segment the material into three classes: void, fiber, and resin. The void is shown below in green, the fiber in pink, and the resin in blue.
The TPS materials examined in this study are the LDFAs, with density around 0.3 g/cc. They are novel ablative materials created to replace earlier generations of heat shield materials. These novel Polymer Matrix Composite (PMC) ablative materials consist of a reinforcement of graphite or quartz fibers, and polymer matrix is made of polysiloxane resin. Segmentation of these materials consists of three elements: the void (air), the fiber, and the resin.
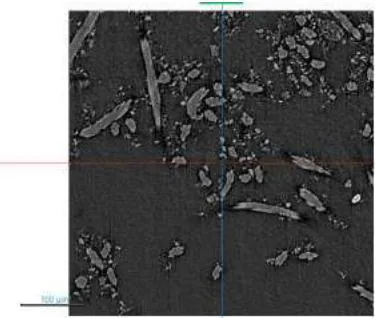
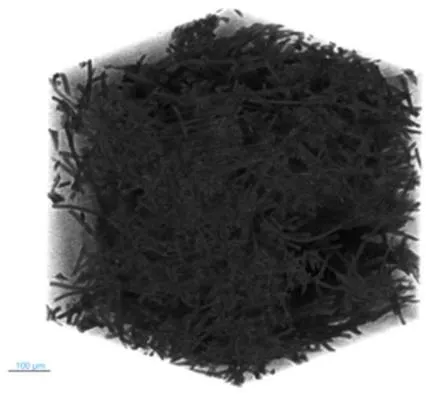
In this process, the ten training slices were hand painted so that each pixel was assigned to the classes: void, fibers, and resin. The void (green) was assigned using the lower Otsu, and any issues were then fixed by hand . The rest of the pixels were assigned to the fiber class (pink) and then the UHTR resin was selected by hand and assigned to the resin class (blue). An example of one of the ten semantically segmented 2D slices is shown in Figure 7. A training set of seven slices and validation set of three slices were prepared for the semantic segmentation. The trained model was then applied to the remaining 740 slices. The isometric view before and after the deep learning model was applied is shown in Figure 8.
3.4 Step 4: Scalar Properties Calculation
The densities of each material and the volume of the samples were used to calculate the weight percentage of each element from the microstructures . Densities of each component and of the finished materials are listed in Table 1. The weights of each element and total weight of each sample are shown in Appendix A, Table A1. The weight is calculated using the voxel count, element density, and total volume of the 750-voxel cube, which is 1.03E-05 cm . The weights of each class are calculated from the voxel count and the density of each class.
| Material | Density (g/cc) |
| VDG Graphite Felt | 0.090 |
| WDF Graphite Felt | 0.080 |
| Quartz Felt | 0.015 |
| UHTR | 1.200 |
| VDG Graphite/UHTR | 0.270 |
| WDF Graphite/UHTR | 0.300 |
| Quartz/UHTR | 0.310 |
Below, the percentage weight and volume of each element class are shown for all six LDFA samples. Figure 9a shows the weight percent. The resin is by far the largest weight contributor, which is reasonable as the density of resin is more than ten orders of magnitude larger than the fiber felts. Figure 9b shows the percent volume of each element class in the LDFA samples. The void represents an extremely small part of the weight of each sample due to the low density of air at standard temperature and pressure. However, the void makes up around 90% of the volume of the samples, which is expected with the lowdensity classification of these novel TPS materials.
{"image_source":{"path":"images/09ea686317a55b1e0c44cb15ab51b46feda638743e87d97e5112c3d8c31c7ba3.jpg"},"content":"","chart_caption":[{"type":"text","content":"(e)"}],"chart_footnote":[]} {"image_source":{"path":"images/072c58fae0073f3e391db749a07b26e856bc6205ca9207262ef2792c56f511ff.jpg"},"content":"","chart_caption":[{"type":"text","content":"(b)"},{"type":"text","content":"Figure 9: Segmentation Quantitative Comparison: (a) Weight Percent of Virgin Material; (b) Volume Percent of Virgin Material"}],"chart_footnote":[]}
3.5 Step 5: Virgin Material vs. Char Material Comparison
Virgin and char materials were compared both qualitatively and quantitatively to foster understanding of the changes to microstructures of TPS materials after aerothermal testing. The low-density preform material Polybenzimidazole (PBI) is shown in Figure 10 in virgin and char states. The density is very clearly lower for the char material and the fibers are less contiguous.
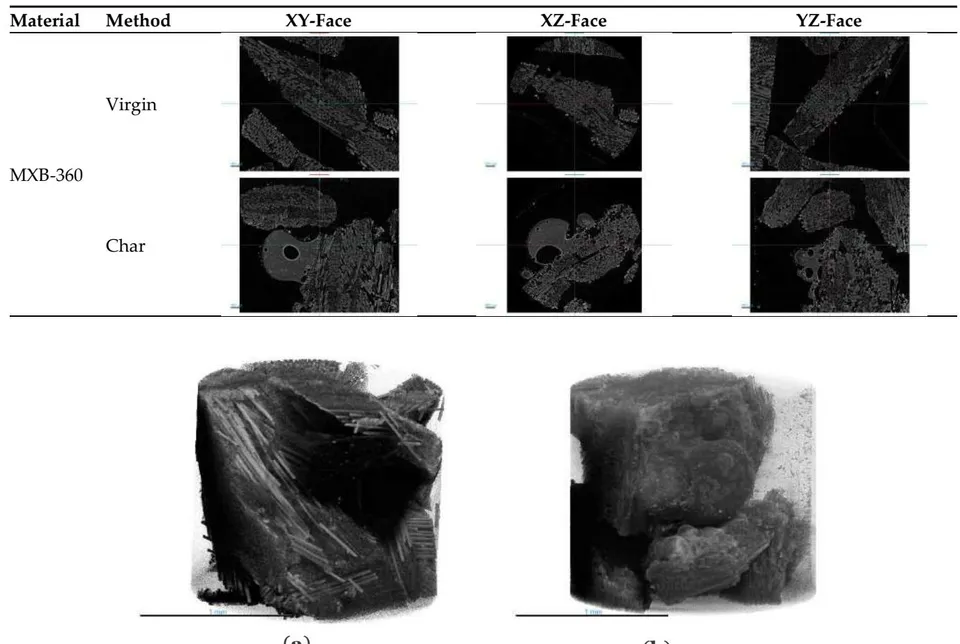
The medium-density material MXB-360, which is a glass/phenolic material produced by Sioux Manufacturing, is shown before and after testing in Table 2 and Figure 11. From other analysis including TGA and EDX, it is known that MXB-360 decomposes into carbonaceous char and silica-oxide glass during testing [25]. The glass element is incredibly clear in the microstructural images in Table 2 and Figure 11 as the rounded bubble shapes in the char material. This visual element is completely missing from the virgin material. The charred sample was exposed to for 30s on the OTB.
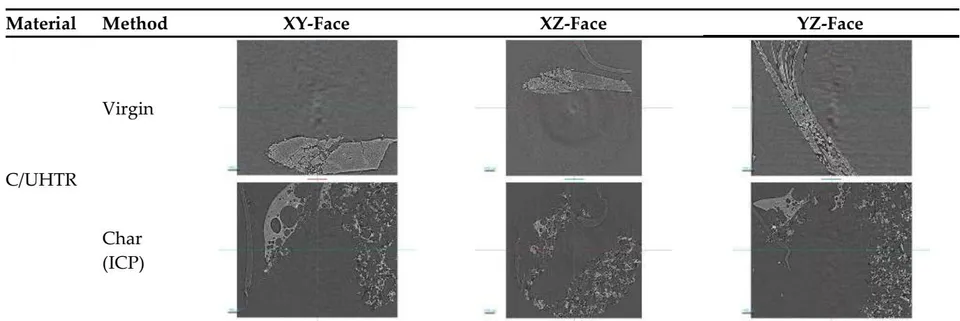
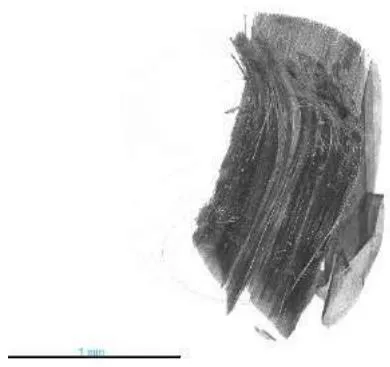
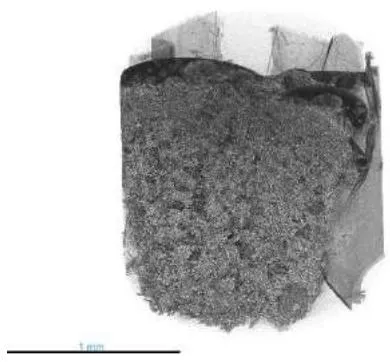
The medium-density material carbon/UHTR, is shown before and after testing in Table 3 and Figure 12. The result of vibrations can be seen in the slight ripples in the background of the virgin material images. The contiguous material seen in the background of Figure 12b is actually the sample holder and should be ignored. The charred sample was tested on the Inductively Coupled Plasma torch (ICP) [33]. The char material looks completely different structurally from the virgin material and includes several large bubbles. Additional analysis is in progress.
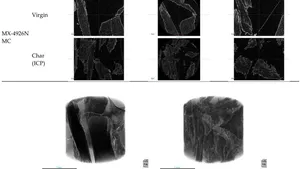
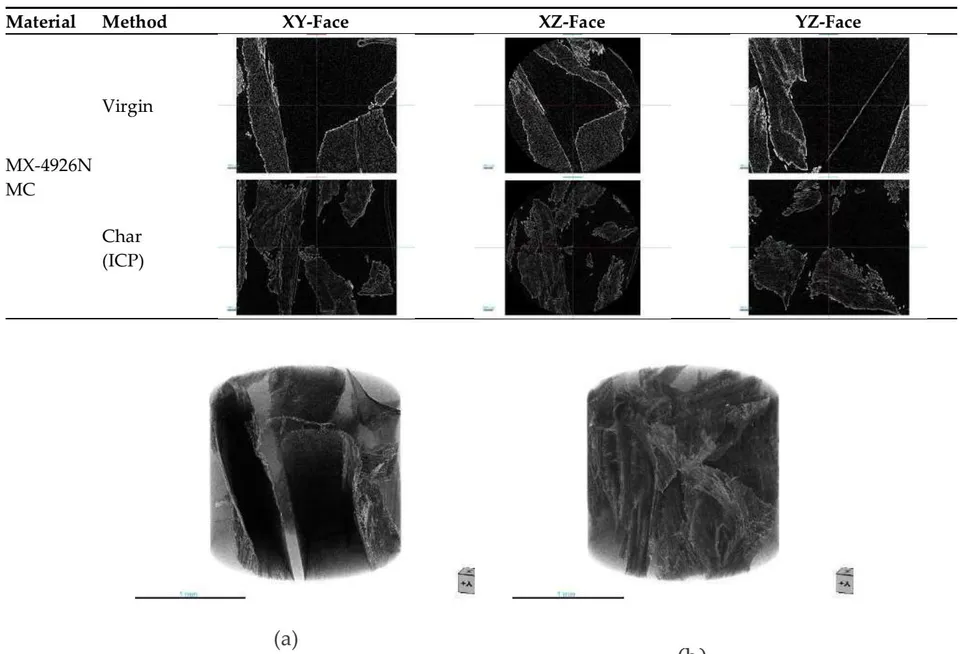
The medium-density material MX-4926 MC Carbon/Phenolic, is shown before and after testing in Table 4 and Figure 13. Sample 1-45 and 1-46. The virgin material is much more uniform than the char material. No individual fibers or frayed edges of material are visible in Figure 13a, but they are in Figure 13b. Additionally, the char material takes up more volume within the cylinder than the virgin material. From the 2D slices, it is clear that the denser the material is, the harder it is to visualize without extensive image ma-nipulation. Additional analysis is in progress.
After segmentation of the LDFAs, the virgin and char materials were compared to see if there was a consistently higher volume percentage of void in the charred materials, Figure 14. The three felt/UHTR ablators show a clear decrease in density after testing. The percentage volume of void is higher for the char than the virgin material in each case. This is also confirmation that the segmentation method has the capability to compare virgin and char materials. The table of values for each segmentation method are shown in Appendix A, Table A2.
{"image_source":{"path":"images/a008c325dc0854822239d359727079bf6e0890c6ee468b66050cc64f779d8607.jpg"},"content":"","chart_caption":[{"type":"text","content":"Figure 14: Virgin vs. Char Materials Comparison, Void Volume Percent"}],"chart_footnote":[]}
3.6 Step 6: Thermal Conductivity Calculation
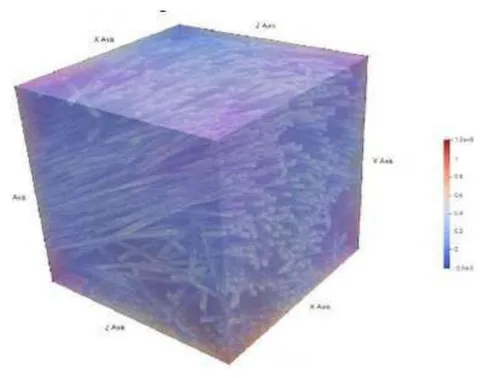
NASA's PuMA software was used to calculate the thermal conductivity of each of the samples [34, 35]. These samples were cropped to 500 voxels to fit within computational requirements. The calculation was conducted within PuMA for ORS Dragonfly. For a sanity check, PuMA was first used to confirm anisotropy of quartz preform that was visually apparent. In Figure 15a, the original render of the quartz preform is shown. Figure 15b shows the output of the PuMA thermal conductivity calculation. The results are also shown in Table 5, and confirm an anisotropic thermal conductivity that is maximized in the z-z direction, which is parallel to the fibers in Figure 15.
Thermal Conductivity(W/mK) x y z x 0.35 0.02 0.07 y 0.02 0.52 0.38 z 0.67 0.38 1.27 Thermal Conductivity(W/mK) x y z x 0.35 0.02 0.07 y 0.02 0.52 0.38 z 0.67 0.38 1.27
To use PuMA, a thermal conductivity value was assigned to each material in the segmented model. These values were mostly taken from manufacturer's data sheets and are shown in Appendix A, Table A3. Since PuMA only accepts one thermal conductivity value for each material, materials with anisotropic thermal conductivity may result in inaccurate calculations.
Additionally, this calculation is performed at standard temperature and pressure, which is currently the only option available with PuMA. Finally, PuMA is only for low-density materials. The calculation shown below is therefore for the virgin and char LDFA VDG Graphite/UHTR in Table 6 and Table 7, respectively.
| Thermal Conductivity(W/mK) | x | y | z |
| x | 0.14 | 0.00 | 0.03 |
| y | 0.00 | 0.53 | 0.02 |
| z | 0.02 | 0.13 | 0.52 |
| Thermal Conductivity(W/mK) | x | y | z |
| x | 0.17 | 0.01 | 0.26 |
| y | 0.02 | 0.41 | 0.01 |
| z | 0.04 | 0.04 | 0.09 |
The results of PuMA are also shown in pictorial form in Table 8. The thermal conductivity in each direction is more uniform for the virgin material than the char material. This is a very logical and promising result combined with the reasonable thermal conductivity values. In future, these values will be compared to experimentally measured thermal conductivity for the LDFAs.
| Material | Method | X-Applied Heat | Y-Applied Heat | Z-Applied Heat |
| VDG Graph-ite/UHTR | Virgin | |||
| Char |
3.7 Step 7: In-Situ Experiments
In the future, in-situ micro-CT scans will be taken while performing thermal and mechanical properties testing at the LBNL/ALS facility . Three sets of in-situ tests are planned. Pyrolysis in air or inert gas (argon) of neat resins and low-density flexible ablators (LDFAs) at elevated temperature around 1,000°C will be conducted to examine phase change reactions of these materials. This will provide invaluable information about the performance of TPS materials under thermal testing. Mechanical properties such as compression strength, tensile strength, and three-point bend will be examined and quantified using in-situ synchrotron scans at room temperature first using specially designed test chambers at LBNL/ALS . These mechanical properties tests will later be performed at elevated temperatures up to 1,500°C.
The above three micro-CT experiments will combine a novel experimental and modeling approach to study LDFAs. Development of this methodology will enable the design, fabrication, and characterization of the next generation of high-performance TPS materials including high-density TPS materials, such as carbon/carbon composites and ceramic matrix composites.
V. CONCLUSIONS
The goal of this novel methodology is to discover and quantify connections between the microstructures and the ablation performance of these TPS materials. Following these systematic steps allows for the full characterization of a material's microstructures. In the future, each of these parameters will be linked back to and validated by an experimental measurement. Comparing similar ablative materials to each other allows for better understanding of how microstructures can contribute to differences in ablation performance. This allows researchers to link processing-properties-performance relationships of TPS materials. In the future, this methodology will be utilized for generative design of novel TPS materials.
VI. FUTURE WORK
Mechanical properties of the ablative materials will be investigated as a part of this methodology. For example, char strength is an important factor in ablative performance. A mechanical char strength tester has been created and used on several materials . These results will be compared to a calculated char strength from material microstructures transferred into an FEA program. Material response (MR) modeling is also another important part of this integrated research, MR modeling will enable our research group to predict the heat transfer and ablation performance of these novel TPS materials .
Selected ablators will be tested and evaluated using an inductively coupled plasma (ICP), LHMEL, and HYMETS arc jet test facilities . The experimental data obtained from these test facilities will be used to validate our microstructures-based model and material response simulation.
High-density TPS materials will also be investigated using this approach including Ceramic Matrix Composites (CMCs) and Carbon/Carbon Composites (CCCs) for hypersonic TPS applications.
Other methods of preserving sample integrity when creating synchrotron samples will also be explored. This could include epoxy to encapsulate samples before cutting, and coring full length samples .
Funding: This research was partially funded by KAI, LLC, Austin, Texas, USA.
ACKNOWLEDGMENTS
This research used resources of the Advanced Light Source, which is a DOE Office of Science User Facility under contract no. DE-ACo2-05CH11231. Research was supported by Dr. Dula Parkinson from the Advanced Light Source and
Source and used the Beamline 8.3.2 Synchrotron Micro-Computed Tomography.
Conflicts of Interest: The authors declare no conflict of interest.
Appendix A
Table A1: Weight of Each Element and Total for the Virgin Materials, Calculated and Experimental
| Material | Method | Void Weight (μg) | Fiber Weight (μg) | Resin Weight (μg) | Total Weight (μg) |
| Sample 1-12 Virgin VDG Graphite/UHTR | Experimental Value | - | - | - | 135.00 |
| Segmented with Semantic Segmentation | 0.58 | 3.45 | 13.46 | 17.50 | |
| Sample 2-24 Virgin WDF Graphite/UHTR | Experimental Value | - | - | - | 150.00 |
| Segmented with Semantic Segmentation | 0.58 | 2.48 | 26.56 | 29.62 | |
| Sample 1-16 Virgin Quartz/UHTR | Experimental Value | - | - | - | 155.00 |
| Segmented with Semantic Segmentation | 0.58 | 2.89 | 25.00 | 28.47 |
Table A2: Void Percent Volume for All Six Samples, Both Segmentation Methods
| Material | Method | Void Volume (%) |
| Sample 1-12 Virgin VDG Graphite/UHTR | Segmented with Semantic Segmentation | 90.09 |
| Sample 1-23 Char VDG Graphite/UHTR | Segmented with Semantic Segmentation | 91.24 |
| Sample 2-24 Virgin WDF Graphite/UHTR | Segmented with Semantic Segmentation | 90.05 |
| Sample 1-25 Char WDF Graphite/UHTR | Segmented with Semantic Segmentation | 96.69 |
| Sample 1-16 Virgin Quartz/UHTR | Segmented with Semantic Segmentation | 89.42 |
| Sample 1-27 Char Quartz/UHTR | Segmented with Semantic Segmentation | 94.04 |
Table A3: Density of Each Element in the LDFA Materials
| Material | Thermal Conductivity at 20°C (W/mK) |
| VDG Graphite Felt | 0.090 [16] |
| WDF Graphite Felt | 0.080 [16] |
| Quartz Felt | 0.035 [17] |
| UHTR | 0.344* |
| Air/Void | 0.028 [43] |
Conflict of Interest
The authors declare no conflict of interest.
Ethical Approval
Not applicable
Data Availability
The datasets used in this study are openly available at [repository link] and the source code is available on GitHub at [GitHub link].
Funding
This work did not receive any external funding.
References
Cite this article
Related Research


Special Issue
Launch a focused special issue to highlight research, emerging trends, and expert insights in your academic field.