




IntelliPaper
Abstract
The objective of this work was to evaluate the effect of diets with different levels of Acacia mearnsii tannins (0, 0.5, 1.0 and 1.5% of dietary DM) in two distinct cattle genotype (Holstein and Nellore) on the greenhouse gas (GHG) emissions of cattle manure analyzed in anaerobic digestion. Batch type experimental digesters were used, located inside a climatic chamber (30 to 35ºC). The use of Acacia mearnsii extract up to 1.5% of the DM of the cattle diet did not promote changes in the efficiency of removal of nutrients from the manure, or in the production of biogas and its compounds (CH4, CO2 and N2O). The speeds of CH4 and CO2 production were more accentuated for Holstein, which can be a positive factor for reducing Residence Time. Therefore, tannins can be used as additives to modify rumen fermentation, without having any effect on the anaerobic digestion process of cattle manure.
Explore Digital Article Text
I. INTRODUCTION
The livestock sector plays a vital role in climate change, representing 14.5% of human-induced greenhouse gas (GHG) emissions, according to Gerber et al. (2013). The majority of these emissions come from enteric fermentation and cultivated soils. The and emissions are an environmental concern because their global warming potentials are 27.2 and 273 more potent than , respectively (Pörtner et al., 2023). Cattle manure, when stored, can represent 7 to 27% of the total emission by ruminants (Hindrinchsen et al., 2006).
Cattle manure is a suitable substrate for developing anaerobic digestion, as it contains carbohydrates, proteins, and fat (Ahring et al., 2001). According to Moller et al. (2014), the effects of changes in livestock diets on biogas and GHG emissions need to be further studied, as many factors can change the characteristics of manure. As an alternative to the use of drugs to modify rumen fermentation and reduce emissions, researchers have intensified the study of natural food additives for ruminants, such as tannins (Alves et al., 2017 and Perna Junior et al., 2022). These compounds are classified into hydrolysable (HT) and condensed (CT) tannins, both with effects depending on their plant source, concentration, and other factors such as the animal species, the physiological state, and the composition of the animal diet (Makkar, 2003a). According to Hao et al. (2011), CT in ruminant diets reduces the degradation of rumen N, but there is little research on how these phenolic compounds alter the decomposition of manure. Furthermore, Hegarty (2004), in his review of different genotypes and their impact on the digestive tract of ruminants, states that there are significant differences in digestive function between species, breeds and within breeds. Thus, there is a need to investigate how the use of tannins in the diet of different cattle influences the composition of manure and biogas production by anaerobic digestion.
Therefore, it is expected that the addition of tannins to the cattle diet will increase the N content of the manure and result in higher emissions, as it enhances the anaerobic digestion process. The objective of the present study was to evaluate the nutrient removal efficiency and biogas production ( , and ) during the anaerobic digestion of manure from two different groups of cattle fed with different levels of tannins from Acacia mearnsii.
II. MATERIAL AND METHODS
The trial was conducted in Pirassununga, state of São Paulo, southeastern Brazil (21°59'45"S, 47°25'37"W, and 625 m above sea level). All procedures involving animal care were conducted following the Institutional Animal Care and Use Committee Guidelines (protocol n° 3222290414).
The experiment was carried out in two phases: (1) the feeding phase and (2) the anaerobic digestion phase. In the first phase (the feeding phase), eight non-pregnant and non-lactating cows were used, four Holstein (Bos taurus) with a mean live weight of 775 (± 55) kg and four Nellore (Bos indicus) with an average live weight of 434 (± 47) kg. The choice of these two genotypes was because they are expressive representatives of the world's dairy production systems (Holstein genotype) and Brazil's large beef cattle sector (Nellore genotype). The cows were housed in individual stalls with a sand bed, feed bunker, drinker, and fans to ensure the animals' thermal comfort. Feed was offered twice daily for ad libitum intake (at least 5% refusal) at 8 am and 4 pm. It contained a mixed ration with a 50:50 roughage to concentrate ratio (DM-basis). The composition of the diet is shown in Table 1. The tannin doses (0, 0.5, 1.0 and 1.5%) were adjusted daily depending on DM intake and manually mixed with the total diet before each feeding. A commercial extract (Natur N, Seta®, Brazil) obtained from Acacia bark (Acacia mearnsii) was used as the source of tannins. The concentration of total phenols (84.4%) was determined by the Folin-Ciocalteau method (Makkar, 2003b), and the total tannins (82.3% equivalent in tannic acid) were estimated by the difference of the total phenol concentration before and after treatment with insoluble polyvinylpolypyrrolidone (Makkar et al., 1993). The CT concentration (32.3% equivalent to leucocyanidin) was determined by the HCl-butanol method, according to Makkar, 2003b. To avoid the negative effect of tannins on dry matter intake, low to moderate levels were used in this study, since Grainger et al. (2009) observed reduction in feed intake for dairy cow using only 0.9% of diet DM.
Table 1: Ingredient proportion and chemical composition of the experimental diet.
| Item | Diet |
| Ingredient,% of dry matter (DM) | |
| Corn silage | 50.0 |
| Dry-ground corn grain | 32.8 |
| Soybean meal | 12.7 |
| Sodium chloride | 0.5 |
| Vitamin and mineral premixa | 2.0 |
| Tanninsb | * |
| Caolimc | ** |
| Chemical composition,% of DM | |
| DM (%) | 61.1 |
| Ash | 6.6 |
| Ether extract | 3.2 |
| Crude protein | 13.1 |
| Neutral detergent fiber | 34.2 |
| Acid detergent fiber | 22.2 |
| Nonfiber carbohydrates | 43.0 |
| Total digestible nutrientsd | 67.3 |
For the feeding and collecting feces, the animals were allocated in a duplicated Latin square 4x4 design, in a 2x4 factorial arrangement, with two distinct groups of animals and four levels of inclusion of tannins in the diet. Each experimental period had 22 days, the first 17 days for adaptation to the diet and the last five days for collection of feces, which were collected manually via rectum, at 8-h and 16-h, and frozen at C forming a single sample composed of animals, in each period. Urine samples were obtained from all cows on the 22nd day of each experimental period, every 6 hours, during urination stimulated by massage on the vulva, and then stored at C in a single bottle, forming a sample composed of 24 hours.
In the second phase (the anaerobic digestion phase), the samples composed of feces and urine collected and frozen during the feeding phase (1) were diluted in water, adopting the total solids (TS) content of 6%. A theoretical manure ratio of 75:25 was used for the mixture of feces and urine, respectively. The substrate composition was 37.5% manure, 10% inoculum, and 52.5% water. Sludge from the manure treatment pond with the following characteristics was used as inoculum: pH = 6.2; TS = 4.61%; VS/TS = 60.30%. The digesters were organized in a completely randomized design, in a 2x4 arrangement, with two cattle genotypes (Holstein and Nellore) and four tannins level in the diet (0, 0.5, 1.0 and 1.5% of DM), with four repetitions per treatment, totaling 32 experimental units. The feces were loaded into batch-type digesters (Figure 1) consisting of a 75 mm reactor, a 100 mm gasometer, and a 150 mm digester made with three PVC pipes, adapted from Sunada et al. (2018). Anaerobic digestion was developed in mesophilic conditions (30 to 35°C), ideal for digestion kinetics (Metcalf and Eddy, 2014), placing the digesters inside a climatic chamber with an electrical resistance heating system and a digital temperature controller, for 175 days. The treatments and respective characterization of the substrates are shown in Table 2.
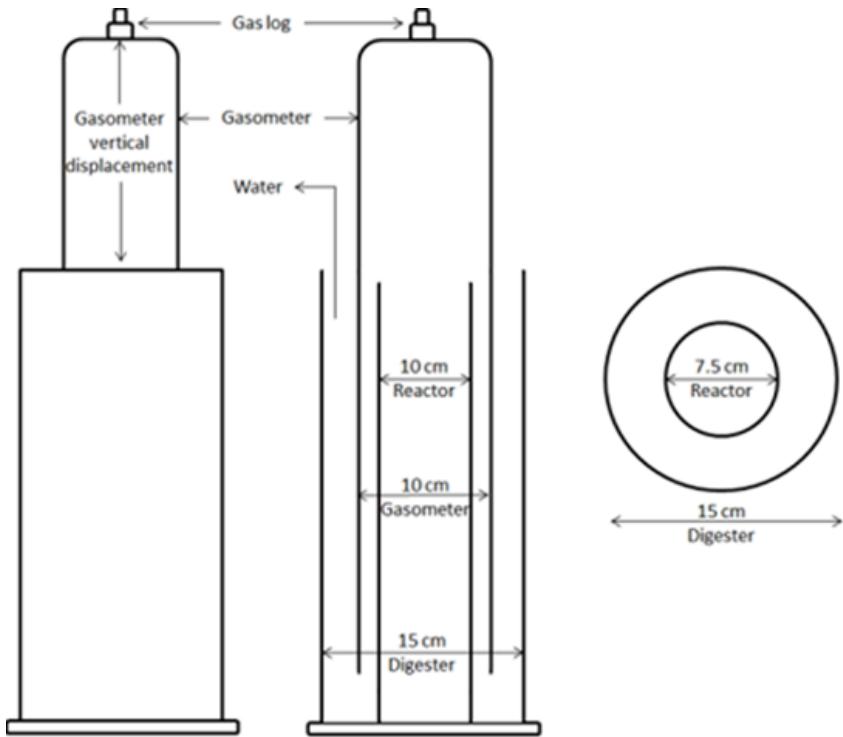 Figure 1: Anaerobic batch-type digester shown in front, side, and top views.
Biogas volume was determined by the displacement of the gasometer and its internal cross-sectional area, and corrected to 1 atm and 20°C. The frequency of biogas measurement was conducted following gasometer capacity. Every time the biogas volume was measured, biogas samples were collected with a syringe connected to the gas log on top of the gasometer. The , and concentrations were determined by gas chromatography (Trace 1300, Thermo Fisher Scientific®, Rodano, Milan, Italy), according to Kaminski et al. (2003).
Specific gas yield (per gram of VS fed or destroyed) was calculated by dividing the total gas production (L) by amount of volatile solids fed (before anaerobic digestion), or destroyed (difference between VS fed and eliminated). The test was finished when biogas production ceased. The nutrients fed and eliminated were weighed to calculate the DM content (grams).
The nutrients ingested and digested were calculated according to the following equation (Nogueira et al., 2023):
Nutrient removals were calculated according to this equation:
Nutrient removal,
Individual feed and feces samples were collected before and after anaerobic digestion. The samples were dried in a forced-air oven, at C for 48 hours, ground to 1.0 mm and analyzed. DM content was determined by method 930.15 of the Association of Official Analytical Chemists (AOAC) (Cunniff, 1995) in the forced-air oven at C for 2 hours, followed by cold weighing. Nitrogen content was obtained by the micro Kjeldahl method, being multiplied by 6.25 to calculate crude protein (Cunniff, 1995). Neutral detergent fiber, acid detergent fiber, and lignin were determined by the methods described in the literature (Van Soest et al., 1991), using the Filter Bag and heat-stable -amylase as in method 973.18 (Cunniff, 1995). The levels of total solid and volatile solids were measured according to the American Public Health Association (APHA) (Rice et al., 2012). The hydrogen ion potential (pH) was measured by a portable pH meter (Hanna Instruments , HI 8424, Italy).
Table 2: Characteristics of the substrates and removal efficiency of nutrients in anaerobic batch-type digesters supplied with manure of Nellore and Holstein cattle fed Acacia mearnsii tannins SEM: Standard error of the mean; G*TL: Interaction between Genotype and Tannin Level; TS: Total solids; SV: Volatile solids; N: Nitrogen; NDF: Neutral detergent Fiber; ADF: Acid detergent fiber.
| Variables | Genotype (G) | Tannin Level (TL) | Probability | |||||||
| Holstein | Nellore | 0% | 0.5% | 1.0% | 1.5% | SEM | G | TL | G*TL | |
| Substrates (g kg-1) | ||||||||||
| TS | 45.5 | 49.3 | 49.3 | 47.6 | 47.5 | 45.2 | - | - | - | - |
| VS | 36.8 | 39.4 | 38.6 | 37.7 | 38.5 | 37.7 | - | - | - | - |
| N (TS) | 40.1 | 37.7 | 35.7 | 37.7 | 40.4 | 41.9 | - | - | - | - |
| NDF (TS) | 558.2 | 474.2 | 465.8 | 496.1 | 525.0 | 577.8 | - | - | - | - |
| ADF (TS) | 368.2 | 346.3 | 301.4 | 356.8 | 373.5 | 397.2 | - | - | - | - |
| Eliminated nutrients | ||||||||||
| TS (g) | 71.40 | 79.75 | 78.65 | 77.91 | 76.91 | 75.03 | 2.07 | 0.003 | ns | ns |
| VS (g) | 51.55 | 56.72 | 54.85 | 54.92 | 53.97 | 55.81 | 1.73 | 0.005 | ns | ns |
| N (g) | 2.29 | 2.48 | 2.24 | 2.33 | 2.42 | 2.74 | 0.06 | 0.003 | $0.005^L$ | ns |
| NDF (g) | 27.72 | 30.59 | 28.15 | 29.39 | 29.96 | 31.29 | 1.22 | ns | ns | ns |
| ADF (g) | 24.74 | 26.95 | 24.19 | 27.10 | 28.64 | 29.47 | 0.90 | 0.074 | $0.031^L$ | ns |
| pH | 7.16 | 7.27 | 7.28 | 7.24 | 7.20 | 7.15 | 0.02 | 0.006 | $0.014^L$ | ns |
| Nutrient removal efficiency | ||||||||||
| TS (%) | 21.62 | 19.05 | 20.19 | 18.14 | 19.02 | 18.90 | 0.95 | ns | ns | ns |
| VS (%) | 29.99 | 27.07 | 28.90 | 27.20 | 29.86 | 25.85 | 1.06 | ns | ns | ns |
| N (%) | 38.22 | 30.82 | 36.50 | 36.61 | 35.47 | 29.42 | 1.72 | 0.029 | ns | ns |
| NDF (%) | 44.44 | 32.08 | 37.94 | 36.32 | 39.36 | 38.56 | 2.73 | 0.028 | ns | ns |
| ADF (%) | 32.63 | 20.64 | 20.95 | 20.90 | 22.28 | 21.75 | 2.67 | 0.003 | ns | ns |
Data were statistically analyzed using the SAS 9.3 (SAS Institute Inc., Cary, NC, USA). Before the actual analysis, the data were analyzed for the presence of disparate information ("outliers") and normality of residuals (Shapiro-Wilk). Individual observation was considered an outlier when standard deviations to mean were more than +3 or less than -3. When the normality assumption was not accepted, the logarithmic transformation or the square root was required. The following statistical model was used:
Where Yijkl is the observation, is the general mean, Gi is the genotype effect (fixed effect), Lj is the tannin level effect (fixed effect), Gi* Lj is the interaction effect of genotype and tannin level, Pk is the period effect (random effect), Al(Gi) is the animal within genotype effect (random effect) eijkl is the residual error.
The data were subjected to analysis of variance (PROC MIXED), and the level effect was evaluated by the use of orthogonal polynomials, separating the effects in linear, quadratic and deviation from the quadratic. The 0.05 significance level was adopted.
Methane yield curve parameters were estimated from each digester yield using the Gompertz model (Kafle and Chen, 2016) according to the equation:
Where is the methane yield at anaerobic digestion days, A is the asymptotic methane yield, B is the interaction constant, k is the yield constant rate, and exp is the base of natural logarithmic (2.7183).
Where is the point of inflection, ln is the logarithmic, B is the interaction constant, and k is the yield constant rate.
Where is the methane yield at inflection point, A is the asymptotic methane yield, and exp is the base of natural logarithmic (2.7183).
III. RESULTS AND DISCUSSION
The use of anaerobic digesters under controlled temperature conditions was a strategy of the present experiment to promote the maximum activity of the different microbial groups that convert the complex organic substrate into biogas through the anaerobic food chain, as the vast majority of anaerobic microorganisms they develop better at temperatures ranging between C and C (Gavala et al., 2003). According to Dohányos and Zábranská (2001), the efficiency of removal of organic matter (represented by the VS) is generally between 25-50% in reactors operated at mesophilic temperatures, in agreement with the values of approximately 30% found in the present experiment.
The pH, after the digestion process, was 1.54% higher for the Nellore than for the Holstein. Additionally, with increasing levels of tannins in the diet, there was a linear reduction in the pH of the degraded manure (Table 2). The different levels of tannins in the diet did not cause significant differences in nutrient removal efficiency. However, Holstein manure showed higher removal efficiency for N, NDF and ADF compared to Nellore (Table 2).
Hegarty (2004), in his review of the different genotypes and their impact on the digestive tract function of ruminants, states that there are significant differences in digestive function between species, breeds, and within breeds. Additionally, it is known that there are differences between zebu and taurine cattle regarding nutrient use and performance (Frisch and Vercoe, 1977). In the present experiment, it was observed that Nellore cattle (zebu) possibly had a better use of nutrients in the diet and, consequently, the generation of manure with fewer nutrients, which justifies having a worse efficiency in removing nutrients in the anaerobic digestion process, when compared to Holstein (taurine) manure (Table 2).
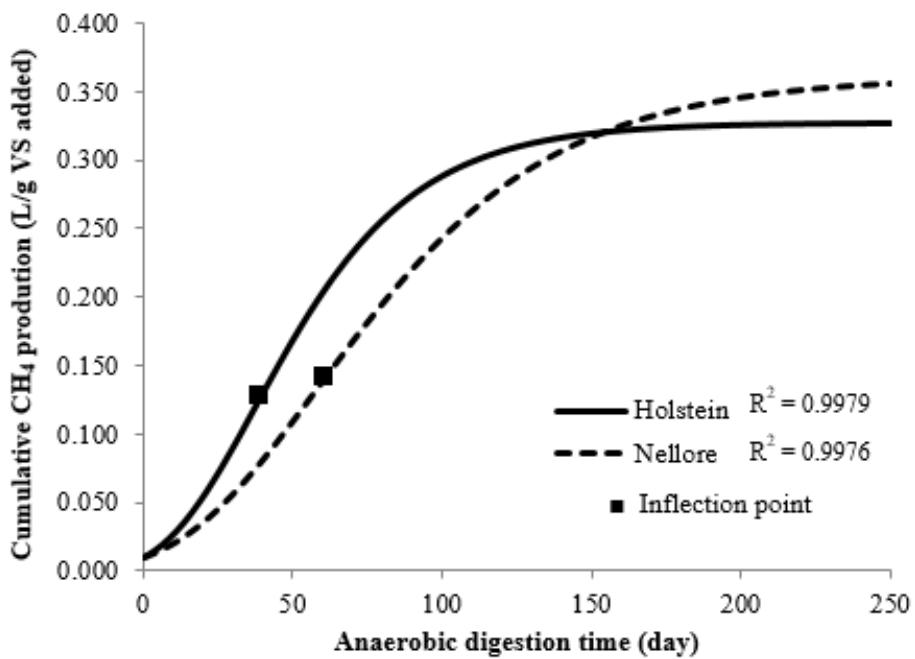
Cumulative production was estimated by the Gompertz curve (Figure 2). The higher indicates that the Gompertz model was able to explain the variability in the response data. The Gompertz curve is an excellent modeling tool for predicting biogas yield. Kafle and Chen (2016) reported that Gompertz model was the better model to predict yield compared to than others models. Holstein manure showed a higher growth rate (k) for production (P\<0.05) than Nellore cattle. Additionally, they had a shorter time to reach the inflection point (t). The inflection point (t) for production was also lower (P\<0.05). The proportion of in percentage was linearly reduced (P\<0.05) with increasing levels of tannins in the diet (Table 3).
{"image_source":{"path":"images/38a54fdcf76ccad6d8090fa2bed360e4e0bfb72ccf05ea0d9635af6bad5a1d2c.jpg"},"content":"","chart_caption":[{"type":"text","content":"Figure 2: Cumulative "},{"type":"equationinline","content":"CH\{4}"},{"type":"text","content":" production, adjusted by the Gompertz model in anaerobic batch-type digesters supplied with manure of Nellore and Holstein cattle fed Acacia mearnsii tannins. The inflection point represents the day when the maximum point of "},{"type":"equationinline","content":"CH\{4}"},{"type":"text","content":" production occurred."}],"chart_footnote":[]}
Tannins are known for the formation of complexes with dietary nutrients, especially with proteins, which can result in reduced nutrient digestibility and consequent increase in their excretion in feces, as can be seen in the present study, with an increase in the amounts of N, NDF, and ADF in the manure used to supply the anaerobic digesters (Table 2). According to Hristov et al (2013), the decreased nutrient digestibility is expected to increase fermentable organic matter concentration in feces (volatile solids), which can promote a tremendous anaerobic digestion for biogas production, including . However, the doses of tannins used in this study were not enough to modify the efficiency of nutrient removal.
Investigation of production potential is a prerequisite to better predict emission by anaerobic digestion or during storage of feces under anaerobic conditions. Moller et al. (2004) reported emissions of 0.4 L of per gram of VS from bovine manure maintained in treatment systems with anaerobic lagoons, being close to 0.34 L/g of VS added, on average, found in the present study. However, it should be considered that the yield of manure from different sources can be highly variable and is affected by several factors, including species, breed, animal growth stage, food, quantity and type of bedding material, as well as the degradation processes during pre-storage (Angelidaki and Ahring, 2000).
Unlike our hypothesis, tannins could not promote changes in production. Hao et al. (2011), using 25g/kg of A. mearnsii CT for confined cattle, also found no increase in GHG emissions ( , and ) when the manure was composted. However, Tseu et al. (2021), using the same tannin extract of this experiment (0, 0.75, 1.50, and 2.25% DM), had a quadratic effect on total biogas and production when tannins are included above 0.75%, in addition, they suggest that tannin bioactive metabolites may appear in feces (when used to feed cows) and impair the digestion of the manure. A fact that may have contributed to the lack of change in production in the present experiment may be due to the levels of inclusion of tannins in the diet of the animals, since these levels are considered low and were intentionally used for not cause the effect of reducing food consumption by animals due to the known astringent impact of these compounds (Grainger et al., 2009). The substrates of the different genetic groups evaluated showed that the growth rate of and production were higher for Holstein manure (Table 3), causing the time needed to reach the inflection point of the curve, or that is, the maximum production potential would occur 22 (Figure 2) and 25 days before the Nellore manure, respectively. This fact is of great relevance, as it can contribute to the reduction of the Residence Time (RT), which indicates the time in which the liquid fraction of manure remains in the digester in contact with the biomass (Metcalf & Eddy, 2014), being the time necessary to achieve a certain degree of waste treatment dependent on the microbial metabolism rate.
Table 3: Production of biogas, , and in anaerobic batch-type digesters supplied with manure of Nellore and Holstein cattle fed Acacia mearnsii tannins SEM: Standard error of the mean; G*TL: Interaction between Genotype and Tannin Level; A: Asymptotic production (L/g VS added); k: production constant (L/g of VS added per day); t: time at inflection point (day); y: production at the inflection point (L/g of VS added).
| Variables | Genotype (G) | Tannin Level (TL) | SEM | Probability | ||||||
| Holstein | Nellore | 0% | 0.5% | 1.0% | 1.5% | G | N | G*TL | ||
| Biogas (L) | 36.27 | 36.42 | 34.77 | 37.26 | 36.89 | 36.46 | 0.65 | ns | ns | ns |
| $CH_4$ | 25.22 | 26.11 | 25.03 | 26.20 | 26.40 | 25.09 | 0.45 | ns | ns | ns |
| $CH_4$ (%) | 71.45 | 73.93 | 73.48 | 71.99 | 72.42 | 70.58 | 0.36 | ns | ns | ns |
| $CH_4/VS digested (L/g)$ | 1.11 | 1.26 | 1.24 | 1.07 | 1.18 | 1.23 | 0.051 | ns | ns | ns |
| $CH_4/VS added$ | ||||||||||
| A (L/g) | 0.393 | 0.432 | 0.419 | 0.445 | 0.385 | 0.403 | 0.02 | ns | ns | ns |
| t (day) | 39.28 | 61.35 | 51.02 | 47.87 | 44.51 | 57.86 | 5.49 | 0.039 | ns | ns |
| y (L/g) | 0.145 | 0.162 | 0.154 | 0.163 | 0.142 | 0.145 | 0.006 | ns | ns | ns |
| $CO_2, L$ | 11.00 | 10.87 | 9.99 | 11.05 | 11.58 | 11.11 | 0.21 | ns | ns | ns |
| $CO_2, \%$ | 28.54 | 28.15 | 27.09 | 28.06 | 29.28 | 28.92 | 0.21 | ns | $0.003^L$ | ns |
| $CO_2/VS digested (L/g)$ | 0.479 | 0.523 | 0.488 | 0.442 | 0.518 | 0.557 | 0.020 | ns | ns | ns |
| $CO_2/VS added$ | ||||||||||
| A (L/g) | 0.161 | 0.168 | 0.150 | 0.178 | 0.159 | 0.169 | 0.008 | ns | ns | ns |
| t (day) | 36.82 | 64.45 | 53.99 | 52.47 | 47.96 | 48.12 | 5.76 | 0.038 | ns | ns |
| y (L/g) | 0.059 | 0.061 | 0.055 | 0.065 | 0.059 | 0.062 | 0.003 | ns | ns | ns |
| $N_2O (mL)$ | 8.02 | 8.95 | 8.868 | 6.948 | 9.336 | 8.784 | 0.38 | ns | ns | ns |
| $N_2O (\%)$ | 0.023 | 0.028 | 0.026 | 0.022 | 0.026 | 0.025 | 0.0013 | 0.064 | ns | ns |
| $N_2O/VS digested (mL/g)$ | 0.362 | 0.496 | 0.461 | 0.391 | 0.428 | 0.437 | 0.030 | ns | ns | ns |
| $N_2O/VS added$ | ||||||||||
| A (mL/g) | 0.122 | 0.115 | 0.083 | 0.122 | 0.131 | 0.138 | 0.009 | ns | ns | ns |
| t (day) | 40.29 | 57.31 | 43.76 | 47.35 | 47.63 | 56.47 | 5.24 | ns | ns | 0.075 |
| y (mL/g) | 0.046 | 0.042 | 0.03 | 0.046 | 0.048 | 0.050 | 0.003 | ns | ns | ns |
As expected, in the present study the production of was not interfered by the type of substrate or by the tannin levels, probably because it occurs under strict experimental anaerobic conditions and due to the high C/N ratio. According to Bernet et al. (1996), when the C/N ratio is above 18 (characteristic of most animal manure) denitrification is complete and the formation of does not occur.
IV. CONCLUSIONS
Anaerobic digestion represents an alternative for waste treatment, as it not only reduces the polluting potential of waste, but also promotes the generation of biogas. The use of Acacia mearnsii extract up to 1.5% of the DM of the cattle diet did not promote changes in the nutrient removal efficiency, or in the production of biogas and its compounds ( , and ). The production rates of and were influenced by the composition of the waste of the different groups of cattle evaluated, being faster for Holstein, which could be a positive factor for the reduction of the Residence Time. As there was no increase in GHG production, this is good for environmental issues. On the other hand, from the point of view of energy generation, it would be irrelevant. Therefore, this extract can be used as a food additive to modify rumen fermentation without modifying the anaerobic digestion process of cattle manure. Furthermore, we recommended more studies on livestock nutrition and anaerobic digestion of waste as an analytical tool to manage the sustainability of livestock production and the environment.
ACKNOWLEDGMENTS
To Fundação de Amparo à Pesquisa do Estado de São Paulo (FAPESP) for financial support (grant number 201705301-0).
Conflict of Interest
The authors declare no conflict of interest.
Ethical Approval
Not applicable
Data Availability
The datasets used in this study are openly available at [repository link] and the source code is available on GitHub at [GitHub link].
Funding
This work did not receive any external funding.
References
Cite this article
Related Research




Special Issue
Launch a focused special issue to highlight research, emerging trends, and expert insights in your academic field.
