




IntelliPaper
Abstract
This study investigates the safety perceptions of victims and witnesses of crime on various bus systems in Belo Horizonte, Brazil. Through a web-based survey, a convenient sample of bus users from the UFMG university campus was gathered to analyze the influence of mechanisms of control and surveillance technology on their safety perceptions within the BRT MOVE system and the traditional bus system. Utilizing linear regression analysis, the study hypothesized that participants’ safety perceptions would vary based on the different risks as well as control mechanisms present in each bus system. The study addressed limitations, reviewed reliability and validity concerns, and highlighted the impact of various risk factors and socio-demographic factors on riders’ safety perceptions at bus stops, on buses, and at stations. These findings contribute to a greater understanding of the challenges facing urban mobility for bus riders in Brazil and offer potential solutions.
Explore Digital Article Text
I. INTRODUCTION
Safety in public transportation is a pressing issue in cities worldwide, including Brazil. Over the past few decades, the safety of passengers on buses in Brazil has significantly declined, with a notable increase in robberies and thefts on public transport. A survey carried out by the National Confederation of Public Transport in 2015 revealed that crimes on buses were among the primary concerns for riders, who make up approximately of the country's population. In a 2015 study on crime on buses, Paes-Machado and Viodres-Inoue highlighted the alarming trend of violent and threatening incidents experienced by passengers during bus travel. The researchers indicate that such exposure to criminal activities could have severe consequences on the mental health and behavioral habits of both victims and witnesses. The coercive use of firearms, threats, as well as psychological and verbal abuse, leave victims and witnesses feeling helpless and vulnerable (Paes-Machado & Viodres-Inoue, 2015; Jacobs, 2012-2013).
According to a 2016 study conducted by the National Confederation of Public Transport in Brazil in 2016, which surveyed 100 bus drivers in 169 Brazilian municipalities, armed robbery, physical assaults, and verbal abuse were found to be the most common crimes faced by bus drivers.
The study also revealed that the fear of becoming a victim of crime ranks as the second most common reason why bus drivers and conductors consider resigning earlier than usual. This situation not only affects the safety of bus drivers but also compromises the overall mobility of the population.
The anxiety and uncertainty among passengers, bus drivers, and conductors are constantly being fueled by the unexpected, rapid, and violent actions of armed youth and young male adults who work in groups of two or three. These individuals are often opportunistic robbers who target buses as a prime location for their criminal activities. They seek immediate results by robbing passengers of their valuables, with electronic devices such as cellphones and money being the most sought-after items (Oliveira, Natarajan & Silva, 2019). Drivers are often familiar with them, as they frequently use the bus system by evading fares or using it as a means to escape after committing crimes. These robbers are known for their swift and aggressive tactics, using guns to intimate and threaten passengers. Victims on buses are particularly vulnerable as they are confined in a small place with limited options for escape, making them easy targets for the robbers (Oliveira et al, 2019).
The impact of bus robberies extends beyond just the immediate victims. These crimes create a climate of fear and insecurity among the population, who may feel unsafe using public transportation. This can have a negative impact on the economy and social fabric of urban centers in Brazil, as people may be less likely to travel or engage in activities that require them to use public transportation. Therefore, a more in-depth analysis is needed in order to gain better control and prevent these issues.
Safety on bus systems has become a top priority for the government in many Brazilian cities. Modern innovations aimed at increasing passenger comfort, safety, and overall efficiency have been introduced alongside traditional bus systems. One such innovation is the Bus Rapid Transit (BRT) system, which was first implemented in 1974 by Jaime Lerner and has since been adopted in major cities like Sao Paulo, Belo Horizonte, Rio de Janeiro, and Goiania.
The BRT system, consisting of large and articulated vehicles, is considered more efficient, predictable, rapid, and comfortable than traditional bus systems. It features modern technologies such as CCTV cameras in buses and stations for 24-hour monitoring, advanced payment systems, redesigned bus stops with automatic doors and turnstiles, segregated bus lanes, and increased physical and personnel surveillance.
Despite the various measures put in place to enhance the efficiency and safety of bus transit environments, the paradox of innovation and perceptions of safety within bus systems remains a prevalent and complex issue. Understanding the factors that influence passengers' perceptions of safety in the public bus system and the implications for urban mobility is essential for addressing security challenges and improving the overall public transportation experience in Brazil.
This study aims to explore the key factors that shape perceptions of safety within the bus system in Belo Horizonte, the seventh largest city in Brazil, which features both the BRT system (known as MOVE) and the traditional bus system. The study offers a unique perspective on the perception of safety among victims and witnesses of robbery on buses in both types of bus system environments, influenced by objective and vicarious victimization.
The BRT system, implemented in 2014 in Belo Horizonte, includes an extensive surveillance system with CCTV cameras and security personnel at all BRT stations, integrated with conventional buses. The goal of this system was to enhance safety on buses and improve urban mobility and public transportation. Despite these innovations, the actual situation on the ground told a different story. Data on bus robberies in Belo Horizonte from 2012 to 2016 showed a notable surge, with reported incidents rising from 882 incidents in 2012 to 2,541 incidents in 2016, according to the public security secretariat of the Minas Gerais state in Belo Horizonte (Secretaria de Segurança Publica de Minas Gerais). This represents a 65% increase over a four-year period, indicating a concerning trend of a deteriorating safety in the city and posing risks to passengers.
The prevalence of armed youth and young male adults carrying out robberies on buses has created a climate of fear and insecurity among those who depends on public transportation in Belo Horizonte. According to Oliveira et al. (2019), the modus operandi of these individuals committing crime on buses typically involves boarding buses at bus stops in areas where they can easily make a quick gateway. They often target buses near impoverished neighborhoods known as favelas due to the lack of security measures in these areas, where they can blend in and escape without being noticed. This strategic choice of location allows them to evade capture and continue their criminal activities with impunity. Similarly, buses are also targeted in busy downtown areas which are often crowded with passengers, making them as easy target for thieves. These criminals take advantage of the chaos and confusion that comes with the hustle and bustle of downtown areas, making it easier for them to carry out their crimes without attracting attention, particularly at bus stops. Additionally, buses in busy downtown areas are often filled with people who are distracted and preoccupied, making them more vulnerable to attacks.
In an effort to reduce and prevent crime on buses, the municipal Guarda in Belo Horizonte, which is responsible to prevent and control crime on buses has implemented the Safe Trip Operation in 2017 (PBH, 2018). This initiative involves conducting preventive blitzes on buses and increasing patrols on specific routes during times and days considered at higher risk of thefts and robberies. By increasing their presence on buses and implementing targeted security measures, the municipal Guarda is actively working to combat crime and ensure the safety of passengers using the public transport system in Belo Horizonte. By combining surveillance technology, emergency response mechanisms, and targeted patrols the authorities are working to create a secure environment for passengers to travel without fear of crime. While the increase in robberies and thefts on buses is a concerning trend, the efforts being made to address the issue are positive step towards enhancing safety and security of public transport in the city.
Conducted in 2017, this study investigates and contrasts the perception of safety on both the BRT system and the traditional bus system among a convenient sample of bus users - faculty, students, and administrative staff of a local university in Belo Horizonte. While official robbery data does not distinguish between incidents on the BRT system and the conventional bus system, exploring the perception of safety among passengers – both victims and witnesses of crime – provides valuable insights into the relationship between innovation and safety in bus systems.
Based on a cross-sectional web-based survey design, the study aims to answer two primary questions: (1) Does the perception of safety within busy systems vary among riders controlled by factors such as socio-demographic background, locality of residence, exposure to risk (measured by frequency of ridership) as well as exposure to crime (victims and/or witnesses to crime)? (2) Does the perception of safety among riders vary depending on the type of bus system? The hypothesis is that the perception of safety among victims/and or witnesses to crime varies across different bus transit systems. It is expected that individuals' perception of safety will be lower in bus environments (or risky facilities) deemed risky due to a lack of control and surveillance mechanisms. This aligns with the Routine Activities theory (Hollis & Felson, 2013) which posits that enhancing capable guardianship at suitable targets (such as private security and CCTV-monitored cameras) and the implementing control mechanisms at specific locations or high-risk facilities (like bus station managers and staff, and alarm buttons on buses) can help decrease and deter crime.
What constitutes a risky facility is defined by Eck and Clark (2016) as an environment with unique functions that pose a high risk of crime. This is evident in bus stops, which have higher rates of crime compared to other areas within the bus system, such as the buses themselves, as indicated by Ryan Gale, 2013, and Hart and Miethe, 2014. Risky facilities are also considered crime attractors, as defined by Bowers (2013), due to the concentration of opportunities they provide for criminal activity. In this study, bus systems may not only be considered high-risk facilities but also crime attractors based on the opportunities they present for criminal activities. This may involve the concentration of potential targets confined on buses during transit, making it easy for criminals to commit crimes with little effort and high rewards, such as robbing multiple passengers at once and escaping without consequence.
The study employs a linear regression model to enhance understanding of the impact of exposure to crime and various risk factors on the perception of safety on buses. The findings could aid in developing a broader spectrum of crime prevention strategies and alternative solutions that foster a more compassionate approach to public transit safety. One of the key findings of this study was the variation in the risk of victimization, as indicated by travel frequency, between the two bus systems analyzed. This variance was statistically significant in reducing the sense of security for individuals who were victims or witnesses of crimes in the traditional bus system. In contrast, the municipal BRT MOVE system was found to have more effective surveillance mechanisms in place, aligned with the Routine Activities theory, which deter individuals from engaging in criminal activities. Our argument posits that this phenomenon could be attributed to the infrastructure, maintenance quality, surveillance, and design of bus stops within the BRT systems. These factors my elevate the challenges faced by individuals seeking to engage in criminal activities on buses, serving as variables that warrant further exploration in future research. The findings indicate that the bus's characteristics, coupled with the presence of safety measures and well-designed bus stops, play a pivotal role in shaping the perception of safety.
II. LITERATURE REVIEW
Transport crime (defined as crime related to buses, trains, rail stations, and bus stops) is a significant issue that instills fear and insecurity in millions of individuals who rely on public transportation systems for their daily commutes (Natarajan et al., 2015). In mega cities across Latin America, incidents of robbery, theft, and sexual harassment, especially targeting female passengers on buses, trains, or subways (Yanes-Pagans et al., 2019) represent a major challenge to the provision of safe, efficient, and high-quality public transportation services. The rise of crime within public transportation leads to heightened economic and operational expenses for the city and public transport companies. This escalation results in setbacks, including a decline in the overall quality of ridership, a greater inclination towards using private vehicles, and a subsequent surge in traffic congestion (Newton, 2014). Research highlights numerous shortcomings that impede safety and crime prevention in public transportation, including the lack or inefficacy of protective measures on vehicles, bus stops, and stations, as well as the safeguarding of employees and passengers (Yanez-Pagans et al., 2019). These factors have significant repercussions for the quality of urban mobility, manifesting in heightened stress and anxiety among victims and public transport personnel, leading to increased absenteeism and chronic mental health issues (Sousa et al., 2017).
Nevertheless, as noted by Rader (2017), the perception of fear poses a significant challenge to public security. Various factors, including gender, age, race, and social class are intertwined with the experience of this emotion (Rader, 2017). Fear plays a pivotal role in shaping social dynamics and urban mobility from both political and economic perspectives (Hernandez & Titheridge, 2016; Soto, Orozco-Fontalvo & Useche, 2017). Therefore, the exploration of fear and passengers' perceptions of safety is crucial for the development of more humane and effective safety and prevention policies within the bus safety transit system.
Despite being chronic issues in public transport, particularly in Latin America and other developing regions where buses are the primary mode of transportation (Oliveira et al., 2019), there is a lack of dedicated studies exploring the impact of victimization and insecurity on urban mobility. Few studies have focused on understanding how these phenomena affect riders and what preventative measures could mitigate the risk of crime. Similar to the prevalence of crime and violence, fear and safety perceptions shape the behaviors of both passengers and transport workers, regardless of whether they have personally experience victimization. According to Van Leirop and El-Geinedy (2017), safety is a crucial component of service quality for transit users, directly influencing the choice of public transportation and impacting decisions such as the timing, frequency, and routes of travel for commuters.
According to Jackson (2011), the perception of fear is a subjective concept influenced by immediate factors that induce fear and feelings of vulnerability, as well as external influences like media coverage. Research by Irvin-Erickson et al. (2020) suggests that factors such as the stage of journey, overcrowding, and visible signs of disorder, such as graffiti, litter, and indications of substance abuse, can impact the fear perception of public transit users. It is important to note, however, that there is not a direct correlation between increasing crime rates and heightened fear and feelings of insecurity. As highlighted by Hummelsheim et al. (2011), anxiety linked to fear can be significant even in areas with low crime rates.
Therefore, fear of crime and perceptions of safety on public transport may not be evenly distributed among the population of users, exhibiting specific temporal and geographic patterns. According to Grohe et al. (2012), fear and insecurity perceptions vary based on socio-demographic and economic factors, such as gender, age, race, ethnicity, education, place of residence, and prior experiences of victimization. Research indicates that women often experience greater levels of fear and insecurity compared to men, despite engaging in lower-risk behaviors (Ceccato, 2017; Soto, Orozco-Fontalvo & Useche, 2017). Similarly, older individuals tend to feel more anxious and vulnerable than younger people, despite having a lower likelihood of being victims of violence and crime (Ceccato & Bamzar, 2016).
According to Badiana, Ojewale and Okunola (2015), the physical characteristics of the environment and the placement of bus stops and stations can play a significant role in heightening fear and insecurity among riders. Fear of crime is also influenced by the time of day, with heightened levels typically occurring at night compared to daytime (Sreetheran & Van Den Bosch, 2014). Furthermore, riders' perceptions of safety are intertwined with the quality of the public transport, encompassing factors such as functionality, environmental features, nearby locations where bus crimes occur, and concerns about violence from other individuals (Oliveira et al., 2019).
Moreover, the dependence on a disorderly environment marked by a absence of guardianship and informal control mechanisms impacts users' susceptibility to crime. The risk of victimization is further shaped by individuals' daily routines, as elucidated by Bunch, Clay-Warner and Lei (2012), contributing to the heightened risk of victimization among certain demographic groups (Bunch, Clay-Warner & Lei, 2012). This dynamic may also clarify riders' embrace of precautionary measures to mitigate the risk of victimization and fear of crime. Such measures could involve altering urban mobility patterns, like decreasing the frequency of public transportation use, opting for different bus routes, or favoring private car usage over public transportation.
In Brazil, while research has delved into the rise of crime in public transport, there remains a scarcity of studies focusing on the safety perceptions of drivers and users within the intricate bus transit system. This system is characterized by the dual traits of modernization and the persistent presence of disorder within the bus transit environment. Further exploration in this area is essential to grasp the nuances of transport crime variation and safety perceptions across different types of bus systems, as well as the overall safety of the bus network. Addressing strategies to mitigate violence and enhance safety on buses poses a significant challenge for government entities, policy makers, law enforcement, and bus companies.
III. BUS PUBLIC SYSTEMS IN BELO HORIZONTE
The city of Belo Horizonte, capital of the state of Minas Gerais, has one of the highest standards of living in Brazil. However, it faces various challenges when it comes to ensuring the quality of living for over 2.5 million inhabitants as demonstrated by the Brazilian Institute of Geography and Statistics (IBGE), 2017. According to the City Human Development Index, an indicator published in the Human Development Atlas (2020), the city ranks in 18 place among 5.566 municipalities. It is a very privileged position compared to metropolises such as São Paulo (23) or Rio de Janeiro (28). The numbers for the Metropolitan Area of Belo Horizonte (RMBH for short), which integrates 23 municipalities and has a total population of 5.76 million people (IBGE, 2017), are somewhat less flattering. According to the urban welfare index (IBGE, 2017), it ranks 7 among the 16 Brazilian metropolitan areas and 25 among Brazilian municipalities (Ribeiro, 2013).
As for mobility dynamics, Belo Horizonte is a very special case. In Brazil, it is recognized as one of the most advanced cities in terms of its urban mobility projects. In the 1990s, the city was one of the pioneers in the creation of participatory planning projects, which resulted in the conception of the 1996 Urban Master Plan - Law 7165, 1996 (Fontoura, 2014). 1992 saw the creation of Transport Company Transit in Belo Horizonte (Empresa de Transporte e Tansito de Belo Horizonte, BHTANS). In 1995, the city also pioneered the creation of a permanent urban mobility information system (Fontoura, 2014). By 2011, Belo Horizonte was the first city in Brazil to have an urban mobility plan, and two strategies were prepared for the public organ that manages transport planning: the first plan for use until 2020, and the second until 2030. The city also made important investments to implement a transport system based on the Bus Rapid Transit (BRT) system, named MOVE. The system was launched in 2014, the year of the Confederations Cup and the FIFA World Cup, and won the city a Sustainable Transport Award from the Transport and Development Institute (ITDP).
Despite these initiatives to promote public transport, the Transport Company and Transit in Belo Horizonte (BHTRANS) indicates that mobility in Belo Horizonte is marked by a significantly low use of buses and the highest growth in the use of private automobiles in the country (BHTRANS, 2014). According to data from the Origin and Destination Survey carried out in 2012 (SEGEM, 2013), 6.3 million journeys were taken in the city, most of them by car (32.6%) and on foot (34.8%). Public bus transport accounted for 28% of all journeys, and the subway system, only 1.3% (BHTRANS, 2016). The metropolitan area (RMBH) has similar results. These numbers expose a significant deficiency in the use of buses (BHTRANS, 2014).
The decreasing use of public transport constitutes a strong trend in Brazilian metropolitan regions but is even more visible in the metropolitan region of Belo Horizonte, where public transport used to account for 60% of all trips in 2002. Despite the progressive loss of importance given to the demand for public transport, the bus system continues to supply most journeys in the city. The system offered to users is composed of a variety of vehicles and infrastructures with very unequal quality, accessibility, and safety conditions. There are two large transport systems: the conventional bus system and the MOVE BRT system.
3.1 The Conventional Bus System
The conventional bus system is composed of 2,421 buses (currently, as of 2017) that connect neighborhoods in different parts of the city, and particularly, the city center. According to Belo Horizonte Municipal Government (PBH), these buses circulate on streets and stop for passengers to go in or out at specific bus stops with shelters or signage (PBH, 2020). The supplementary system is composed of buses that connect neighborhoods without crossing the city center, with over 312 microbuses operating 27 lines. The "vilas e favelas" service is composed of 12 lines that serve the city's deprived neighborhoods, employing smaller buses. Some lines are equipped with panic and sexual harassment buttons, installed by the City Hall in 2018 in order to control the incidence of violence, particularly against women (Observatório do Milênio, 2020). These buttons are connected to Belo Horizonte's Integrated Operations Center (COP-BH), which manages all of the city's security cameras.
Conventional bus stops include various types of infrastructure with different levels of quality. On one hand, they can feature the most modern shelters, installed in the busiest areas, with night lighting, electronic display panels with information about routes, and spaces reserved for people with disabilities. On the other hand, there are shelters equipped only with stools for people with disabilities and "info points" – signs placed on poles along city streets.
According to Hasz (2017), the distribution of bus stops and bus lines in the various areas of the city is "very equitable, with a higher concentration in the Center-South zone, covered with a larger number of bus stops due to being the main destination of most passengers" (Hasz, 2017).
As a whole, the coverage of the public transport system is measured by the potential Accessibility Index (AI) of the population. For Belo Horizonte, this index was estimated by Miranda (2018), as the combination of the following numbers: 1) Bus Stop Density Ratio, the ratio between the number of bus stops and the population of each Field; 2) Frequency Ratio, the frequency of the bus lines that pass by each bus stop in a certain Field; and 3) Line Ratio, the number of bus lines that serve each bus stop in a certain Field. Figure 1 (in Appendix), created by Miranda (2018), shows once again the unequal coverage of the city's transport system, especially precarious in peri-urban areas, close to the towns that form the metropolitan area, and highly concentrated in the city center and surroundings.
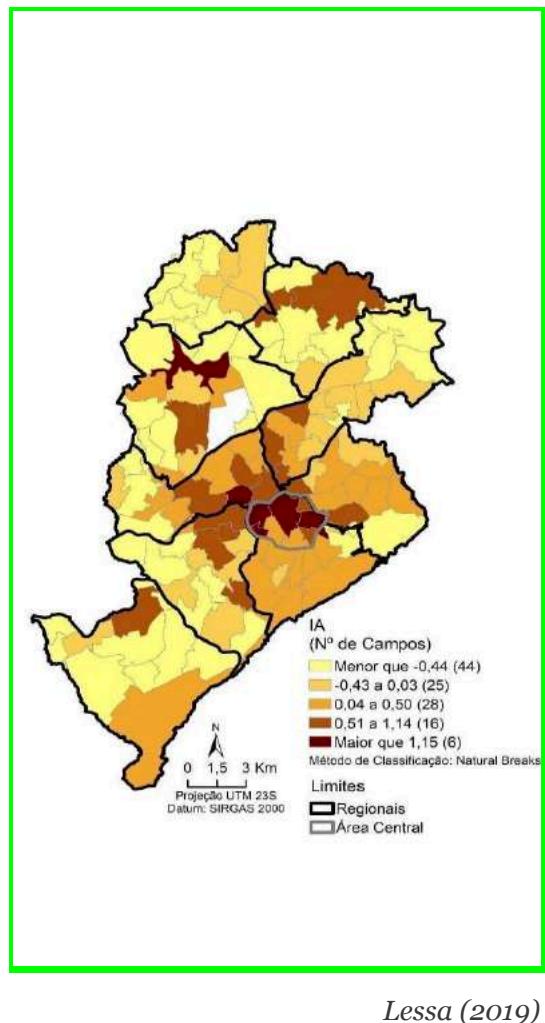 Figure 1: Accessibility Index Map of the Bus Transit System in Belo Horizonte
3.2 The BRT System: MOVE
The execution of the MOVE BRT system started in 2012, due to the city being selected to host matches for the FIFA World Cup. MOVE opened its first line in 2014. The system carries 372,303 passengers every day in the two exclusive corridors currently in operation, with an extension of 39 km (GLOBAL BRT DATA, 2021). MOVE uses the trunk-and-feeder system, which had already been installed as part of the Belo Horizonte Public Transport Restructuring Plan (BHBUS), in operation since 1997; exclusive bus corridors had already been built within the main corridors that connect the city center to the north of the city (BHTRANS, 2013). Thus, the system connects the hyper center to expanding areas of the urban grid, as seen in Figure 2 in the Appendix.
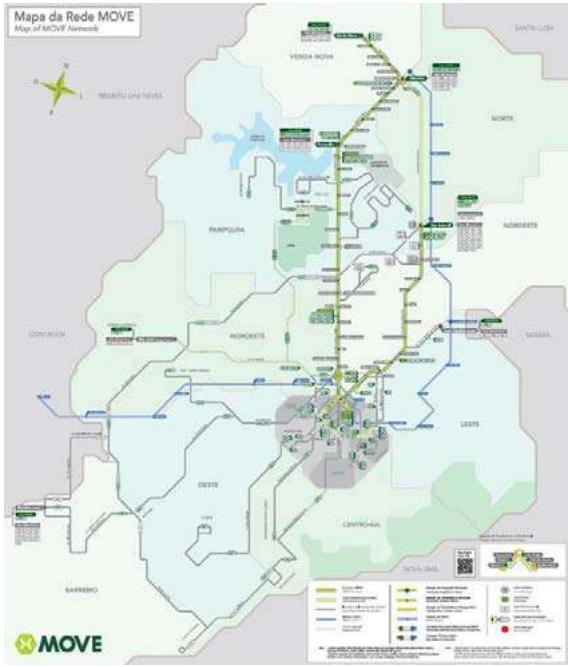
www.bhtrans.pbh.gov.br/move Figure 2: BRT MOVE System
MOVE is composed of two main corridors, on Antônio Carlos Avenue (14.7 km long) and Cristiano Machado Avenue (7.1 km long), the main axels of the system. In these corridors are exclusive lanes and embarking stations. The stations are divided between transfer and integration stations. Transfer stations (24 in the Antônio Carlos corridor and 9 in the Cristiano Machado corridor) are smaller and are used for either transferring between MOVE lines or for access to surrounding areas (see Figure 3).
{"image_source":{"path":"images/5141f2f2071c0011e2ef8d1cc68f33208c3039580692a54735f1a8651738e57b.jpg"},"content":"","chart_caption":[{"type":"text","content":"Examining Safety Perceptions Across Diverse Bus Systems in Brazil"}],"chart_footnote":[]} {"image_source":{"path":"images/4a6983449eeb1b77c9cbd77ef3a4db19122e0f2b2dc0768e805bdc04008e93db.jpg"},"content":"","chart_caption":[{"type":"text","content":"Inside the bus"}],"chart_footnote":[]}
{"image_source":{"path":"images/cf89201cb7eb6b0b7682bf2a1103923c112cef61e724d0509c81fd1eb4f024c2.jpg"},"content":"","chart_caption":[{"type":"text","content":"Bus Stations"}],"chart_footnote":[]} {"image_source":{"path":"images/be51a82e85dcf2cc066e83c3ae16974b03c348ae4396a0db023273bac86e699e.jpg"},"content":"","chart_caption":[{"type":"text","content":"Conv. System (Buses & Stations)"}],"chart_footnote":[]}
{"image_source":{"path":"images/f023d24f6cea52e21318e77cc0e1069d2531b0b0ccd65e53b9efbcd904ef51f0.jpg"},"content":"","chart_caption":[],"chart_footnote":[]} {"image_source":{"path":"images/f560df1ec003ff859cb3bcc0834ad8075fc8796c2a6cf7b00fce2157213e9acc.jpg"},"content":"","chart_caption":[],"chart_footnote":[{"type":"text","content":"Municipal MOVE (Buses)"}]}
{"image_source":{"path":"images/ae01c1a84993c9cbbb3f111937d5772e9894d63136ca344947230178b85f2054.jpg"},"content":"","chart_caption":[],"chart_footnote":[]} {"image_source":{"path":"images/a24065f4c07ebd96ca2b80233d33be6cd02de96e2d7daa4d18c1132953d06b49.jpg"},"content":"","chart_caption":[{"type":"text","content":"Metropolitan MOVE (Buses)"}],"chart_footnote":[{"type":"text","content":"Metropolitan MOVE (Stations)"}]}
{"image_source":{"path":"images/3773c6056da9a81d874c31eff260f9a21796bd3b9e81b347f94e135da4a4e78c.jpg"},"content":"","chart_caption":[{"type":"text","content":"Municipal MOVE (Stations)"}],"chart_footnote":[]} {"image_source":{"path":"images/76fb75664535c9f93bfcd812bb4311eb7e22f075aef6c71fd26e2926a75a0d5e.jpg"},"content":"","chart_caption":[{"type":"text","content":"Figure 3: General Model (All Public Transport System Locations)"}],"chart_footnote":[]}
Integration stations (see Figure 3), on the other hand, are much larger structures that serve MOVE trunk lines and the feeding lines that connect these stations to nearby neighborhoods. The stations are Pampulha, Venda Nova, Vilarinho, and São Gabriel. Vilarinho and São Gabriel also include subway stations and terminals for the metropolitan MOVE system. Of the four integration stations, only Pampulha Station was built as part of the BRT system. The others already operated as part of the BHBUS-trunk-and-feeder system and were adapted when they underwent renovation.
The Antônio Carlos and Cristiano Machado corridors are articulated via a junction on Paraná and Santos Dumont Avenues, in the hyper center. This junction saw the installation of six stations, four for municipal use and two for metropolitan use. Besides exclusive corridors, the system also includes a series of exclusive and preferential lanes for lines that leave segregated lanes and serve other regions.
The MOVE BRT bus system covers not only the city of Belo Horizonte but also its metropolitan area with Metropolitan MOVE, which includes the towns of Santa Luzia, Vespasiano, and Ribeirão das Neves. According to Hasz (2017), the main difference between the conventional system and MOVE is the management of waiting areas, which is more structured in the case of the latter. MOVE bus stations (including Transfer stations and Integration stations) charge customers and control their entry before embarking. These systems are watched by cameras and private security agents hired by the local government. Buses are equipped with GPS as well as panic and harassment alert buttons to control operations and surveil all vehicles in operation. The system is monitored directly by BHTRANS, the Military Police, the Municipal Guard, and the Fire Department via the Integrated Operations Center (COP-BH). Table 1 in the Appendix shows the main differences between the two bus transport systems operating in Belo Horizonte.
Table 1 Examining Safety Perceptions Across Diverse Bus Systems in Brazil
| Features | Public Bus Transport System | ||
| TYPES DESCRIPTION | Conventional and supplementary system | Municipal MOVE BRT | Metropolitan MOVE BRT |
| COVERAGE | Belo Horizonte, favelas and connecting main streets and neighborhoods | Belo Horizonte. 39 km of extension in two corridors: Antônio Carlos and Cristiano Machado | Belo Horizonte, Santa Luzia, Vespasiano, Riberão das Neves |
| BUS STOP INFRASTRUCTURE | Open shelters with external signage | Closed transfer stations with automatic doors and turnstiles for passenger circulation. Special stations in buildings to integratedifferent transport modes and services. | Closed transfer stations with automatic doors and turnstiles for passenger circulation |
| PUBLIC INFRASTRUCTURE FOR STATION INTEGRATION | Sidewalks | Footbridges or street-level passages, with signs | Footbridges or street-level passages, with signs |
| LOCATION OF BUS STOP INFRASTRUCTURE | Located on sidewalks of avenues | Located on central lanes of transport corridors | Located on central lanes of transport corridors |
| SECURITY SYSTEM: CAMERAS | On buses | On stations and buses | On stations and buses |
| SECURITY SYSTEM: PRESENCE OF GUARDS | No | Private security hired by local authorities | No |
| OTHER EMPLOYEES | No | Cleaning and entry supervision staff | Cleaning and entry supervision staff |
| COVERAGE OF BUSES WITH PANIC & HARASSMENT BUTTONS | Partial | All, since 2018.Warnings go to Operations Center | Since 2019, via an app. Great app to connect with Operations Center |
IV. METHODOLOGY
Majority of faculty and staff did not partake in the survey, potentially due to their preference for private transportation over public options. This discrepancy may also be attributed to the higher number of students in the sample, their greater familiarity with technology compared to older faculty and staff members, and their increased demand for public transportation services.
Data Collection Instrument: A web-based multiple-choice survey conducted through Google Forms was used to gather insights from members of the UFMG community concerning their perceptions of fear, insecurity, and exposure to crime while using buses, along with demographic variables. The choice of a web-based survey was deemed appropriate for this study due to its ability to reach out a broad audience within the targeted participant pool. Prior to commencing the survey, participants were briefed on the study's objectives and requirements, and were requested to provide informed consent by agreeing to the data sharing and privacy policies.
Upon completion, participants accessed the survey directly via the link provided in the email. Subsequently, all survey responses were downloaded as text files and analyzed using SPSS software, version 19, ensuring the utmost anonymity inherent in the web-based survey format, which precludes the identification of sensitive personal information.
In an effort order to enhance reliability, a pre-test questionnaire was circulated to a small group of students for completion. This exercise enabled researchers to detect and address any errors or shortcomings in the questionnaire (Heiervang & Goodman, 2011).
Data Statistical Analysis: A cross-sectional database was utilized for a quantitative and inferential approach, focusing on linear regression analysis (OLS). The safety levels within the bus system were examined across various environments: 1) inside the buses; 2) at the bus station; and 3) at bus stops. Furthermore, variations based on the type of bus system were considered: 1) Conventional; 2) BRT MOVE Municipal; and 3) BRT MOVE Metropolitan.
Respondents used a Likert scale to express their perception of safety within the bus system, addressing various aspects: 1) inside the conventional bus; 2) inside the municipal BRT MOVE bus; 3) inside the metropolitan BRT MOVE bus; 4) at the conventional bus stops; 5) at the municipal integration station; 6) at the metropolitan BRT MOVE transfer station; and 7) the municipal BRT MOVE transfer station.
To evaluate the relationship between fear, insecurity among public transport users, exposure to crime, social-demographic variables, and frequency of public bus transport use, we conducted descriptive data analysis to understand the dataset's composition. This was followed by linear regression analysis to investigate the impact of each dimension on the final variables.
The question designed to assess fear and insecurity among bus users was segmented based on the distinct locations within the public bus system. This approach considered the fundamental disparities in fear and insecurity perceptions between buses and stations, as well as the variations between the municipal and metropolitan BRT MOVE systems. The question posed was: "On a scale of 1 to 5, with 1= very unsafe; 2 = not very safe; 3 = neutral; 4 = safe; 5 = very safe, how do you perceive the safety level on the bus system?"
To operationalize the dependent variable concerning the perception of safety within different types and environments of the public bus system, the responses were consolidated and scales were aggregated to form the final safety perception measure based on the system's spatial divisions. Figure 3 displays histograms illustrating the perceived security variables. This visual representation showcases the distribution of the response variable for each type and environment associated with the public mobility system examined in this research. Various response variables were generated from the different system spaces to assess the model. The operationalization of the variable involved summing the relevant variables, as detailed in Table 2 in the Appendix.
Table 2: Response variables of the perception of safety in the public transport measurement model.
| Focus of Analysis | Response Variable | Composition |
| All locations | All locations | Conventional Bus + Municipal MOVE + Metropolitan MOVE Bus + Supplementary (conventional) bus + Bus stops (on the street) + Municipal Integration Station + Municipal MOVE Station + Metropolitan MOVE Station |
| On the bus vs. Bus stations vs. Bus stops | On the bus | Conventional Bus + Municipal MOVE + Metropolitan MOVE Bus + Supplementary (conventional) Bus |
| Bus stations | Municipal Integration Station + Municipal MOVE Station + Metropolitan MOVE Station | |
| Bus stops (on the street) | Bus stops (on the street) | |
| MOVE vs. Conventional System (Buses and Stations) | MOVE System | Municipal MOVE Bus + Metropolitan MOVE Bus + Municipal MOVE Station + Metropolitan MOVE Station |
| Conventional System | Conventional Bus + Supplementary (conventional) bus + Bus stops (on the street) + Municipal Integration Station | |
| Municipal MOVE System vs. | Municipal MOVE (Bus) | Municipal MOVE Bus |
| Metropolitan Bus System (Buses) | Metropolitan MOVE (Bus) | Metropolitan MOVE Bus |
| Municipal MOVE System vs. Metropolitan MOVE System (Stations) | Municipal MOVE (Stations) | Municipal MOVE Station |
| Metropolitan MOVE (Stations) | Metropolitan MOVE Station |
Additionally, efforts were made to construct and operationalize the independent variables for the inferential regression model. The independent variables are described as follows:
-
Social-demographic variables: Gender and age are factors that influence differences in bus passengers' fear and safety perceptions. These variables are essential for implementing targeted and inclusive safety measures within public bus systems.
-
Place of residence: The location of a bus user's residence can impact the availability of public transport services and safety, as well as the duration of their bus system usage. Areas further from the city center often experience longer wait times and more crowded vehicles.
-
Frequency of bus system use: Differences in how often individuals use the bus system can influence their familiarity with key factors that shape safety perceptions and fears, as well as increase their exposure to criminal activities.
-
Exposure to crime: This variable assesses whether bus users have encountered criminal incidents, either as victims, witnesses, or both.
The operationalization of these variables is detailed in Table 3 in the Appendix.
Table 3: Control variables of the measurement model for fear and insecurity in the public transport system
| Variable | Options | Operationalization |
| Victim and/or witness | Yes and No | Dummy variable |
| Residing in Belo HorizonFte | Yes and No | Dummy variable |
| Gender | Female or Male | Dummy variable |
| Age | Open | Continuous variable |
| Frequency of use of public transport | Once a week; twice a week; 3 times a week; 4 times a week; 5 times a week; 6 times a week; Every day | Scale variable |
In examine the impact of gender, age, exposure to crime, and frequency of bus use on safety perception, we conducted a regression analysis that includes the type of bus system and management as crucial variables identified by respondents. The linear regression model was segmented into five sections:
-
Regression analysis was conducted with the safety perception as the dependent variable for all locations within the public bus system.
-
Safety perception was compared between inside the bus and bus stations, as well as bus stops.
-
Safety perception was compared between BRT MOVE (inside the bus and bus transfer stations) and the conventional bus system (inside the bus and bus stop).
-
Safety perception was compared between the municipal BRT MOVE system (inside the bus) and the metropolitan BRT MOVE system (inside the bus).
-
Safety perception was compared between the municipal BRT MOVE system (transfer bus stations) and the metropolitan BRT MOVE system (transfer bus stations).
The overall model for safety perception across all responses and various subdivisions based on the type of bus system (conventional versus BRT MOVE) and spatiality (limited to the city of Belo Horizonte and its metropolitan network) is presented. Model adjustments can be accessed through the results of the adjusted regression coefficient. Table 5 displays the estimates, standard errors, and test statistic values used to determine the significance of the proposed model's estimates.
V. RESULTS AND ANALYSIS
The survey predominantly attracted female respondents aged between 15 and 39, residing in Belo Horizonte (see Table 4 in the Appendix). Gender and age, besides being key sociodemographic factors, are crucial variables for comprehending mobility patterns and crime prevention strategies (Ceccato, 2017). Moreover, the participants' residential locations highlight disparities in the public bus systems accessible in their respective areas. Notably, bus systems in municipalities within the metropolitan region of Belo Horizonte exhibit notable distinctions in terms of infrastructure, utilization frequency, and proximity to the UFMG campus, a central point of interest for all survey participants.
Over half of the respondents use public transport more than four times a week (and 24% use public transport every day). As for exposure to crime in public transport, including bus stops, stations, and buses, 49.6% of respondents declared they had been victims and/or witnesses of criminal incidents.
The survey results highlight significant disparities in mobility behaviors and safety perceptions concerning sociodemographic factors and respondents' residential regions, aligning with previous research findings (Ceccato, 2017; Ceccato and Bamzar, 2016; Grohe et al., 2012). However, a more thorough examination reveals the considerable influence of the specific type of mobility system, particularly within the bus environment, on shaping perceptions of crime incidence. This influence is closed tied to the infrastructure characteristics provided by public bus systems. In the case of Belo Horizonte, variations in public bus services in terms of quality, coverage, organization, and surveillance present distinct opportunities that may contribute to the occurrence of criminal incidents.
Altogether, Belo Horizonte's public bus transport systems are considered quite unsafe by most respondents (see Table 4). At least more than rate buses and stations as "very unsafe" or "unsafe" spaces. However, it is necessary to point out important variations in relation to the type of mobility system used. In this study we assess the perception of safety not only in the vehicles, but also in the different waiting infrastructures that are part of the service offer.
Overall, our observations indicate that conventional bus system, which operates buses throughout the majority of the city's streets and includes open bus stop shelters, is viewed more unfavorably by participants. Additionally, vehicles within this system were deemed to be more hazardous in comparison to other systems, with 24% labeling them as "very unsafe" and 50% "unsafe." Furthermore, the design of the bus stops, characterized by a lack of physical protection and surveillance, was perceived as "very insecure" by 67% of respondents (Table 4).
Table 4: Distribution of Frequency and percentage of the gender, age, place of residence, frequency of use of public transport, and exposure to crime variables
| N | % | ||
| Exposure to Crime | Not victim or witness | 772 | 50.4 |
| Victim or witness | 761 | 49.6 | |
| Total | 1533 | 100.0 | |
| Residence City | Other Cities | 210 | 13.7 |
| Belo Horizonte | 1318 | 86.3 | |
| Total | 1528 | 100.0 | |
| Gender | Male | 550 | 36.1 |
| Female | 975 | 63.9 | |
| Total | 1525 | 100.0 | |
| Age Group | 15 to 24 years | 768 | 50.0 |
| 25 to 39 years | 601 | 39.1 | |
| 40 to 59 years | 149 | 9.7 | |
| 60 years or more | 18 | 1.2 | |
| Total | 1536 | 100.0 | |
| Frequency of Use of Public Transport | Once a week | 170 | 11.2 |
| Twice a week | 124 | 8.2 | |
| Three times a week | 121 | 8.0 | |
| Four times a week | 115 | 7.6 | |
| Five times a week | 465 | 30.6 | |
| Six times a week | 147 | 9.7 | |
| Everyday | 376 | 24.8 | |
| Total | 1518 | 100.0 | |
On the other hand, the BRT MOVE system received higher ratings compared to the conventional bus system. Nevertheless, distinctions emerged between the system managed by the municipal BRT MOVE, under the administration of the Municipality of Belo Horizonte, and the metropolitan BRT MOVE system overseen by the state government. As a result, the stations within the municipal system received more positive evaluations, while stations and buses within the metropolitan system were perceived more negatively.
These variations in safety perceptions could be linked to the spatial layout and operational structures of distinct urban mobility systems. The BRT MOVE system features stations that are more secure and enclosed, equipped with dedicated security personnel, CCTV surveillance, and a Municipal Control Center that continuously monitors and supervises these areas. This setup enables more effective deployment of police operations and enhances overall security measures.
The conventional bus system, while providing extensive geographic coverage, relies heavily on the contextual conditions of its infrastructure locations. Bus stops are typically open spaces, closely connected to surrounding urban areas, and lack institutionalized security measures. Consequently, these spaces may exhibit more variability in terms of potential criminal activities and opportunities for illicit behavior.
To examine variances in perception of safety based on sociodemographic variables, exposure to crime, and frequency of usage, we conducted a regression analysis comparing the type of system and manager. The findings from the regression model presented in Table 5 reveal that across all models, the gender variable, specifically indicating female gender, is negatively associated with the perception of safety. This suggests that female participants in the study generally have a lower perception of safety when using public transportation by bus. Additionally, in cases where it was statistically significant, the age variable exhibits a similar association, indicating that older individuals tend to perceive lower levels of safety within the public transport system, irrespective of spatial location. Conversely, individuals residing in the city of Belo Horizonte demonstrate a higher perception of safety while using public transportation compared to residents and users from other municipalities within the metropolitan region.
Table 5: Distribution of the perception of safety per location type
| Very unsafe | Not Very Safe | Neutral | Safe | Very Safe | Total | ||
| On Conventional Buses | N | 368 | 767 | 294 | 89 | 0 | 1518 |
| % | 24.2 | 50.5 | 19.4 | 5.9 | 0.0 | 100.0 | |
| On Municipal MOVE Buses | N | 286 | 698 | 325 | 186 | 11 | 1506 |
| % | 19.0 | 46.3 | 21.6 | 12.4 | 0.7 | 100.0 | |
| On Metropolitan MOVE Buses | N | 371 | 552 | 449 | 64 | 4 | 1440 |
| % | 24.1 | 35.9 | 29.2 | 4.2 | 0.3 | 100.0 | |
| On Supplementary Buses (Conventional System) | N | 315 | 674 | 365 | 94 | 6 | 1454 |
| % | 21.7 | 46.4 | 25.1 | 6.5 | 0.4 | 100.0 | |
| Bus Stops | N | 1018 | 415 | 61 | 14 | 3 | 1511 |
| % | 67.4 | 27.5 | 4.0 | 0.9 | 0.2 | 100.0 | |
| Municipal Integration Stations | N | 310 | 531 | 457 | 145 | 14 | 1457 |
| % | 21.3 | 36.4 | 31.4 | 10.0 | 1.0 | 100.0 | |
| Municipal MOVE Stations and bus stop cabins | N | 309 | 570 | 366 | 219 | 24 | 1488 |
| % | 20.8 | 38.3 | 24.6 | 14.7 | 1.6 | 100.0 | |
| Metropolitan MOVE Stations and bus stop cabins | N | 346 | 497 | 465 | 122 | 11 | 1441 |
| % | 24.0 | 34.5 | 32.3 | 8.5 | 0.8 | 100.0 | |
Table 6: Estimates of coefficients, standard error, and level of statistical significance of the linear regression model for the measure of perceived safety in all environments of the public bus transport system
| Variables | General Model(All bus environments) | Model 1 | Model 2 | Model 3 | Model 4 | |||||
| On bus | Bus stations | Bus stops | BRT(On bus & stations) | Conventional bus(On bus & Bus stations) | Municipal BRT(On Bus) | Metropolitan BRT(On Bus) | Municipal BRT(Bus Stations) | Metropolitan BRT(Bus stations) | ||
| Gender(Female) | -,231***(0,274) | -,194***(0,149) | -,227***(0,143) | -,126***(0,033) | -,231***(0,165) | -,195***(0,128) | -,262***(0,048) | -,143***(0,046) | -,253***(0,053) | -,178***(0,051) |
| Age | -,098***(0,015) | -,075**(0,008) | -,086**(0,008) | ,026(0,002) | -,104***(0,009) | -,059***(0,007) | -,070***(0,003) | -,051**(0,002) | -,092***(0,003) | -,077***(0,003) |
| Residence | ,081**(0,384) | ,090***(0,209) | ,071**(0,200) | -,014(0,047) | ,084***(0,233) | ,063***(0,180) | ,052***(0,067) | ,112***(0,064) | ,067***(0,075) | ,101***(0,070) |
| Exposure to crime | -,201***(0,270) | -,219***(0,147) | -,139***(0,141) | -,153***(0,033) | -,198***(0,163) | -,190***(0,127) | -,229***(0,047) | -,217***(0,045) | -,150***(0,052) | -,141***(0,050) |
| Exposure to Risk(Frequency of use) | -,044*(0,068) | -,055**(0,037) | -,019(0,036) | -,082***(0,008) | -,024(0,041) | -,069***(0,032) | -,021(0,012) | -,040(0,011) | -,019(0,013) | -,038(0,013) |
Controlling for all other variables, being a victim of crime or witness to crime significantly reduces the perception of safety in bus public transport, with this factor proving to be statistically significant across all models. Moreover, the risk of exposure variable, measured in this study by the frequency of respondents' use of the public bus transport system, is negatively correlated with the perception of safety and attains statistical significance at the 5% level for both model 1 and model 2. In model 1, exposure to risk is inversely linked to the perception of safety inside buses, and when considering both types analyzed (conventional bus and BRT MOVE), this outcome is likely influenced by perceptions associated with conventional buses, as evidenced by the results in model 2.
within vehicle lanes, leaving passengers highly exposed and at an increased risk of failing victims to criminal activities.
The coefficients obtained in model 2 pertaining to the risk exposure variable validate the hypothesis that BRT MOVE system, encompassing both stations and buses, provides enhanced security measures (surveillance) for its users. In contrast to the conventional bus system, the perception of safety within the BRT MOVE system does not appear to be influenced by the level of risk exposure. Conversely, the frequency of use by passengers in the conventional bus system is negatively linked to the perception of security within that system, demonstrating statistical significance at the 5% level.
Furthermore, the coefficient associated with the risk of exposure in model 1 is notably more pronounced concerning the perception of safety at bus stops. This effect is likely attributed to the heightened vulnerability and risk of crime prevalent at these locations. As detailed and illustrated in this study, bus stops are often unprotected spaces for users, typically situated
VI. LIMITATIONS AND FUTURE RESEARCH
This study is a cross-sectional analysis of safety perception on various bus systems among members of a local university in Belo Horizonte, and therefore cannot be generalized to the broader population or provide insights into changes in safety perceptions over an extended period. Safety perceptions may vary over time due to variations in urban characteristics across different locations within the city and other factors, such as media coverage of violence on public transportation, which could heighten feelings of insecurity. Additionally, changes in geographical and temporal mobility patterns of bus riders may impact safety perceptions.
Additionally, by focusing solely on two indicators of victimization - exposure to crime and frequency of bus system use - this study is limited in its ability to identify other potential variables, such as the adoption of protective measures by respondents, that could have influenced their safety perceptions across the different bus systems analyzed. Furthermore, the research lacks a comprehensive analysis of how environmental and situational factors, both within the surrounding environments during bus journeys and within the bus systems themselves, from students' residences to the university, may have impacted safety perceptions. This could involve a detailed examination of the design of buses, bus stations where passengers embark and disembark, as well as the physical and social factors present at various bus stops along the journey. Previous studies have demonstrated that feelings of insecurity and fear among riders can be influenced by the physical characteristics of the public transit environment, particularly for women and the elderly (Grohe et al., 2012). Factors such as enclosed stations that limit visibility, inadequate lighting, isolated locations, and nearby areas with alleys and secluded spots could all contribute to these perceptions (Haans & De Kort, 2012).
Future research could expand beyond environmental variables to explore narratives of passengers regarding the quality and safety of their bus travels. Incorporating qualitative data would provide a deeper understanding of why safety perceptions vary across different bus systems analyzed in this study. Investigating the safety perceptions of victims and witnesses of various types of crimes on buses, including robbery, theft, and sexual harassment, would enhance comprehension and comparison of different patterns of criminal activities on bus systems. This approach could facilitate the design of more effective prevention and reduction measures to ensure safer bus trips.
VII. CONCLUSION
In conclusion, this study addressed the primary research questions by revealing that the perception of safety among bus riders is influence by factors such as individuals' sociodemographic background, place of residence, frequency of bus usage, and experiences with crime (as victims and/or witnesses). Age and gender were found to have a significant negative association, with older individuals and women generally exhibiting lower perceptions of safety within the public bus transportation system, irrespective of its type or location. Conversely, residents of Belo Horizonte exhibit a higher perception of safety in public bus transportation compared to residents and commuters in other municipalities within the metropolitan region. When all other variables are taken into account, being a victim or witness of crime significantly diminishes the perception of safety in public transport, with this variable proving to be statistically significant across all models. Additionally, the frequency of respondents' use of public transport serves as an operationalized measure for the risk of exposure in this study.
While respondents generally view the bus system as unsafe, the perception of safety among riders is shaped by the presence or absence of control mechanisms in various types of buses and bus waiting facilities, particularly in the case of conventional buses and the BRT MOVE system. Conventional buses are often perceived as unsafe and risky compared to the diverse range of control mechanisms offered by the BRT MOVE system.
One of the key findings of this study is the variation in the exposure to the risk of victimization, as measured by the frequency of travel use, between the two bus environments examined. This exposure was found to be statistically significant in decreasing the sense of security among victims and/or witnesses of crime in the conventional bus system. In contrast to the municipal BRT MOVE system, the conventional bus system lacks effective surveillance mechanisms that could deter potential offenders, as proposed by the Routine Activities theory. We posit that this disparity may be attributed to factors such as infrastructure, maintenance quality, and the design of bus stops, which should be taken into account in future research. The results underscore the importance of considering the characteristics of the bus itself and bus stops as critical factors in shaping the perception of safety for bus riders.
Specific prevention policies and practices should be implemented to enhance the perception of safety on the conventional bus system. These measures should prioritize the design of safer infrastructures that promote increased guardianship over riders and surveillance through the use of technology, private security, and place managers. For instance, drivers could utilize alert buttons to send customized signals to bus companies, the Guarda municipal, and police departments in case of incidents on buses. Additionally, customized LED alert message signs could be displayed simultaneously on exterior message boards on the front and rear of buses. While these recommendations may have seemed novel when this study was conducted in 2017, similar strategies have been adopted in bus systems in Belo Horizonte and other cities in Brazil in subsequent years. For example, in 2018, BHTRANS in Belo Horizonte took further action by installing "panic buttons" on bus driver dashboards, enabling drivers to alert authorities in cases of sexual harassment. Female victims of such incidents can communicate with the driver, who can immediately activate the panic button. Once activated, this button sends an immediate alert to TransFacil (Consortium of bus companies), the coordination of COP-BH (Integrated Operations Center linked to the municipal security and prevention secretariat) and the representative of BHTRANs at the operations center. Police officers and the Guarda municipal are then notified to take necessary measures.
Similarly, panic buttons have been developed for use in case of robberies, theft, and kidnapping on buses. The concept of implementing panic buttons emerged in 2023 and was initially tested on buses in Cubatao, a city in the state of Sao Paulo. When activated, the button automatically sends an alert to authorities, and a message is displayed on the exterior front board of buses. The use of panic buttons was formally regulated at the national level through bill 685/22 and approved by the Senate. However, it is still pending approval by the Chamber of Deputies and requires sanction by the President of the Republic of Brazil. Additionally, municipal adoption and implementation of the panic button system depend on regulations through local laws. The city of Brasilia, the capital of Brazil, deemed this measure unconstitutional and vetoed the use of panic buttons on local buses. Despite the bureaucratic processes and political debates surrounding the use of panic buttons, the idea appears promising as a deterrent mechanism that may increase risks for criminals.
Alternative situational crime prevention methods for preventing and controlling crime on buses include utilizing crime reporting apps and implementing electronic and digital ticketing systems to reduce cash circulation. The installation of metal detectors on bus doors can help prevent the presence of weapons on buses and deter criminal activity. While facial recognition and biometric identification have been proposed, ethical concerns regarding privacy and surveillance must be addressed before widespread implementation. Further research is necessary to understand riders' perceptions of safety and the intricates of different public bus mobility systems, considering factors such as location and integration within urban spaces. Other aspects to consider that could enhance the effectiveness and inclusivity of safety measures on public bus systems include: evaluating the presence or absence of safety mechanisms inside buses, stations, and bus stops; examining the interconnectedness between safety perceptions and the surrounding environment during bus journeys; and assessing the effectiveness of place managers and capable guardianship in various bus systems environments.
Conflict of Interest
The authors declare no conflict of interest.
Ethical Approval
Not applicable
Data Availability
The datasets used in this study are openly available at [repository link] and the source code is available on GitHub at [GitHub link].
Funding
This work did not receive any external funding.
References
Cite this article
Related Research



Special Issue
Launch a focused special issue to highlight research, emerging trends, and expert insights in your academic field.
