




IntelliPaper
Abstract
Chronic renal failure (CKD) is kidney damage defined by a permanent decrease in glomerular filtration rate (GFR) characterized by biological signs present for more than three months.
Protein-energy malnutrition (PED) in hemodialysis is also a factor of morbidity and mortality in patients with a prevalence ranging from 15 to 75% worldwide. However, the care of hemodialysis patients often does not include nutritional care. This study aims to contribute to the promotion of the health of patients with chronic renal failure on hemodialysis, by evaluating their nutritional status and identifying the incriminating diets in the deterioration of their health.
This is a cross-sectional, prospective and multicenter study, both descriptive and analytical over a period from May 05 to August 05, 2023. It focused on patients with chronic renal failure (CKD) treated with hemodialysis in the clinics “Unidial”, “Martin Luther King” and the CMS “Maison du Hadj”. Nutritional status was assessed using ISRNM 2008 criteria.
Mantel Haenszel's Chi-square (χ 2 ) test was used to compare proportions, relative risk (RR) to look for associations between variables, and Pearson's coefficient for correlations. It was included 32 patients whose average age was 53.13 ± 14.37 years. The prevalence of protein- energy malnutrition varied from 53.13 to 65.63% depending on the indicator used. A correlation between various malnutrition indicators was found with two risk factors. First, insufficient protein intake: serum albumin was correlated with arm circumference (r = 0.93; p = 0.0001). Second, insufficient energy intake with a BMI strongly correlated with arm circumference (r = 0.96; p = 0.0000). Obesity was present in 6.25% of cases. Abdominal
obesity was 43.75% in women and 25% in men.
Protein-energy malnutrition is therefore a frequent problem in hemodialysis. It is therefore necessary to improve the hemodialysis program with the integration of adequate and effective nutritional support through lifestyle and dietary interventions in chronic hemodialysis patients.
Explore Digital Article Text
I. INTRODUCTION
Chronic renal failure (CRI) is kidney damage defined by a permanent decrease in glomerular filtration rate (GFR), with a chronic nature confirmed by biological signs present for more than three months . It results from the progressive destruction of the renal parenchyma and evolves more or less rapidly towards complete renal failure. Long silent, kidney disease first manifests biologically and then clinically [1]. Indeed, chronic kidney disease (CRD) affects more than 850 million people worldwide, i.e. one in ten adults causing at least 2.4 million deaths per year and is the 6th leading cause of death whose growth is the fastest [2]. In Togo, a hospital frequency of of patients with end-stage chronic renal failure (ESRD) was reported in the first nephrology consultation [3]. Moreover, among the risk factors associated with this pathology, malnutrition remains decisive. Indeed, according to the World Health Organization (WHO), malnutrition is a pathological state resulting from the relative or absolute deficiency or excess of one or more essential nutrients, whether this state manifests itself clinically or it can only be detected by biological, anthropometric or physiological analyzes [4]. Risk factors such as high blood pressure, obesity, diabetes and dyslipidemia are diseases that mostly have causes of nutritional origin, including excess malnutrition [5]. The occurrence of chronic renal failure is also associated with an increased risk of protein-energy malnutrition (PED) in individuals with this pathology [6]. Malnutrition is a pathological state characterized by an imbalance in the energy balance, i.e. an insufficient intake in relation to the body's nutritional needs [7]. It is defined by a deficiency in protein and energy, most often accompanied by a deficiency in vitamins and trace elements. According to the High Authority of Health (HAH) in France, undernutrition represents the state of an organism in nutritional imbalance characterized by a negative energy and/or protein balance [8]. Indeed, protein-energy malnutrition (PEM) is frequently encountered in patients with chronic renal failure treated by hemodialysis and is thus associated with a significant increase in the risk of morbidity and mortality [9]. In addition, PED in hemodialysis is a morbidity and mortality factor with a prevalence ranging from 15 to worldwide (Delma et al., 2020). The prevalence of PED in hemodialysis patients in developing countries is superimposable to that in developed countries [10].
In addition, a study conducted on the "Influence of nutritional factors and the adequacy of hemodialysis on the survival of 1610 French patients", reported that protein-energy malnutrition concerns 30 to of these hemodialysis patients. [11]. In sub-Saharan Africa, protein-energy malnutrition is also a real public health problem, including 20 to of hemodialysis patients, often with a multifactorial origin [12].
Indeed, patients with chronic renal failure often present with protein-energy malnutrition related to an imbalance between insufficient nutritional intake, protein hypercatabolism and increased energy needs. These patients also have specific nutritional deficits associated with deficiencies in micronutrients and vitamins (iron, folic acid, vitamin B12, zinc, etc.). This increase in metabolism must then be satisfied by an adequate diet in order to maintain the body's muscle mass and an acceptable nutritional balance in these patients. However, it is observed that the increased needs are often not satisfied in patients with renal insufficiency, thus rendering their nutritional balance deficient compared to that of normal individuals. Although an adequate nutritional intake is thus necessary to ensure a good nutritional status of the hemodialysis patient, we note that there are very few data on the relationship between the diet of subjects with chronic renal failure and their state of health, particularly in Togo. However, these data are necessary to develop lifestyle and dietary interventions, in the prevention and treatment of these nutritional disorders for better management of chronic hemodialysis patients, thus improving their quality of life and overall survival. It is in this context that this study on the eating habits and nutritional status of hemodialysis patients in some hemodialysis centers in Togo takes place. It is therefore a contribution to the care and improvement of the quality of life of hemodialysis patients in Togo.
II. MATERIALS AND METHODS
2.1. Type of study
This is a cross-sectional, prospective and multicenter study, both descriptive and analytical, which was carried out over a period from May 5 to August 5, 2023. It took place in the various hemodialysis units Unidial, Martin Luther King and CMS Maison du Hadj clinics in Lomé (Togo). The patients had hemodialysis sessions, the frequency of which is 2 to 3 times a week. The study then focused on patients with chronic renal failure (CKD) treated by hemodialysis in the centers considered.
2.2. Inclusion criteria
The study included patients on regular hemodialysis for at least three months and aged at least 18 years.
2.3. Non-inclusion criteria
Patients aged at least 18 years with chronic renal failure not undergoing hemodialysis replacement therapy were not included in the study. Patients on hemodialysis for acute renal failure or aged under 18 were also not included in the study.
2.4. Exclusion criteria
Patients with neuropsychiatric or auditory disorders, a major disability limiting the taking of anthropometric measurements (limb amputation and paraplegia) and patients who refused to participate in the study were excluded from the study.
2.5. Variables collected
Sociodemographic characteristics, medical history (diabetes, hypertension, length of hemodialysis), dietary habits, dietary restrictions, anthropometric and biological parameters were collected in the study.
2.6. Assessment of nutritional status
The nutritional status of hemodialysis patients was assessed according to the criteria of the "International Society of Renal Nutrition and Metabolism (ISRNM)" for the selected indicators .
The body mass index (BMI) was calculated from the dry weight defined by the weight for which the patient does not show signs of extracellular dehydration or signs of fluid overload.
In the study, a chronic hemodialysis patient with one of the following criteria was considered malnourished: a body mass index of less than 23 kg/m (BMI < 23 kg/m ), an arm circumference of less than 29 cm (MUAC < 29 cm) and albuminemia less than 38 g/L (ALB < 38 g/L).
Obesity was defined by a body mass index greater than or equal to (BMI ).
Abdominal obesity was defined by a waist circumference greater than 88 cm (TT > 88 cm) in women and a waist circumference greater than 102 cm (TT > 102 cm) in men included in the study.
The determination of the eating habits of hemodialysis patients was based on eight (08) food groups and their consumption frequencies. It is:
Group 1 (Fruits and vegetables): Apple, orange, mangoes, pineapple, avocado, spinach, fresh or dried baobab leaves, ademin, dates, tigernuts, okra leaves, onion, eggplant, carrots, sugar beets, cucumber, etc..
Group 2 (Cereals and legumes): Rice, maize, white beans, peas, millet, sorghum, etc.
Group 3 (Dairy products): Milk, cheese made from cow's milk or soy, yogurt, dêguê, etc.
Group 4 (Meat, fish and seafood): Red meats (beef, goat, mutton), white meats (chicken, duck, guinea fowl), fish (tilapia), shrimps, crabs, lobsters, mussels, etc.
Group 5 (High-fat foods): Butters, peanut paste, donuts, cakes, botokoin, etc.
Group 6 (Sweet products): Sweet bread, sweets, chocolate, sugar, etc.
Group 7 (Salty foods): Salt, salty bread, sausages, ham, etc.
Group 8 (Caffeinated drinks): Nest coffee, tea, coca cola drink.
The potential identification of incriminating diets in the alteration of nutritional status was based primarily on dietary restrictions in hemodialysis patients.
2.7. Statistical analyzes
Data collection and entry were performed using the KoboToolbox server. Data processing and analysis were done with Epiinfo software version 7.2 and Microsoft Excel 2013. The comparison of proportions was made by Mantel Haenszel's Chi-square ( ) test with a significance level of 5% (p < 0.05). The search for associations between the variables was made based on a risk ratio or relative risk (RR) according to the conditions of application. The Pearson correlation between various indicators of protein-energy malnutrition was also used for the quantitative variables with a significance level of 5% (p < 0.05). The different proportions were calculated with a 95% confidence interval.
III. RESULTS
3.1. Sociodemographic, clinical, anthropometric and biological characteristics.
The study included 32 patients with an average age of years. It involved 50% women and 50% men, i.e. a sex ratio of 1 (Table 1). The main pathologies associated with chronic renal failure (CRF) were arterial hypertension (38.46%), followed by diabetes (15.38%) in the chronic hemodialysis patients surveyed. Sociodemographic characteristics, medical history (diabetes, hypertension, length of hemodialysis), dietary restrictions, anthropometric and biological parameters are presented in Table 1.
Table 1: Demographic, clinical, anthropometric and biological characteristics.
| Variables | Hemodialysis patients (n=32) |
| Average age (years) | 53,17 ± 14,37 |
| Hemodialysis centers | |
| Unidial Clinic n (%) | 19 (59,38%) |
| Martin Luther King Clinic | 7 (21,88%) |
| CMS Hajj House | 6 (18,75%) |
| Sex ratio (M/F) | 1 (a man for a woman) |
| Pathologies associated with CRF | |
| High blood pressure n (%) | 10 (38,46%) |
| Diabetes n (%) | 4 (15,38%) |
| Seniority in hemodialysis | |
| < 5 years n (%) | 31 (96,88%) |
| ≥ 5 years n (%) | 1 (3,13%) |
| Average BMI (Kg/m2) | 22,25 ± 4,61 |
| BMI < 23 Kg/m2n (%) | 17 (53,13%) |
| BMI ≥ 30 Kg/m2n (%) | 2 (6,25%) |
| Average waist circumference (cm) | 90,13 ± 18,43 |
| Women's waist circumference > 88 cm n (%) | 7 (43,75%) |
| Men's waist circumference > 102 cm n (%) | 4 (25,00%) |
| Mean arm circumference (cm) | 26,34 ± 4,57 |
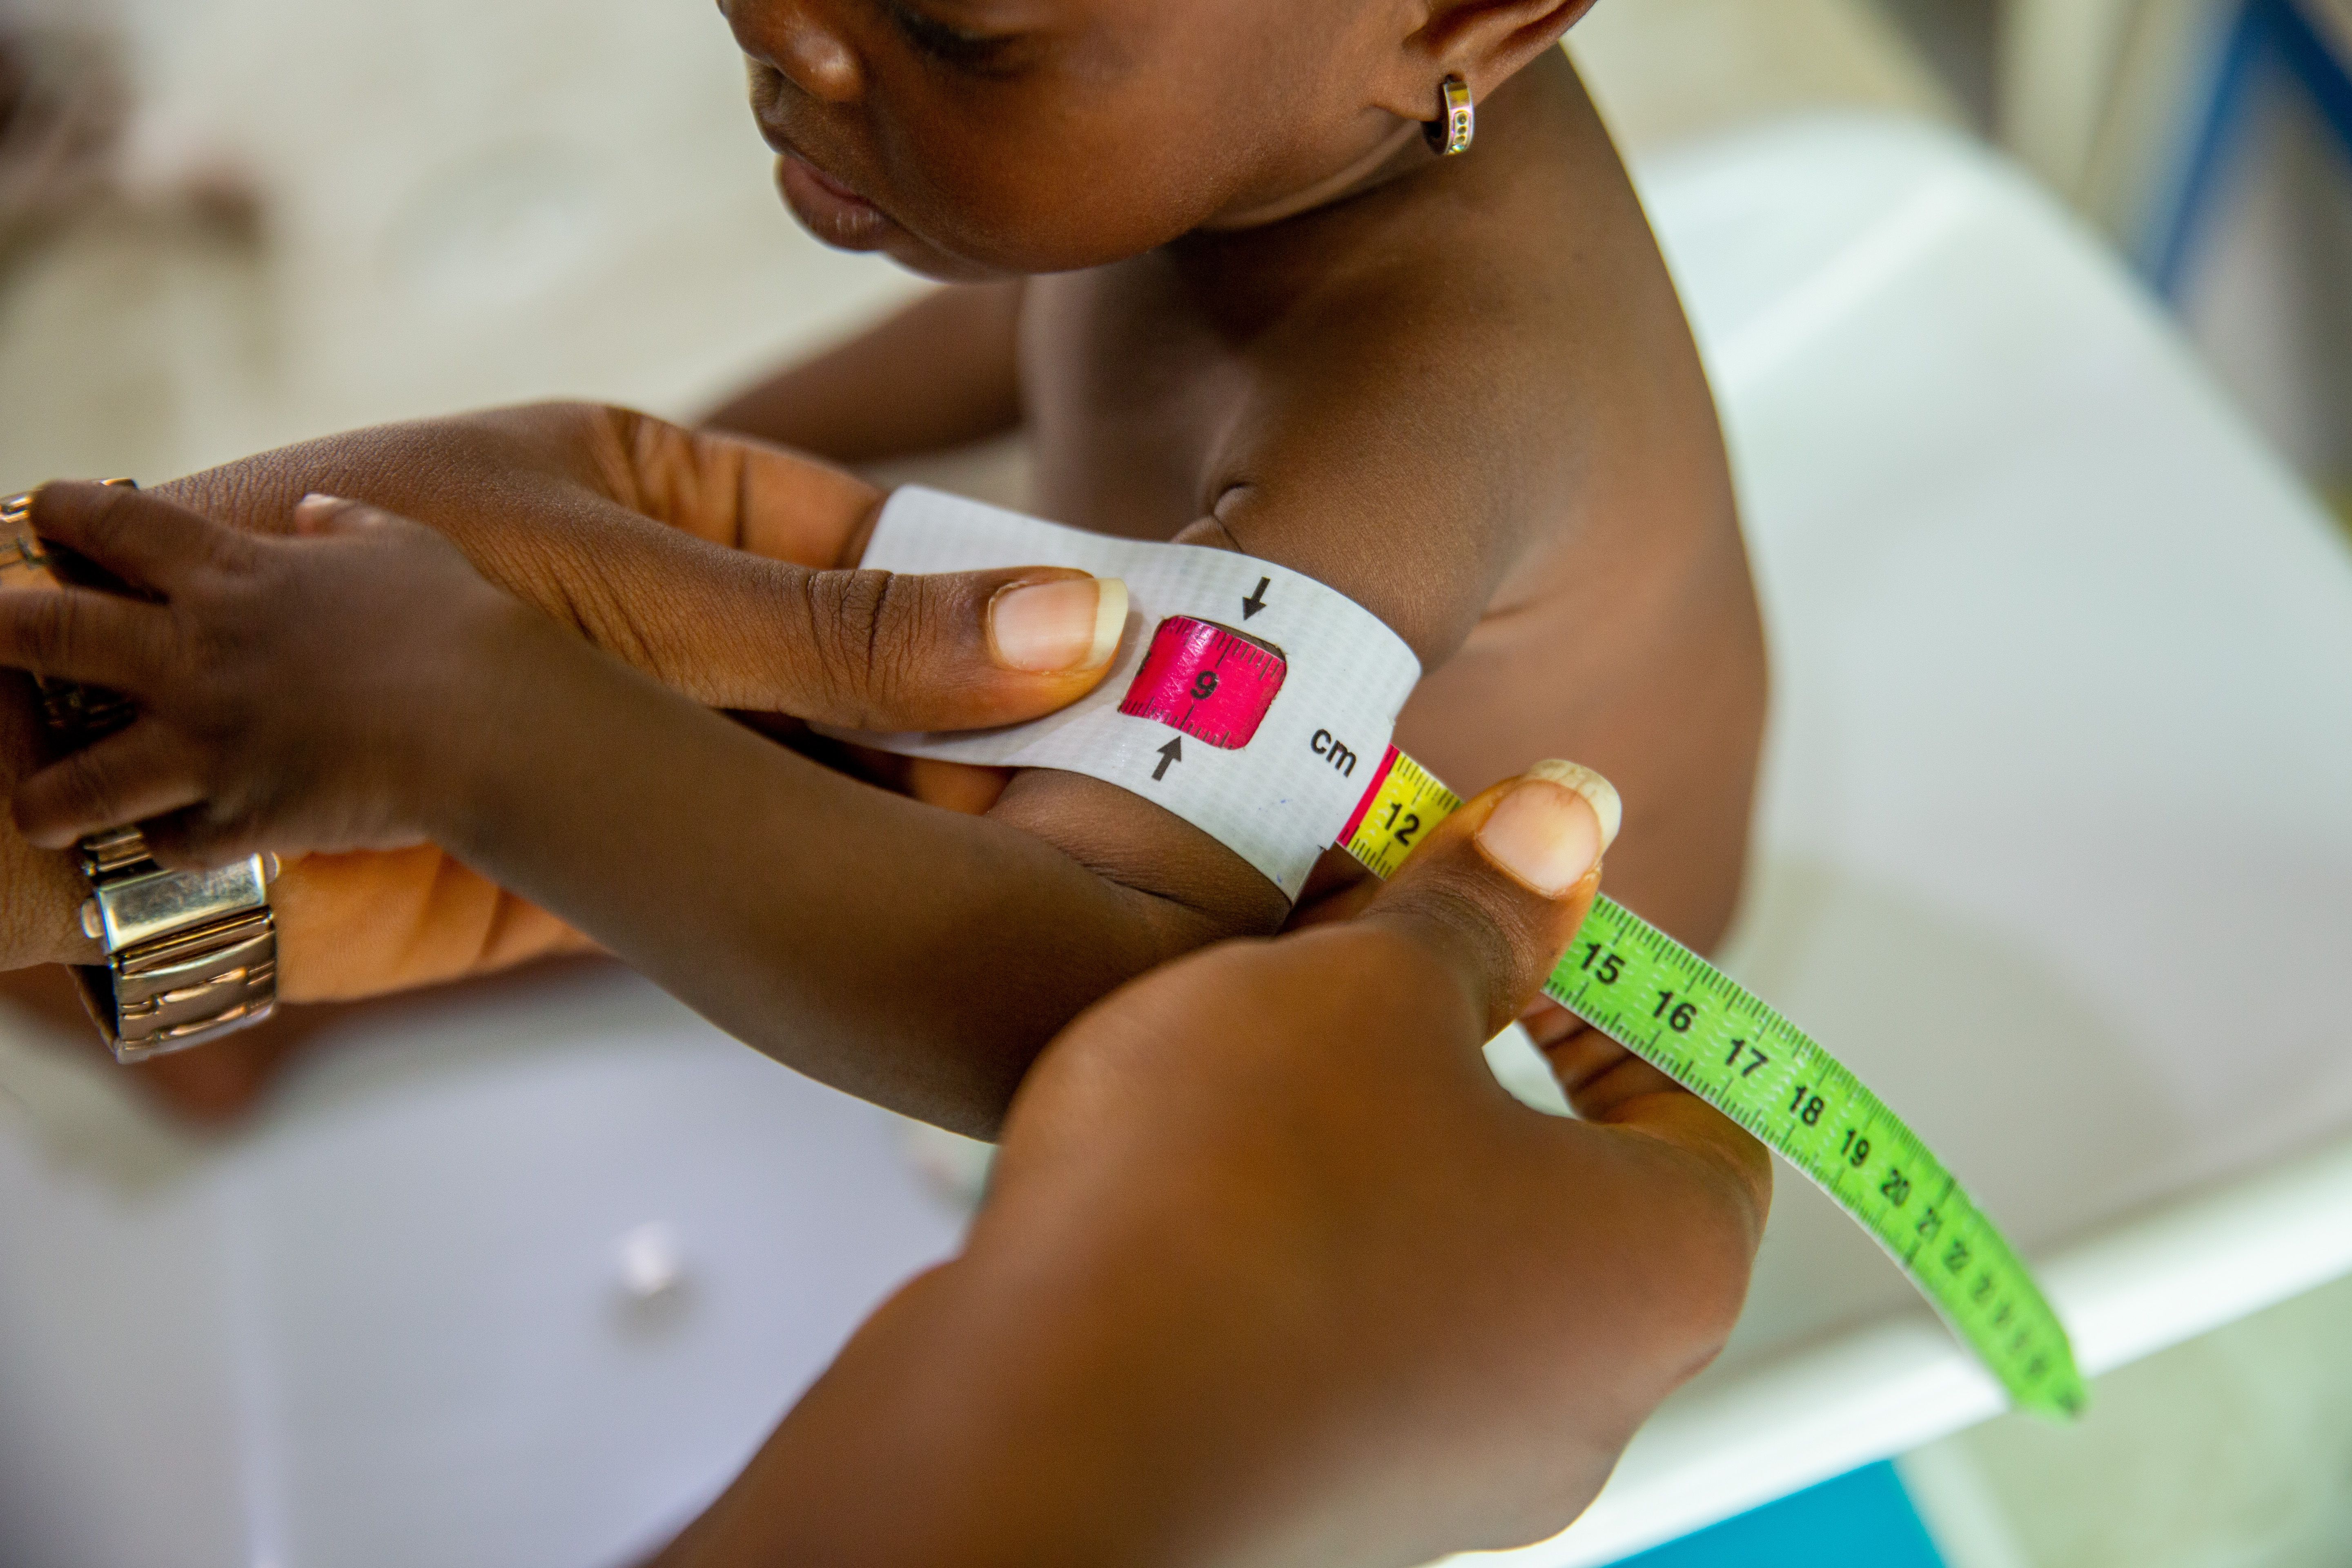
| Mid-upper arm circumference (MUAC) < 29 cm n (%) | 20 (62,50%) |
| Mean albumin (g/L) | 35,21 ± 6,52 |
| Albuminemia < 38 g/L n (%) | 21 (65,63%) |
The prevalence of protein-energy malnutrition therefore varied from 53.13 to 65.63% depending on the indicator used (Table 1).
The matrix of the different correlations between various indicators of protein-energy malnutrition in chronic hemodialysis patients is presented in Table 2.
Table 2: Pearson correlations between various indicators of PED in chronic hemodialysis patients in the hemodialysis centers surveyed. NS: Not significant; MUAC: Mid-upper arm circumference; BMI: Body Mass Index; ALB: Albuminemia; r: Pearson correlation coefficient; p: the statistical probability; n: sample size; : Statistical significance of the correlations: ; ; .
| Variables | n | r | p | Significance | |
| BMI | MUAC | 32 | 0,96 | 0,0000 | **** |
| BMI | Waist size | 32 | 0,93 | 0,0291 | * |
| MUAC | ALB | 32 | 0,89 | 0,0684 | NS |
| MUAC | Age | 32 | 0,1689 | 0,3554 | NS |
| MUAC | Waist size | 32 | 0,89 | 0,1290 | NS |
| MUAC | ALB | 32 | 0,90 | 0,0461 | * |
| MUAC | Age | 32 | 0,1017 | 0,5796 | NS |
| ALB | Age | 32 | -0,0433 | 0,8140 | NS |
| ALB | MUAC | 32 | 0,93 | 0,0001 | *** |
| ALB | Waist size | 32 | 0,94 | 0,0240 | * |
| Waist size | Age | 32 | 0,3425 | 0,0550 | NS |
3.2. Prevalence of PED according to anthropometric parameters
The prevalence of PED according to arm circumference (MUAC) was 62.50% (95% CI: 43.69-78.90). MUAC was significantly correlated with serum albumin (r = 0.90; p < 0.05) (Table 2). The correlation between MUAC and waist circumference was not significant (r = 0.89; p > 0.05).
The prevalence of PED defined by BMI < 23 kg/m2 was 53.13% (95% CI: 34.74-70.91). BMI was significantly and positively correlated with MUAC (r = 0.96; p < 0.001) and waist circumference (r = 0.93; p < 0.05) (Table 2). The correlations between BMI and serum albumin (r = 0.89; p > 0.05) and between BMI and age (r = 0.1689; p > 0.05) were not significant (Table 2).
3.3. Prevalence of PED according to biological parameters
The prevalence of PED according to serum albumin was 65.63% (95% CI: 46.81-81.43). Serum albumin was significantly and positively correlated with MUAC (r = 0.93; p < 0.001) and waist circumference (r = 0.94; p < 0.05) (Table 2). The correlation between serum albumin and age was negative and not significant (r = -0.0433; p > 0.05).
3.4. Prevalence of obesity
The prevalence of obesity defined by BMI 30 kg/m in the study was 6.25% (95% CI: 0.77-20.81) in the patients surveyed (Table 1).
3.5. Prevalence of abdominal obesity according to waist circumference (WC)
The prevalence of abdominal obesity defined by a waist circumference of > 88 cm was 43.75% (95% CI: 19.75-70.12) in the chronic hemodialysis women surveyed (Table 1).
The prevalence of abdominal obesity defined by a waist circumference of >102 cm was 25.00% (95% CI: 7.27-52.38) in the chronic hemodialysis men surveyed (Table 1).
3.6. Eating habits
The present study reported that 100% of the patients surveyed consumed fruits and vegetables and 50% consumed them very often (Figure 1).
In the study, 96.88% of the patients surveyed consumed cereal and legume products and 43.75% consumed them very often (Figure 2).
The consumption of dairy products reported by the study was 71.88% among the patients surveyed and 18.75% consumed them very often (Figure 3).
All chronic hemodialysis patients surveyed consumed meat, fish and seafood, i.e. 100% and 81.25% consumed them very often (Figure 4).
The present study showed that 53.12% of the patients surveyed consumed high-fat foods with only 6.25% consuming them very often (Figure 5).
In the study, 53.12% of the patients surveyed consumed sweet products and 15.62% consumed them very often (Figure 6).
The consumption of salty foods was observed in 50% of the patients surveyed and only 3.12% consumed them very often (Figure 7).
Among the respondents, 43.75% of the patients surveyed consumed beverages containing caffeine and only 6.25% consumed them very often (Figure 8).
The present study reported that 65.62% of the patients surveyed consumed an amount of water between 0.5 to 0.75 L/day (Figure 9).
{"image_source":{"path":"images/837a7f988237152b13c73f7b218748d351161b9f5b8bcdc808c50cc007642a3b.jpg"},"content":"","chart_caption":[{"type":"text","content":"Figure 1: Distribution of chronic hemodialysis patients according to the frequency of fruit and vegetable consumption."}],"chart_footnote":[]} {"image_source":{"path":"images/291594acd2066866423e1bee31e770974c95bd6715f4e72a6f10b4dfa08dced8.jpg"},"content":"","chart_caption":[{"type":"text","content":"Figure 2: Distribution of hemodialysis patients according to the frequency of consumption of cereal products and vegetables."}],"chart_footnote":[]}
{"image_source":{"path":"images/d40492f4bc2a4509c8f2ce788f01f86a1c789fc766476fe6945097f5bf55692f.jpg"},"content":"","chart_caption":[],"chart_footnote":[]} {"image_source":{"path":"images/017923bdd39b51a68e2f071f299c67ac62f250a34292eef1ecc4b1517fe73f1c.jpg"},"content":"","chart_caption":[{"type":"text","content":"Figure 3: Distribution of hemodialysis patients according to the frequency of consumption of dairy products."},{"type":"text","content":"Figure 4: Distribution of hemodialysis patients according to the frequency of consumption of meat, fish and seafood."}],"chart_footnote":[]}
{"image_source":{"path":"images/72e2e44b875063dff5a1c80fb7ebc52540dcc97ecb8d21a0aad7020964bbf285.jpg"},"content":"","chart_caption":[],"chart_footnote":[]} {"image_source":{"path":"images/17b266e5787b30ad289652bd30c41e6abc0f450248a587b48914309cb10667bd.jpg"},"content":"","chart_caption":[{"type":"text","content":"Figure 5: Distribution of hemodialysis patients according to the frequency of consumption of high-fat foods."}],"chart_footnote":[]}
{"image_source":{"path":"images/db48f62a82ffc132fdbb278f9cf13bb4a6707356644a50890e577c77456ad9ef.jpg"},"content":"","chart_caption":[{"type":"text","content":"Figure 6: Distribution of hemodialysis patients according to the frequency of consumption of sugary products."},{"type":"text","content":"Figure 7: Distribution of hemodialysis patients according to the frequency of consumption of salty foods."}],"chart_footnote":[]} {"image_source":{"path":"images/e4b264d0ba7477fd331813141d0199129d5e333967528cdc6a2d08febc899a80.jpg"},"content":"","chart_caption":[],"chart_footnote":[]}
{"image_source":{"path":"images/28d7b53918bb060d3d7df8dde9c846a6c2e3a680e6ca6322776d4fd4a37d079f.jpg"},"content":"","chart_caption":[{"type":"text","content":"Figure 8: Distribution of hemodialysis patients according to the frequency of consumption of beverages containing caffeine."},{"type":"text","content":"Figure 9: Distribution of hemodialysis patients according to the amount of water consumed per day."}],"chart_footnote":[]}
3.6. Food restriction
Of the patients surveyed, 87.5% had received dietary restrictions from their nephrologists. The different proportions of respondents according to restricted foods are shown in Figure 10.
{"image_source":{"path":"images/c179ccb2783ba59bccadfd783ac197297a3e3cbc41a8e9aa9435423b6041ee20.jpg"},"content":"","chart_caption":[],"chart_footnote":[{"type":"text","content":"Others: Grapes, foufou, broths, salt, plantains, apple fruit."}]}
Figure 10: Distribution of respondents according to the different types of restricted foods.
The main incriminating diets in the deterioration of the state of health of hemodialysis patients included in the present study, were related to protein intake and insufficient energy intake related to food restriction in these patients.
3.7. Analytical study
The prevalence of EPD according to serum albumin was 57.14% in female patients and 42.86% in male patients (Table III). This difference is not statistically significant (Khi2 = 1.2078 and p > 0.05).
Table 3: Prevalence of PED according to anthropometric and biological indicators according to the sex of the patients surveyed.
| Sexe | Effectif (n) | Prevalence (%) |
| Périmètre brachial (PB) | ||
| Female | 12 | 60,00 |
| Male | 8 | 40,00 |
| Total | 20 | 100,00 |
| Body Mass Index (BMI) | ||
| Female | 11 | 64,71 |
| Male | 6 | 35,29 |
| Total | 17 | 100,00 |
| Albuminemia (ALB) | ||
| Female | 12 | 57,14 |
| Male | 9 | 42,86 |
| Total | 21 | 100,00 |
The hazard ratio (RR) was also 1.33. This ratio was then greater than 1 (RR >1); which means that female patients are 1.3 times more likely to suffer from protein-energy malnutrition than male patients according to serum albumin.
The prevalence of EPD according to arm circumference was 60% in female patients and 40% in male patients (Table III). This difference is not statistically significant (Khi2 = 2.0667 and p > 0.05) with a risk ratio (RR) of 1.50. This ratio was then greater than 1 (RR >1); which means that female patients are 1.5 times more likely to suffer from protein-energy malnutrition than male patients according to arm circumference.
The prevalence of EPD according to body mass index was 64.71% in female patients and 35.29% in male patients (Table III). This difference is not statistically significant (Khi2 = 3.0392 and p > 0.05) and the hazard ratio (RR) was 1.8333. This ratio was also greater than 1 (RR >1); which means that female patients are 1.83 times more likely to suffer from protein-energy malnutrition than male patients according to body mass index. The prevalence of EPD according to body mass index was 64.71% in female patients and 35.29% in male patients (Table III). This difference is not statistically significant (Khi2 = 3.0392 and p > 0.05) and the hazard ratio (RR) was 1.8333. This ratio was also greater than 1 (RR >1); which means that female patients are 1,83 times more likely to suffer from protein-energy malnutrition than male patients according to body mass index.
IV. DISCUSSION
The results of the present study were discussed in the light of the literature in relation to previous studies.
The average age of hemodialysis patients for chronic renal failure observed in the present study (53.13 ± 14.37 years) slightly exceeded those reported by Fadli et al. (2018) (44.21 ± 3.65 years) in Algeria and by Delma et al. (2020) (44.76 ± 15.5 years) in Burkina. This difference in average age could be explained by a relatively young population surveyed in Algeria and Burkina compared to that concerned by this study.
A strong positive and significant correlation was observed between BMI and arm circumference (r = 0.96; p < 0.001) on the one hand, and between BMI and waist circumference (r = 0.93; p < 0.05) on the other hand in the present study. Delma et al. (2020) also showed a good correlation between BMI and MUAC (r = 0.883; p < 0.001) and also between BMI and waist circumference (r = 0.910; p < 0.001). This means that variations in BMI influence those in arm circumference (MUAC) and waist circumference and vice versa.
A positive and significant correlation was observed in the present study between arm circumference and serum albumin (r = 0.90; p < 0.05). Delma et al. (2020) also showed that arm circumference is correlated with serum albumin (r = 0.439; p < 0.05). This means that variations in MUAC also affect serum albumin and vice versa.
Arterial hypertension (HTA), as the main pathology associated with chronic renal failure (CRI) in the present study (38.46%), was also reported by Ahmadi and Cherfi (2019) (37%) in Algeria and by Delma et al. (2020) (89.3%) in Burkina. This similarity to hypertension as the main pathology associated with CKD in several studies confirms that hypertension is a risk factor and/or an aggravating factor for CKD.
In the present study, the evaluation of the nutritional status of chronic hemodialysis patients showed that the main nutritional problem is PED, whose prevalence varied between 53.13 and 65.63% depending on the indicator considered. This prevalence of PED falls within the range reported by Delma et al. (2020) where PED varied between 17 and 70.20% in Burkina and by Keita et al. (2018) where this PED varied between 10.3 and 55.9% in Senegal depending on the indicator used.
The prevalence of PED according to MUAC observed in the present study (62.50%) was close to that reported by Delma et al. (2020) (66%) in Burkina and well above that reported by Keita et al. (2018)
(25%) in Senegal. These high prevalences of PED observed could be explained by insufficient protein intake due to dietary restriction compared to protein sources, especially of animal origin, in hemodialysis patients.
The prevalence of PED according to BMI observed in the present study (53.13%) was below that reported by Saile et al. (2016) (63.50%) in Morocco and by Delma et al. (2020) (70.20%) in Burkina and moderately above that reported by Keita et al. (2018) (47.1%) in Senegal. This difference in prevalence could be explained by a very high insufficiency of protein-energy intakes in patients surveyed in Morocco and Burkina compared to those surveyed in Senegal and in the present study.
The prevalence of PED according to serum albumin in the present study (65.63%) was moderately above that reported by Sail et al. (2016) (58.00%) in Morocco and by Delma et al. (2020) (59.60%) in Burkina and well above that reported by Keita et al. (2018) (10.3%) in Senegal. This difference in prevalence could also be explained by a very high insufficiency of protein intake in patients surveyed in Senegal compared to those surveyed in Morocco, Burkina and in the present study.
The prevalence of obesity in the present study (6.25%) was similar to those reported by Delma et al. (2020) (4.2%) in Burkina and by Kéita et al. (2018) (8.8%) in Senegal. However, the difference between these prevalences could be explained by a high number of obese patients included in the present study and that of Senegal compared to those included in the study in Burkina.
V. CONCLUSION
The objective of this study was to contribute to the management and improvement of the quality of life of hemodialysis patients in Togo. To this end, it was a question of knowing the eating habits and evaluating the nutritional status of the latter. The evaluation of nutritional status was based mainly on anthropometric and biological parameters. The "International Society of Renal Nutrition and Metabolism (ISRNM)" criteria for the indicators retained from 2008 were used for the evaluation of the nutritional status in the chronic hemodialysis patients included in the study.
The results obtained following this evaluation showed that the main nutritional problem in the patients considered is protein-energy malnutrition (PED), with a high prevalence that varied according to the indicator used. PED therefore constitutes a health problem in chronic hemodialysis patients followed in the hemodialysis centers considered. The risk factors for undernutrition are mainly insufficient food intake linked in particular to protein restriction and a drop in energy reserves in these patients. In view of the high prevalence of PED in the hemodialysis patients surveyed, early diagnosis and appropriate and rigorous nutritional management are necessary to restore good nutritional status in these patients and reduce the frequency of pathologies associated with the insufficiency chronic kidney disease thus providing them with a better quality of life. The provision of oral nutritional supplements and parenteral nutrition bags is then necessary. The involvement of a specialist in food hygiene or nutrition and dietetics would also be a great asset for the care of hemodialysis patients.
Declaration of interests
The authors declare that they have no conflict of interest in relation to this study.
Conflict of Interest
The authors declare no conflict of interest.
Ethical Approval
Not applicable
Data Availability
The datasets used in this study are openly available at [repository link] and the source code is available on GitHub at [GitHub link].
Funding
This work did not receive any external funding.
References
Cite this article
Related Research


Special Issue
Launch a focused special issue to highlight research, emerging trends, and expert insights in your academic field.
