




IntelliPaper
Abstract
Background: Diabetes mellitus (DM) has a global prevalence of 536.6 million people, which an estimated rise of 12.2% by 2045. Diabetes management is expensive, hence alternate management options are being explored. The World Health Organization recognizes some plants and plant-based meals as excellent diabetes treatment agents. These include cocoyam (CYN), soya bean (SB), and Bambara groundnut (BGN). The purpose of this study was to evaluate these extracts' hypoglycemic, weight changes and histological effects.
Methodology: CYN, SB, and BGN were sourced and processed to generate high-quality flour, which were pelletized and oven-dried at 60°C, before storage. The eighty-two male albino rats weighing between 134 and 247 g, were administered with low-dose fructose to induce insulin resistance. Type 2 diabetes mellitus (T2DM) was induced with intraperitoneal injection of streptozotocin, following which a 28 days intervention formulations were administered. Throughout the investigation, the weights of the rats were recorded while on the 28th day, their organs and blood samples were collected from killed rats for histological examination and blood glucose analysis respectively.
Results & Discussion: The investigation revealed an average random blood glucose (RBG) levels that varied significantly over time for each group, displaying a consistent pattern of changes across the entire group from week 1 to week 4 (F=79.106, p
Explore Digital Article Text
I. INTRODUCTION
Diabetes mellitus, an endocrine and metabolic disease, affects an estimated 536.6 million people globally (10.5%), and it is expected to rise by 12.2% among those aged 20 to 79, potentially affecting 783.2 million people by 2045 . Hyperglycemia is caused by abnormalities in pancreatic cells or insufficient insulin secretion, which can lead to a variety of health issues including ketoacidosis, heart failure, renal failure, and blindness . Diabetes mellitus is becoming increasingly common in low-income countries such as Nigeria, with higher rates of occurrence, prevalence, and daily adjusted life years (DALYs) than in high-income countries .
Diabetes management requires large financial resources, a workforce, healthcare infrastructure, and the treatment of associated problems . This leads to lower productivity, a shorter life expectancy, and a lower quality of life for individuals. The enormous financial burden and problems of addressing diabetes complications provide a significant barrier in countries with poor healthcare systems and inadequate resources . As a result, there is an urgent need to find more cost-effective techniques for reducing the prevalence, severity, and effects of diabetes using available resources, particularly in developing countries.
It has been discovered that complementary management strategies like adopting suggested eating patterns and increasing physical activity, can considerably lower the risk factors linked to diabetes. As a result, there are fewer new instances, the condition is less severe, and the consequences associated with it are reduced . Diabetic Medical Nutrition Therapy, the nutritional management of diabetes, is centred on developing a customized nutrition treatment plan based on evidence that takes into account many variables, such as how well an individual's lifestyle and insulin are matched . Research has demonstrated that dietary changes can lessen the difficulties associated with diabetes mellitus .
It is well known that eating plant-based foods and plants can effectively treat diabetes. The use of medicinal plants to treat diabetes and other illnesses has been recognized by the World Health Organisation . Antioxidant and anti-inflammatory bioactive components are present in some of these therapeutic plants. Examples include the Fabaceae bean Bambara groundnut (vigna underground), which is high in lipids (10%), protein (15–17%), and carbs (57–67%) . Furthermore, major amounts of vital vitamins and minerals, including vitamin A, niacin, riboflavin, and carotene, as well as important phytochemicals and bioactive compounds, such as phenolics , dietary fibres , fatty acids, including PUFA and MUFA , peptides, and amino acids are also present in bambara groundnuts.
Tocopherols, tocotrienol, and oxysterols, in particular, have many advantageous characteristics, including immune system stimulation, antioxidant and antimicrobial effects, decreased platelet aggregation, hormone metabolism regulation, and enzyme detoxification . It has been discovered that phenolic chemicals inhibit enzymes that help convert starch to glucose, such as -amylase and -glucosidase . Furthermore, in diabetic rats, Bambara groundnut can enhance peripheral glucose absorption, which results in hypoglycemic effects .
Although high in carbohydrates, roots and tubers with a low glycaemic index include cocoyam. Research has demonstrated that cocoyam possesses immunomodulatory and anti-hyperglycemic qualities in both in vitro and in vivo settings. Though in different proportions, these foods include bioactive substances such as polyphenols, flavonoids, amino acids, and peptides. Titerpenoids, alkaloids, flavonoids, phenolics, and peptides are among the bioactive ingredients that have been shown to activate hepatic enzymes and pancreatic -cells in rats, resulting in the normalization of blood glucose levels .
Many studies have indicated that the phytochemicals found in cocoyam have antioxidant and hypoglycemic qualities . Eleazu and colleagues suggested that these chemicals may have anti-diabetic properties because they can suppress acute pancreatitis and delay or regulate the conversion of starch to glucose. Aloe vera leaf extract , Mangifera indica seed kernel , and allium sativum L bulb extract are other plants that have been linked to anti-diabetic effects. The purpose of this study was to evaluate in diabetic rats the anti-hyperglycemic and biochemical benefits of eating cocoyam flour, a plant-based diet.
Glycine max. (L) Merrill, sometimes known as soya beans, are a leguminous crop that is high in protein and oil. It is eaten in a variety of ways, including tofu, textured vegetable protein (TVP) or textured soy protein (TSP), tempeh, roasted, boiled, in soymilk, mayonnaise, miso, cheese, and soy yoghurt. In terms of nutrition, each 100g of it has 30–50g of protein, 20–35g of carbs, and 15–25g of fats. PUFA makes up the majority of the lipid composition (63%), followed by MUFA (21.5%) and SFA (15%). In addition to vitamins E, K, A, and C, minerals including calcium, iron, zinc, salt, potassium, magnesium, copper, and phosphorus, soya beans also include folates, thiamine, riboflavin, pyridoxine, and niacin. Bioactive peptides, oxalates, isoflavones, and phytic acids are some of the phytochemicals found in soybeans. Antioxidant qualities are exhibited by the soybean's inositol triphosphate (IP3) and inositol tetraphosphate (IP4).
It has been discovered that the peptides exhibit immunomodulatory and antioxidative properties and in both human and animal studies, soybean and its bioactive components dramatically reduce blood levels of triglycerides and cholesterol . Because isoflavones interact with -estrogen receptors in the liver, they increase the number of hepatic receptors for LDL-C, which helps break down cholesterol and oxidize fatty acids, which is why lipid levels have decreased . This study aimed to evaluate in greater detail the anti-hyperglycemic and biochemical benefits of feeding diabetic rats a plant-based diet called Bambara groundnut flour.
II. MATERIALS AND METHODS
2.1 Collection and Preparation of the Plant Food Material
The Vigna subterranean had been recognised by a plant taxonomist after it was purchased from a reputable local market. The sample was processed by giving it a thorough wash, peeling it, and soaking it in water for ten minutes. It was then washed, brought to a boil, and dried in an oven set to C until it reached a uniform weight. After that, the dried weight was converted into pellets, coarsely crushed into flour, and baked at C until a consistent weight was attained. The pelletized foods were kept in a tightly closed container until they were needed to feed the rats. Plant taxonomist NCe 005 recognized the roots of a Colocasia Esculenta variety known as edeofe in South East Nigeria, which was purchased from a well-known local market. Similar processing procedures were applied to the sample, including washing, peeling, soaking, rinsing, boiling, and oven drying at C, until a consistent weight was noted.
The dry weight had to be ground into fine flour to create pellets, which had to be dried in an oven at 600C until they reached a constant weight. Then, for eventual use in feeding the rats, these pelleted feed items were stored in a sealed container. A botanist confirmed the origins of the glycine max. (1) Merrill roots, which were then thoroughly cleaned, peeled, and soaked in water for ten minutes. The roots were obtained from a reputable local market. The roots were then cleaned, brought to a boil, and dried at 600 degrees Celsius in an oven until they reached a consistent weight. To ensure a consistent weight, the dry weight was again ground into fine flour, pelletized, and dried in an oven at 60° degrees Celsius. Before feeding the rats, the resultant pelletized feed was kept in a sterile, airtight container.
III. EXPERIMENTAL ANIMALS
A reliable breeder provided sixty-four male albino rats, weighing between 134 and 249 grammes. They were kept in groups of eight per cage and their weights were recorded every week. Using a permanent marker, each rat in a group was assigned a number between 1 and 8 on its tail. After that, for a week leading up to the start of the experiment, they were given commercial rat meal and unrestricted access to water while being kept in a 12-hour light/12-hour dark cycle at a room temperature of C to C. The work complied with the NRC's ethical criteria for using, caring for, and treating laboratory animals.
3.1 Induction of Insulin Resistance using Low Fructose Diet
Male albino rats that had been acclimated were given a diet that included 10% fructose at a low dose to establish insulin resistance. Fructose (30 grams) was dissolved in 300 millilitres of water to generate this diet. After a week-long acclimatization period, the rats were given this fructose solution as their drinking water at a rate of 25 millilitres ad libitum for two weeks. Rat feeds were freely available to all of the rats in an equal amount.
3.2 Induction of Type 2 Diabetes Mellitus using STZ
Male albino rats that had been acclimated were given a diet that included 10% fructose at a low dose to establish insulin resistance. Fructose (30 grams) was dissolved in 300 millilitres of water to generate this diet. After a week-long acclimatization period, the rats were given this fructose solution as their drinking water at a rate of 25 millilitres ad libitum for two weeks. Rat feeds were freely available to all of the rats in an equal amount.
All groups were treated for a total of 28 days as part of the trial. Metformin 200 mg/kg/day orally administered via an oral dispenser and commercial rat meal were administered to the standard and normal control groups, respectively. The remaining groups were given various intervention formulations, as described by Nnadi and colleagues , which consisted of 50% intervention feed and 50% commercial rat feed (Table 1). In the experimental protocol, the precise group assignments were specified.
Table 1: Groups and Assigned Intervention Formulations
| Groups | Status | Formulations | Formulation Composition |
| A | Intervention Group | 1 | 16.6%CY: 16.6%SB: 16.6%BGN: 50%RF |
| B | Standard Control | RF + Metformin | 100 Commercial Rat Feed (RF) |
| C | Normal Control | RF | 100 Commercial Rat Feed (RF) |
| D | Negative Control | RF | 100 Commercial Rat Feed (RF) |
| E | Intervention Group | 2 | 12.5%CY: 12.5%SB: 25%BGN: 50%RF |
| F | Intervention Group | 4 | 12.5%CY: 25%SB: 12.5%BGN: 50%RF |
| G | Intervention Group | 7 | 0%CY: 50%SB: 0%BGN: 50%RF |
| H | Intervention Group | 5 | 0%CY: 0%SB: 50%BGN: 50%RF |
| I | Intervention Group | 6 | 50%CY: 0%SB: 0%BGN: 50%RF |
| J | Intervention Group | 3 | 25%CY: 12.5%SB: 12.5%BGN: 50%RF |
IV. RESULTS
3.3 Estimation of Blood Glucose
At the end of 28 d, the rats were fasted overnight and the following morning, their final body weights measured using a weighing scale, and the blood glucose concentrations were estimated using a glucometer (Acu-check activeR).
After the rats were fed for 28 days, they were put to sleep using ethyl acetate, which was put inside cotton wool in a beaker with a 1000 mL capacity. After that, the experimental rat was put in the beaker and given a quick moment to become completely unconscious. In addition to the body weight and feed consumption, the pancreas and liver were collected and weighed during this period. An electronic weighing balance (Modelscout Pro Ohaus Corporation, USA) was used to measure the weights. The data were analyzed and compared with the blood glucose levels that were monitored over time.
3.5 Histological Studies of Pancreas and Liver
After the animals were sacrificed, the livers and pancreas of those under diethyl ether anaesthesia were taken. After being dissected, the organs were stored in 10% buffered formalin, dried off using many alcohol treatments, and then embedded in paraffin wax. Hematoxylin and eosin (HE) dye were used to stain thin slices of 4-5 m that were cut with an American optical microtome, Model 82. The sections were then mounted on glass slides. A microscope was then used to examine the stained samples.
3.6 Statistical Analysis
The results were presented as the standard error of the mean (SEM), which was obtained from measurements taken three times, with eight rats in each group. Version 20.0 of the Statistical Package for the Social Sciences (SPSS Inc., Chicago, IL) was used for the analysis. One-way analysis of variance (ANOVA) was used to compare the mean values, and Tukey's posthoc test was used to identify statistically significant differences between the means at P\<0.05.
Effect on Blood Glucose {"image_source":{"path":"images/928b7fe135b5239a0b8821ac890ca33a245d1f29c74adce29339230122baf164.jpg"},"content":"","chart_caption":[{"type":"text","content":"Figure 1: Trend of Mean Random Blood Glucose Concentration for Groups A-J Over Time"}],"chart_footnote":[]}
The trend line graph in Figure 1 illustrates the average blood glucose levels over time for each Group. Except for a minor drop in week two, the results showed an overall increase in mean glucose levels throughout time. The average glucose levels in Group C were the lowest and stayed comparatively constant throughout time. Comparing each group's mean glucose levels over time to the others, the ANOVA analysis showed that each group's mean levels fluctuate significantly (F=13.963, p\<0.001). Additionally, the data showed a comparable pattern for every Group from week 1 to week 4, indicating that they were substantially parallel (F=79.106, p\<0.01), with a noteworthy upward tendency from week 1 to week 4.
Table 2: Showing the Results of the Analysis of Rat Body Weight Values within each group over time
| Groups | Week 1Mean (SEM) | Week 2Mean (SEM) | Week 3Mean (SEM) | Week 4Mean (SEM) | Day of SacrificeMean (SEM) | |
| A | 225.43(14.91) | $222.00(18.36)^a$ | $226.00(15.73)^a$ | $232.57(16.46)^a$ | $204.86(16.76)^a$ | |
| B | 238.00(16.69) | $217.75(23.12)^a$ | $244.50(26.07)^a$ | $253.00(30.47)^a$ | $228.00(28.59)^a$ | |
| C | 276.88(10.17) | $288.00(11.17)^b$ | $301.75(9.78)^b$ | $301.38(8.86)^b$ | $280.75(9.46)^b$ | |
| D | 192.50(10.22) | $211.50(11.03)^a$ | $210.00(9.81)^a$ | $233.00(10.62)^a$ | $224.00(8.17)^a$ | |
| E | 222.17(15.96) | $218.83(15.43)^a$ | $214.17(14.64)^a$ | $234.50(15.47)^a$ | $207.33(12.72)^a$ | |
| F | 249.14(14.59) | $220.43(10.17)^a$ | $228.86(10.24)^a$ | $250.57(12.90)^a$ | $230.86(13.69)^a$ | |
| G | 246.00(33.45) | $217.86(11.81)^a$ | $213.71(11.03)^a$ | $230.14(13.65)^a$ | $205.29(11.91)^a$ | |
| H | 237.67(32.57) | $207.33(16.07)^a$ | $213.67(17.91)^a$ | $245.67(14.23)^a$ | $220.00(12.53)^a$ | |
| I | 198.17(18.99) | $190.17(21.56)^a$ | $193.50(26.86)^a$ | $197.50(29.42)^a$ | $208.00(32.60)^a$ | |
| J | 226.00(6.91) | $219.40(7.60)^a$ | $222.60(8.14)^a$ | $225.60(8.21)^a$ | $206.00(6.14)^a$ | |
| F(p-value) | 1.48 | 4.02 | 5.22 | 3.65 | 3.07 | |
| p-value | 0.184 | 0.001 | <0.001 | 0.002 | 0.006 | |
| Repeated Measures TestMean values along the column with different alphabetical superscripts indicate significance (p<0.05) | ||||||
| Equal Level (Mean difference among Groups) | Parallelism (Pattern of all groups across time points) i.e. within/between group interactions | Flatness (Trend) | ||||
| F-value | p-value | F-value | p-value | F-value | p-value | |
| 4.141 | 0.001 | 4.060 | 0.001 | 5.663 | 0.004 | |
Table 2 showed changes in rat body weight of the different groups over time. Group C had the best weight gain followed by the standard control group and the rats in Group A.
{"image_source":{"path":"images/be749fff2385ea150604360b639434f3782b56790f327ce7be331d48ce99378d.jpg"},"content":"","chart_caption":[{"type":"text","content":"Comparing Rat Body Weight with Blood Glucose Level of Various Groups over Time"}],"chart_footnote":[]} {"image_source":{"path":"images/5cd39f6540a070241bcee31682ace0b0d965e957c107dc96f399100ea0fa98d0.jpg"},"content":"","chart_caption":[],"chart_footnote":[]}
Figures 2(a & b) show comparison graphs of the mean random blood glucose (right) and mean body weight (left) over some time (1-4 weeks) for rats with and without diabetes. The groups with the highest weight and weight gain over time were those with normoglycemia (Group C, Right). Likewise, Group I experienced the least amount of weight gain due to extremely high blood glucose.
Table 3: Result of the Analysis of Blood Glucose Concentration, relative Weight of liver, pancreas and weight variation
| Group | Blood Glucose Concentration Mean (SEM) | Relative Weight of Liver Mean (SEM) | Relative Weight of Pancreas Mean (SEM) | Weight Variation Mean (SEM) |
| A | $293.14(42.38)^b$ | $3.74(0.12)^{ab}$ | 0.240(0.08) | $-51.29(16.34)^b$ |
| B | $282.25(48.77)^b$ | $3.02(0.27)^{ab}$ | 0.165(0.00) | $-37.25(15.95)^{ab}$ |
| C | $76.38(2.81)^a$ | $2.69(0.15)^a$ | 0.170(0.01) | $6.25(3.49)^a$ |
| D | $338.67(6.86)^b$ | $4.42(0.41)^b$ | 0.185(0.03) | $-34.25(17.32)^{ab}$ |
| E | $302.00(30.98)^b$ | $3.40(0.14)^{ab}$ | 0.150(0.01) | $-50.67(19.12)^b$ |
| F | $361.14(19.38)^b$ | $3.81(0.16)^{ab}$ | 0.223(0.02) | $-59.43(7.92)^b$ |
| G | $318.00(43.35)^b$ | $3.77(0.25)^{ab}$ | 0.247(0.03) | $-48.43(14.09)^b$ |
| H | $327.50(45.15)^b$ | $3.78(0.23)^{ab}$ | 0.237(0.03) | $-57.67(8.37)^b$ |
| I | $285.25(74.12)^b$ | $3.64(0.40)^{ab}$ | 0.183 (0.02) | $-50.83(30.84)^b$ |
| J | $241.00(35.47)^b$ | $3.61(0.14)^{ab}$ | 0.207 (0.02) | $-68.00(6.4)^b$ |
| F(p-value) | 4.664 | 3.333 | 1.262 | 1.884 |
| p-value | <0.001 | 0.003 | 0.296 | 0.076 |
Mean values along the column with different alphabetical superscripts indicate significance (p\<0.05)
Table 3 presents the findings of the mean analysis for the mean glucose concentration, the relative weights of the pancreas, liver, and rats' weight fluctuations. The glucose concentration in Group C was found to be considerably (p\<0.01) lower, according to the results. There was no discernible variation in the glucose concentration across the other groups. The relative weight of the liver followed the same trend in terms of glucose concentration, with group C having the lowest mean weight and group D having the highest mean weight. There was no discernible variation in the pancreatic relative weight. Except for the control groups, there was no discernible
| Liver Histology | |
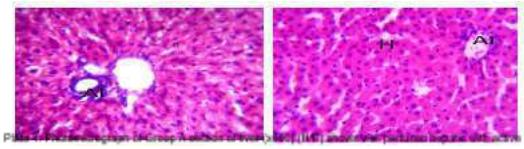 hepatocyte (H) and mild portal aggregate of inflammation (PAI)Plate 1: Group A hepatocyte (H) and mild portal aggregate of inflammation (PAI)Plate 1: Group A | 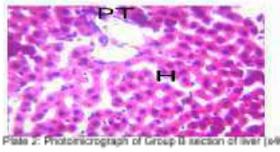 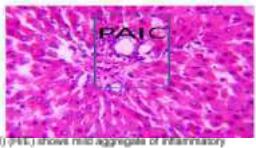 X3cell (PNC) otherwise normal with active hepatocyte (H)Plate 2: Group B X3cell (PNC) otherwise normal with active hepatocyte (H)Plate 2: Group B |
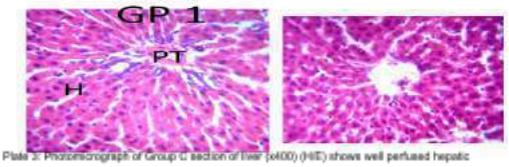 tissue with portal trald (PT) and active hepatocyte (H) and central vein (CV)Plate 3: Group C tissue with portal trald (PT) and active hepatocyte (H) and central vein (CV)Plate 3: Group C | 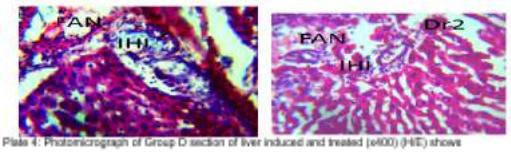 severe degeneration with focal area necrosis (N) and severe intra-hepatic inflammation (HI)Plate 4: Group D severe degeneration with focal area necrosis (N) and severe intra-hepatic inflammation (HI)Plate 4: Group D |
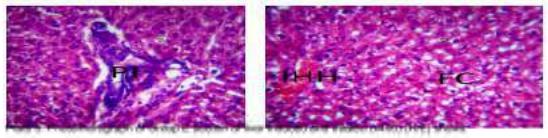 nild regeneration with moderate portal inflammation (PI) inodesate fatty changes (FC) and focal area of intra-hepatic haemorrhage (HN)Plate 5: Group E nild regeneration with moderate portal inflammation (PI) inodesate fatty changes (FC) and focal area of intra-hepatic haemorrhage (HN)Plate 5: Group E | 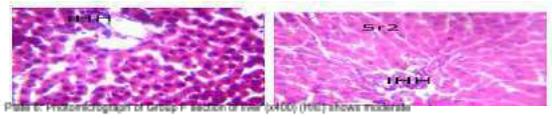 regeneration with mild intra-hepatic inflammationPlate 6: Group F regeneration with mild intra-hepatic inflammationPlate 6: Group F |
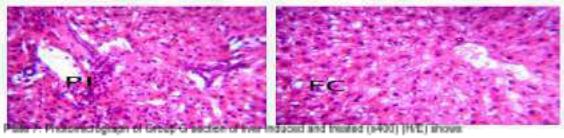 moderate regeneration with mild portal inflammation (PI) and mild fatty changes (FC)Plate 7: Group G moderate regeneration with mild portal inflammation (PI) and mild fatty changes (FC)Plate 7: Group G | 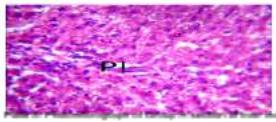 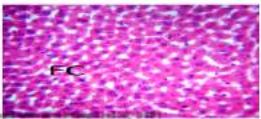 shore mild to moderate regeneration with mild portal inflammation (PI) and moderate fatty changes (FC)Plate 8: Group H shore mild to moderate regeneration with mild portal inflammation (PI) and moderate fatty changes (FC)Plate 8: Group H |
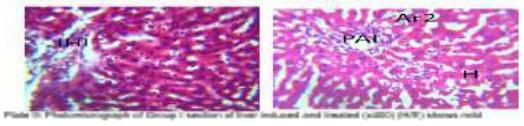 regeneration with moderate intra-hepatic inflammation (HK) and portal aggregate of inflammation (PAI)Plate 9: Group I regeneration with moderate intra-hepatic inflammation (HK) and portal aggregate of inflammation (PAI)Plate 9: Group I | 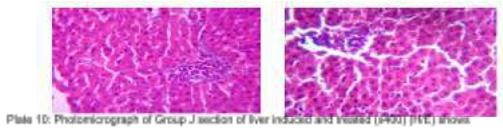 moderate regeneration with mild intra-hepatic inflammation (HI)Plate 10: Group J moderate regeneration with mild intra-hepatic inflammation (HI)Plate 10: Group J |
| Pancreas Histology | |
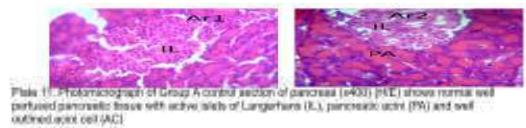 Plate 11: Group A: Plate 11: Group A: | 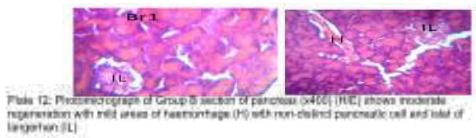 Plate 12: Group B Plate 12: Group B |
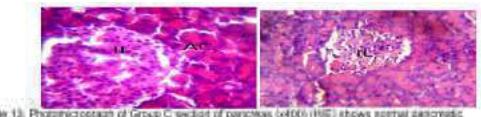 flu tissue with active site of longerham (IL) and actin cells (AC)Plate 13: Group C flu tissue with active site of longerham (IL) and actin cells (AC)Plate 13: Group C | 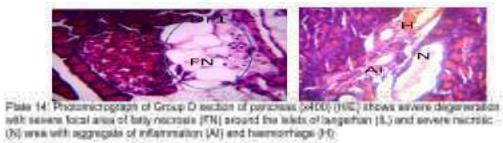 Plate 14: Group D Plate 14: Group D |
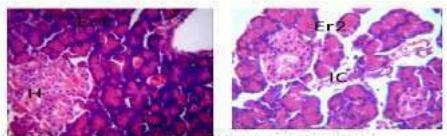 Plate 15: Phytomicrograph of Group II section of pancreas (x400) (HIV) shows moderate regeneration with mild haemorrhagic site (H) and mild inflammatory cell (IC)Plate 15: Group E Plate 15: Phytomicrograph of Group II section of pancreas (x400) (HIV) shows moderate regeneration with mild haemorrhagic site (H) and mild inflammatory cell (IC)Plate 15: Group E | 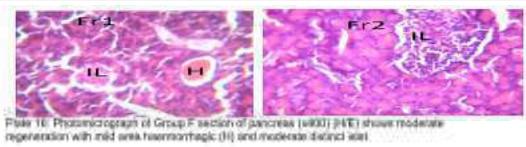 Plate 16: Group F Plate 16: Group F |
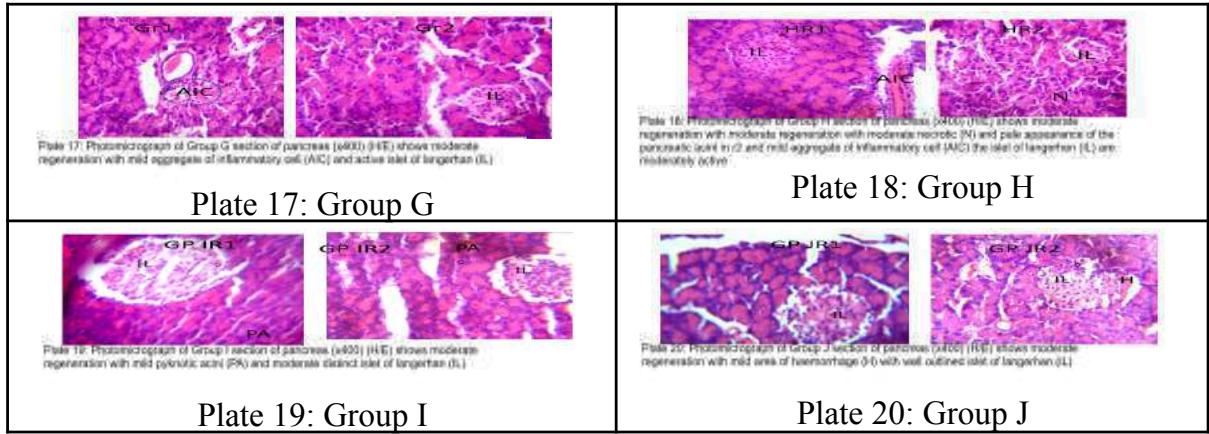
 Plates 1-20: The liver and pancreas histological characteristics for the different control and intervention groups. The different treatment groups were compared using the histological characteristics of the normal control. In both organs, Group A on Formulation 1 showed stronger amelioration and regeneration than the standard controls, with identical histological characteristics to the normal control.
V. DISCUSSION
5.1 Effect on Blood Glucose Level
The results of this study indicated that each group's mean random blood glucose (RBG) over time differed significantly (F=13.963, p\<0.001) from the other and that the group as a whole changed in a roughly similar way from week 1 to week 4. As a result, the group was deemed to be significantly parallel (F=79.106, p\<0.01), significant (F=76.755, p\<0.001), and showing a positive trend. In this study, there were essentially two comparison groups: the intervention groups and the control groups.
Group C had the lowest mean concentration of RBG, which was explained by the group's lack of diabetes. Over the weeks, the diabetic control's RBG value was higher than that of the other controls, the standard control, B. Groups E, F, G, and H among the intervention groups showed reduced RBG values with a consistent trend over time (Figure 1). When the RBG values of the diabetic rats in the intervention and control groups were compared, the former showed lower values than the standard and diabetic controls, indicating that the RBG control was better with the intervention flour formulations than when the diabetic rats were fed commercial rat feeds either on their own or in addition to metformin, an anti-diabetic medication.
The trend over time indicated that Group C had better RBG control than Group H, which was better than Groups B, G, E, A, J, and finally F, D, and I. This suggests that the use of formulation 5 for the intervention had better RBG control than the standard anti-diabetic drug metformin and that all intervention formulations—except for formulation 6 (Group I)—were better at controlling RBG than the use of commercial rat feeds alone for STZ-induced diabetic rats (Figure 1).
The findings suggested that, although the reduction in hyperglycemia was not linear over time and showed levels of fluctuations as occur even in human subjects on anti-diabetic medications, the intervention formulations, like the standard anti-diabetic drugs, might have been responsible for it in the STZ-induced diabetic rats. This situation has made the use of anti-diabetic drug combinations for glycemic control necessary . The inclusion of phenolic compounds and other bioactive components in the formulations may likely account for the hypoglycemic effects of the products.
Plants generate phenolic compounds as secondary metabolites, and these compounds have anti-diabetic properties. This is because they activate the 5' adenosine monophosphate-activated protein kinase (AMPK) pathway, which stimulates skeletal muscle cells to take up glucose. They improve glucose metabolism in tumour necrosis factor- (TNF )-treated insulin-resistant mice hepatocytes by blocking gluconeogenesis and promoting glycogenesis . Oboh and colleagues have reported that it also increases the inhibitory activity of -amylase and -glucosidase in rats with streptozotocin-induced diabetes when given anti-diabetic medications .
The presence of phenolics has been linked in many different studies to a decrease in blood glucose levels while fasting . Among other bioactive components, a gas chromatographic study of cocoyam, soybean, and Bambara groundnut, and their blends showed the presence of phenolic compounds . Additional BACs included in the formulations probably played a role in the hypoglycemic outcomes seen in this investigation. Monoterpenoid derivatives that inhibit -amylase and -glucosidase activity have been shown to have antidiabetic benefits .
Similarly, compounds containing artemisinin and its derivatives can reduce the symptoms of type 2 diabetes by reversing the imbalance in the ratio of insulin, glucagon, and somatostatin content in islets , increasing insulin secretion , and inhibiting -glucosidase activity . Haemoglobin A1c (HbA1c) levels are elevated after long-term artemisinin consumption . Additionally, artemisinin deacetylated lysine residues on several transcription factors, increasing insulin secretion, and upregulated the expression of SIRT1 in islet -cells, which affected glucose/lipid metabolism . As reported by Kitada and Koya , pancreatic -cells are similarly protected by the stimulation of silent information regulator-1 (SIRT1) expression. By indirectly stimulating the -Aminobutyric acid (GABA) signaling pathway in mice models, artemisinins can cause neogenesis in -cell-like STZ-induced -cell death . According to studies, artemisinins can change cells that produce glucagon into cells that produce insulin . Thiadiazole, a heterocycle containing nitrogen and sulphur, has isomers and derivatives with biological activities associated with the =N-C-S-moiety or strong aromaticity of the ring, and it also acts as a carbonic anhydrase inhibitor, which reduces the production of glucose in the liver in patients with type 2 diabetes .
Some substances, such as thiourea and naphthalene, have positive pharmacological and therapeutic effects that help treat type 2 diabetes (T2DM); in particular, sulfonylureas stimulate insulin secretion from pancreatic -cells, and thiourea derivatives inhibit the formation of advanced glycation end products, -glucosidase, and protein tyrosine phosphatase 1B (PTP1B) . By lowering fasting blood glucose and serum lipid levels, increasing insulin sensitivity, and reducing hepatic steatosis in obese diabetic (db/db) mice, naphthalene's inhibitory effect on FABP4 significantly improves glucose and lipid metabolism and it has equally demonstrated strong PPARγ agonistic activity, which decreased blood glucose levels . These bioactive substances may be responsible for the hypoglycemic effects of the combination of Bambara groundnut, cocoyam, and/or soybeans .
5.2 Effects of the Mean Blood Glucose Level on the Rat Body Weights
A comparative analysis of Figures 2a and 2b showed that weight growth was greater in the groups with normal or regulated blood glucose concentrations than in the hyperglycemic state. The normal control group experienced a weight gain of 24.50 g at week 4, which corresponded to a mean Random Blood Glucose level of 106.25 mg/dl and represented 8.85%. With RBG concentrations ranging from 315.83 mg/dl in week 1 to over 563 mg/dl in week 4, all STZ-induced diabetic groups experienced hyperglycemia, which was associated with reduced weight growth.
Group I experienced the least amount of weight gain and, ironically, the highest RBG during weeks 1-3 (Figure 2). Prior studies comparing control and diabetic rats showed that the diabetic group had weight loss and high blood glucose, while the active, healthy controls had weight increases . According to this study, diabetics with uncontrolled blood glucose experienced a more noticeable weight loss in week 4 compared to week 1 (Table 2; Figure 2).
The administration of STZ, the hyperglycemic state, and the use of the anti-diabetic medication metformin can all contribute to weight loss in diabetic rats. Because STZ alkylates DNA in rats, causing hyperglycemia and necrotic lesions, animals given the drug experience lower body weight . There is a connection between diabetic animals' lower body weight and hyperglycemia.
The type and frequency of the diet, the sex of the diabetic rats, the dosage of the STZ used to induce T2DM, the length of the intervention trial, and the genetic composition are some of the variables taken into account when calculating changes in body weight in diabetic rats. Researchers have experimented with different doses of STZ to cause hyperglycemia in rats of various strains. 45 mg/kg ; 50 mg/kg ; 70 mg/kg ; and 90 mg/kg were some of the levels that were employed.
An intra-peritoneal dose of 45 mg/kg of STZ was used in this trial. This amount was thought to be safe for the strain because only 13% of deaths were reported, which might have been caused by metformin toxicity, STZ toxicity, diabetes complications, or a combination of these. The standard control in this trial exhibited better weight growth because they were able to control their blood sugar better than other diabetic groups. The blood glucose control in Group B may have been attributed to the anti-diabetic medication metformin. According to Kotb and colleagues , there is limited research that associates the metformin medication with weight loss despite blood glucose regulation.
This has been attributed to several factors, including decreased appetite , attenuation of neuropeptide-Y (NPY) , stimulation of glucagon-like peptide-1 (GLP-1), which inhibits food intake , and activation of lipolysis through the inhibition of adipogenesis, carbohydrate absorption, and bile salt uptake , all of which inhibit energy production. However, our findings in this work suggest that metformin had a positive effect on weight gain.
The various outcomes from the several diabetic rat groups can be explained by the fact that different formulations included various bioactive substances in different quantities. On intervention formulations, groups F and H had comparatively better blood glucose levels and better weight gain than other groups. Formulations 5 and 4, respectively, were assigned to groups H and F. Based on the available research, the bioactive components included in both formulations were stilbene and phenolics . Furthermore to the previously mentioned anti-diabetic effects of phenols, stilbene, which is found in cocoyam and soybean flour, also reduces the expression of peroxisome proliferator-activated receptor gamma (PPARγ), lessens IR, and upregulates GLUT4, enhances glucose and fatty acid catabolism [54], lowers serum cholesterol and the LDL/HDL ratio, attenuates obesity-induced inflammation in adipocytes , as demonstrated by a decrease in inflammatory cytokines TNF-α, IL-6, and monocyte chemo-attractant protein-1 (MCP-1) . Rats with managed diabetes mellitus may gain weight due to these actions, which also cause hypoglycemia consequences.
5.3 Effects of the Mean Blood Glucose Level on the Relative Organ Weights
Investigation indicates that in the absence of a successful intervention, the frequency and intensity of STZ-induced lesions in the pancreas, liver, kidney, and gastrointestinal tract steadily rise over time . The weight of the pancreas did not significantly differ between the groups in this study, suggesting that the weight of the pancreas remained relatively unchanged, but the weight of the liver increased significantly between the diabetic control, which had the highest value, and the normal control, which recorded the lowest value (Table 3).
There was no statistically significant difference in the relative weight of the liver between the diabetic groups in the standard control group and the intervention formulation groups. This suggests that the anti-diabetic medication's mitigating effects and the food extract formulations' effects may have prevented the progression of the organ damage caused by STZ. It was noteworthy to note that the variation in the blood glucose concentration and the mean relative weight of the liver followed a similar pattern, with the negative control exhibiting the highest values for both blood glucose and relative weight of the liver, and the normal control displaying the lowest values for both.
Diabetes Mellitus has been linked to weight changes in several organs, including the pancreas, liver, and kidney. Some studies have observed an increase in liver weight, while others have shown a decrease in liver weight. The greater rate of catabolism was linked to reports of weight decrease in the liver . In other investigations, it was noted that the liver weight of the diabetic control rats rose proportionately to their body weights when compared to the non-diabetic rats, particularly when the former was on plant extract. This increase was explained by an increased build-up of triglycerides in the liver .
An increase in liver weight was also noted by other studies . Other similar studies carried out in experimental settings showed increases in the body weight and liver ratio of diabetic rats in comparison to controls . The study revealed that the pancreas had not undergone significant alteration. Campbell-Thompson and colleagues found that the diabetic group had a larger mean liver weight than the non-diabetic group during autopsies, although the diabetic group had a lower pancreas weight .
As compared to non-diabetic rats, Zafar and colleagues found that the mean values of the pancreas weight in some of the diabetic rats were unchanged . Certain studies have connected the disruption and eventual removal of the pancreatic islets and the selective destruction of cells that produce insulin to the decrease in pancreatic weight . In addition to the effects of STZ-induced hyperglycemia and hypo-insulinemia, other plausible explanations include the possibility that the direct alkylating activity of STZ can cause cellular necrosis and the selective elimination of beta cells . As a result, according to a number of investigations, the weight of the pancreas decreased or remained unchanged in diabetic groups, although the weight of the liver and kidney increased.
5.4 Effects on Organ Histology
The findings of the study, the rats in the negative control group's liver specimens had significant intrahepatic inflammation, a localized area of necrosis, and severe degeneration—all indications of the damaging effects of STZ and hyperglycemia on the liver. The results aligned with earlier research that documented hepatocyte fatty deposits, deformed sinusoids, inflammatory alterations, and necrosis characteristics surrounding the triad on the tenth day in STZ-induced diabetic rats .
The diabetic rats in the intervention groups showed varied degrees of regeneration and mild intra-hepatic inflammation in response to formulations 1–7, suggesting that the formulation effectively stopped the STZ-induced organ damage and sparked effective regeneration of the destroyed liver cells (Plates 1 -10). This investigation also revealed that the pancreas of the diabetic control exhibited significant intrahepatic inflammation, focal area of necrosis, and severe degradation of pancreatic cells, indicating unchecked damage by the STZ and hyperglycemia (Plate 14).
The histological appearance of the conventional anti-diabetic medication used in the standard control was comparable to that of the patients in group A on formulation 1. Variable degrees of regeneration and minor inflammatory cell aggregation were observed in all other groups on intervention formulations (Plates 11–20).
Limitations (if applicable)
Nil
VI. CONCLUSION
On STZ-induced diabetic rats, a blend of cocoyam, soybean, and Bambara groundnut flour produced hypoglycemic effects; however, the extent of blood sugar reduction differed depending on the blend formulation. In addition to exerting superior glycemic control over the anti-diabetic medication metformin, Group A, which received formulation 1, also improved liver and pancreatic tissue regeneration. The results also showed that the rat and liver weights increased as a result of these formulations in the groups with improved RBG control, while the pancreatic weight remained constant.
Therefore, it could be suggested that in addition to lowering blood glucose, consuming a combination of these plant-based foods could help prevent organ damage, repair damaged organs, and prevent overall weight gain in people with diabetes mellitus. As such, it should be considered a useful addition to the nutritional management of diabetes.
ACKNOWLEDGEMENTS
The authors wish to sincerely appreciate and acknowledge the technical support from Dr Eleazu Chinedu and Dr Uchechukwu Okorie of the Department of Biochemistry, Alex Ekwueme Federal University, Ndufu Ikwo, Ebonyi State Nigeria.
Conflict of Interest
The authors declare no conflict of interest.
Ethical Approval
Not applicable
Data Availability
The datasets used in this study are openly available at [repository link] and the source code is available on GitHub at [GitHub link].
Funding
This work did not receive any external funding.
References
Cite this article
Related Research



Special Issue
Launch a focused special issue to highlight research, emerging trends, and expert insights in your academic field.
