

IntelliPaper
Abstract
The urban growth of Quevedo has evolved rapidly due to population growth, economic development, and land-use changes. This study analyzed this expansion using geospatial modeling, identifying growth patterns and projecting scenarios through 2030. A methodology based on Markov Chains and IDRISI software was used, integrating geospatial and temporal data obtained from satellite images, official cartography, and socioeconomic records. The application of Geographic Information Systems (GIS) allowed the identification of areas with the greatest potential for urbanization, considering factors such as land use, proximity to road infrastructure, and population density. The results showed sustained urban growth, with a 32% increase (1,104 ha) in the projected urban area by 2030. At the same time, a 44.9% reduction in agricultural areas (6,040.4 ha) and a 45.0% reduction in livestock areas (1,360.9 ha) were recorded, which could generate land-use conflicts and pressure on natural resources. Furthermore, uncontrolled urban expansion was identified as a risk to equitable access to basic services, infrastructure, and security. It was concluded that it is essential to implement sustainable land-use planning strategies that regulate expansion and balance urban growth with environmental conservation and soil productivity. The development of controlled expansion plans that prioritize the provision of basic services and the protection of strategic agricultural areas, guaranteeing planned and sustainable urban development, is recommended
Explore Digital Article Text
I. INTRODUCTION
In Latin America, population growth in urban areas dates back to the 1970s, when free market policies were implemented throughout the region and international organizations encouraged population concentration in cities with a view to their sustainability (Duque, 2021). (Vega and Cánovas, 2023). This measure facilitated the strengthening of the real estate sector and allowed power groups to exert their influence on the areas to be urbanized and the direction of urban growth (Yacila, 2021). Furthermore, uncontrolled urban expansion led to the loss of green areas and natural spaces, as well as an increased demand for basic services such as drinking water, energy, and transportation (Koprowska et al., 2020). (Maeso and Hidalgo, 2020). This raises questions about the future challenges of land use planning, the provision of basic services, environmental preservation, and economic and social development (Long et al., 2021). (Hendricks and Van Zandt, 2021) (Wang et al., 2022).
Population growth in Latin America and the Caribbean shows an almost perfectly arithmetic trend, according to World Bank data collected from 1970 to 2020 (García et al., 2023). This region showed accelerated population growth, going from 300 million to more than 650 million inhabitants. Regarding the percentage of urban population in relation to the total, Latin America and the Caribbean increased their urban population from 57% to 81% (Sandoval and Sarmiento, 2020). (Giorguli et al., 2022). In the case of Ecuador, the population increased from approximately 5 million to almost 18 million today, with the urban population increasing from 39% to 64% nationwide (Guerrero, 2022). (Roldan et al., 2024). These data show that in the last decade the pressure on urban and developable land has been increasing (Duque and Montoya, 2021). The rapid growth of Ecuadorian cities has generated pressure on natural resources and urban infrastructure, negatively affecting the quality of life of their inhabitants (Mena et al., 2022).
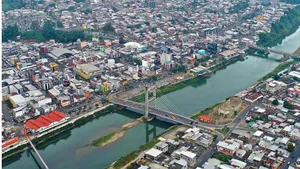
Quevedo is a dynamic, constantly evolving city that has witnessed a dizzying urbanization process in recent decades, becoming one of the ten most populated cities in the country. The city's uncontrolled expansion has resulted in the loss of green areas and natural spaces, as well as increased pressure on basic services and existing infrastructure (Coello et al., 2024). Population densification in urban areas has contributed to traffic congestion, air pollution, and the degradation of the natural environment (Mena et al., 2022). The demand for housing, services, and employment continues to rise, leading to increased pressure on available resources and an unequal distribution of the benefits of urban development (Mejía et al., 2024). Furthermore, the lack of adequate planning has exacerbated socioeconomic segregation and the vulnerability of certain population groups.
Urban growth without adequate planning leads to the overexploitation of resources, affecting the sustainability of cities (Duranton and Puga, 2023). This phenomenon highlights the need to rethink urban development and resource management to promote a more equitable and sustainable environment (Domingo et al., 2021). Therefore, in the formulation of territorial planning plans, it is essential to carry out spatial analyses that allow defining suitable areas for urban growth in line with the characteristics of the territory (Sotelo, 2020). (Otero and Llop, 2020). These analyses may include techniques such as multicriteria evaluation, spatial interpolation analysis, surface modeling, accessibility and connectivity analysis, among others (Fernandez, 2020). (Sisman and Aydinoglu, 2020) (Sadooghi et al., 2022).
Multi-criteria assessment is an essential tool in urban planning, as it allows for the consideration of various variables such as topography, availability of basic services and proximity to protected areas to identify the most suitable areas for urban development. (Sagastume et al., 2022). This approach facilitates decision-making in complex and poorly structured problems, providing a solid basis for sustainable land use planning (Cardoso and Carnel, 2022). Similarly, spatial interpolation analysis is equally valuable, as it allows estimating values in locations without direct data, such as population density or service demand (Gold, 2020). (Du et al., 2020). This process involves the manipulation of spatial information to extract new meaningful data, using techniques that generate continuous surfaces from existing data points (Barragán, 2022). Furthermore, surface modeling is crucial for generating three-dimensional representations of the territory (López, 2023), facilitating the visualization and understanding of its morphology and relief (Crissi, 2021). These representations are essential for analyzing phenomena such as elevation, slope, and other geographical aspects that influence urban planning (Cahe and de Prada, 2024).
The use of advanced geospatial modeling techniques, especially Geographic Information Systems (GIS), is presented as a powerful tool for analyzing urban growth patterns, identifying risk areas, and evaluating development scenarios (Li et al., 2020). These tools allow the cartographic representation of complex urban phenomena and support informed decision-making in territorial planning (Sassi et al., 2020). (Mamonov et al., 2021). Thus, the integration of these methodologies into urban expansion research not only enriches scientific knowledge in the field of urban planning but also provides valuable information for the formulation of effective and sustainable urban policies and strategies (Cabrera et al., 2020). (Lytvynchuk et al., 2020).
Lack of familiarity with these spatial analysis methodologies can lead to the formulation of unclear and superficial Territorial Plans, which in turn can result in empirically based territorial classification and delimitation driven by political or economic interests (Alvarado and Jiménez, 2020). It is essential that those responsible for formulating these plans have the knowledge and tools necessary to carry out rigorous, data-driven spatial analyses that enable informed and sustainable decisions regarding territorial development (Koldasbayeva et al., 2024). (Zhang et al., 2024).
In this context, there is a need to delve deeper into the patterns and processes of urban expansion in Quevedo, as well as their impact on local development and the quality of life of its inhabitants. This understanding is essential for guiding policies and measures that foster sustainable, equitable, and resilient urban growth in the city moving forward. This research seeks to provide tools and knowledge that enable more effective and sustainable urban planning in Quevedo. By modeling different urban expansion scenarios using geospatial techniques, planners and decision-makers will be able to visualize and assess various growth trajectories and their potential impacts.
1.1 Study area
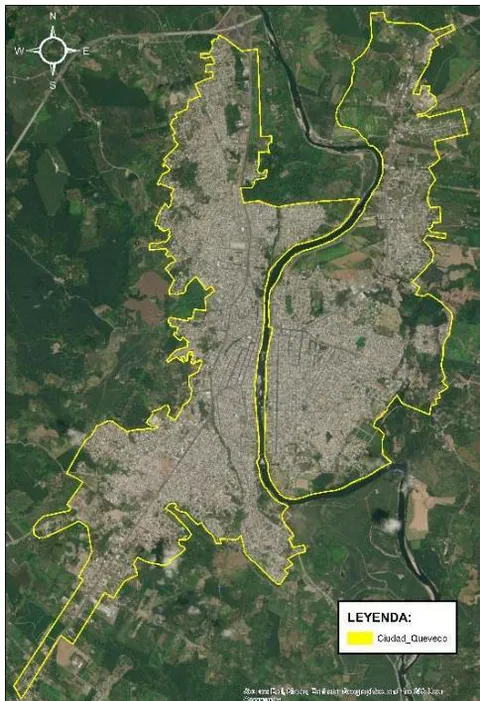
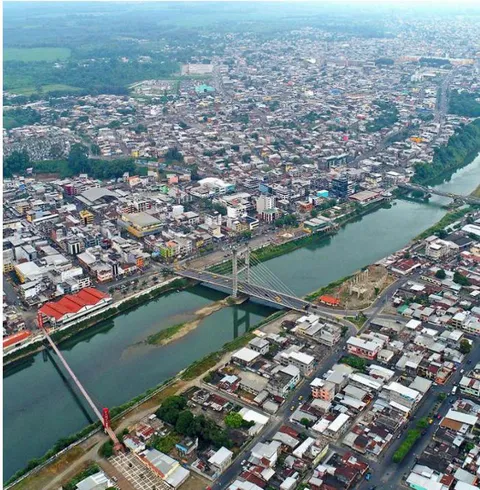
The city of Quevedo is located in the northern part of the province of Los Ríos, belonging to the Costa region of continental Ecuador, with geographical coordinates 1°02'00" South latitude and 79°27'00" West longitude, at an altitude of 74 meters above sea level (Fig. 1). Its territorial extension is 3125.06 hectares. It borders geographically with the cantons: Buena y Fe Valencia (North), Mocache and Ventanas (South), Quinsaloma and Ventanas (East), El Empalme of the province of Guayas (West).
II. METHODOLOGY
2.1 Population and sample
Population
The study population for this research corresponds to all properties located in the Quevedo canton, Ecuador. Quevedo, a medium-sized city in the Los Ríos province, which according to official data from the National Institute of Statistics and Census (INEC, 2022), has a population of 206,008 inhabitants and is home to a diversity of properties that span both urban and rural areas within the canton. These properties exhibit a variety of distinguishing characteristics, including their geographic location in the Ecuadorian coastal region, their diverse land use, ranging from residential to agricultural and industrial, as well as their size and morphology, which can vary from small residential plots to large tracts of land. Furthermore, the property population is distributed across areas with different levels of access to basic services and urban amenities, reflecting the complexity of Quevedo's urban structure.
Within the context of a non-experimental documentary or bibliographic design, the units of analysis used will encompass a variety of sources, such as official documents, municipal records, previous studies, and maps, to gain a comprehensive understanding of urban expansion and its impact on local development in Quevedo.
According to the urban cadastre of the Decentralized Autonomous Government (GAD) of the Quevedo Canton, a total of 70,000 properties were identified that belong to the urban area of the "Quevedo" canton.
Sample
The determination of the population subset for this research will be based on stratified random sampling, considering the different urban and rural areas within the Quevedo canton. The objective is to obtain a representative sample that reflects the diversity of property characteristics throughout the study area.
To determine a representative sample of a population of 70,000 properties in the Quevedo canton, we can use several sampling methods. One of the most common methods is simple random sampling, which involves randomly selecting a specific number of elements from the population to form the sample.
To establish the sample size, the sample size calculation formula for finite populations will be used, which is expressed as:
Where:
N = is the sample size N is the population size p is the probability of success q = is the probability of failure (1 - p)
z = is the standard normal value corresponding to the desired confidence level.
S = is the estimate of the population standard deviation.
e = is the maximum admissible error (estimation error) For the z value, a 95% confidence level was assumed, giving a value of 1.96. For p, a probability of 50% was assumed, so q will also have a value of 50%; for E, an error of 5% was estimated.
The formula was applied to determine the sample size required to achieve a specific confidence level and margin of error. Once the sample size was calculated, the properties included in the sample were randomly selected.
2.2 Research instruments
The research instruments used in this study included questionnaires, interview guides, and geospatial analysis tools. Each is detailed below:
Questionnaires: Structured questionnaires were designed to collect quantitative data from local residents and property owners in Quevedo. These questionnaires contained closed-ended and open-ended questions about perceptions of urban sprawl, access to basic services, quality of life, and other relevant variables. Questions were guaranteed to be clear, relevant, and unbiased to elicit accurate and meaningful responses.
Interview Guides: Semi-structured interview guides were developed to conduct in-depth interviews with municipal officials, urban planning experts, and community leaders. These guides included open-ended questions and topics designed to explore in-depth policies, practices, and perceptions related to urban development in Quevedo, ensuring the collection of detailed and relevant information.
Geospatial Analysis Tools: Geospatial analysis tools, such as Geographic Information Systems (GIS), were used to visualize and analyze spatial data on urban expansion, land use, and infrastructure distribution in Quevedo. Software such as QGIS, ArcGIS, and IDIRIS were used, using the Lean Chain Modeler module and applying the Markov Chain. These tools allowed for the integration and analysis of georeferenced data to identify spatial patterns and trends in urban development.
Procedural diagram: Schematically, the procedure executed by the Markov Chain model (MC-Markov) demonstrates the relationship between input information and execution in a different pair run. For the first execution of the process, stages 2010 and 2020 are established, which will serve as elementary intervals for the calibration process. After that, the extrapolation to the 2020-2030 validation period is generated.
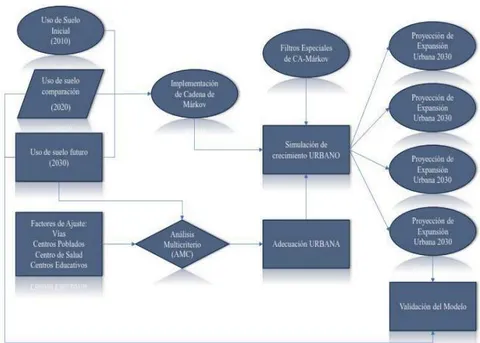
Once the system is ready, a validation process is generated that evaluates simulated urban growth by comparing it with the existing urban expansion during that period (2020-2030). The subsequent execution uses the 2010 and 2030 stages as a calibration process and, based on this, performs extrapolations for three sequential projections segmented into 20-year periods: 2030-2050, 2050-2070, and 2070-2090.
To ensure the reliability and validity of the research instruments, the following criteria will be followed:
a. Reliability: The questionnaires and interview guides were pilot-tested with a representative sample group before their full implementation. In addition, an inter-interviewer consistency analysis will be conducted to ensure consistency in the application of the interview guides.
b. Validity: A thorough review of existing literature and relevant documents was conducted to ensure the validity of the questions and topics included in the questionnaires and interview guides. In addition, feedback from experts in the field of study was sought to validate the content of the instruments. Attention was paid to question formulation to avoid bias and ensure that they adequately capture the constructs intended to be measured.
2.3 Data collection
Once the specific objectives of this research were established, relevant information sources were identified. This included consulting official documents, institutional reports, previous studies, statistics, databases, academic literature, among other relevant resources. Subsequently, the appropriate data collection instruments were selected to obtain the required information. Techniques such as surveys, direct observation, and document review were employed. These strategies made it possible to collect the data necessary to answer the research questions.
Primary data collection for this research was carried out through a series of meticulously planned activities. First, a physical and digital inventory of all cartographic information that influences or generates interest in the application or determination of urban expansion projections will be conducted, focusing on the entire urban and peri-urban area of the Quevedo canton. This will address aspects relevant to the research process, such as the history of urban expansion, geographic layers of basic service coverage and access to roads and towns, and existing urban amenities in the city.
2.4 Data source
Municipality of Quevedo
Data were obtained on urban zoning, current land use, and urban and peri-urban areas. This information made it possible to establish the areas authorized for urban development and compare their expansion in recent years.
| Type of Information | Data Purpose | Data Format | Analysis Tools Used |
| Urban zoning, land use, urban and peri-urban areas | Determine authorized areas for urban development and analyze expansion trends in the canton. | Shapefiles, vector maps at 1:1000 scale, structured tables. | ArcGIS, QGIS |
| Orthophotography | Obtain spatial precision over urban and peri-urban areas | Orthophotograph in ECW format at a scale of 1:1000 from 2015 | ArcGIS, QGIS |
Military Geographic Institute (IGM)
It provided base mapping and detailed geospatial data for the Quevedo area, such as topography and land-use layers at a working scale of 1:25,000 in geodatabase (GDB) format, which were transformed into shapefile (SHP) format for processing. This data was used to identify areas that have experienced significant land-use change and are therefore prone to urban expansion.
| Type of Information | Data Purpose | Data Format | Analysis Tools Used |
| Basic mapping, topography and land use layers | Establish the geographical basis for the analysis of urban growth, including physical characteristics of the territory | BDD - Topography and land use shapefiles, raster maps at a scale of 1:25000 | QGIS |
National Institute of Statistics and Census (INEC)
It provided sociodemographic and economic data that complemented the spatial analysis for both 2010 and 2020, allowing for the correlation of growth areas with variables such as population density, demand for services, and settlement growth.
The cartographic information, developed and managed by the National Institute of Statistics and Census (INEC), provides up-to-date and essential data for modeling urban expansion scenarios in the Quevedo canton, thus enriching the analysis of spatial patterns and their implications for local development.
| Type of Information | Data Purpose | Data Format | Analysis Tools Used |
| Demographic, economic and population density data | The socioeconomic distribution in Quevedo | Structured databases in Excel, | Excel |
| census cartography for the years 2010 and 2020 | Correlate urban growth with population density | Shapefiles at 1:25000 scale | ArcGIS |
Ministry of Agriculture and Livestock (MAG)
The data collected on the type and capacity of land use helped to delimit areas specifically designated for agriculture, distributed in five (3) categories: Forestry, Agriculture, Livestock, thus protecting lands of agricultural value from uncontrolled urban expansion and additionally, 2 essential categories were determined for the process of determining expansion, such as: Consolidated urban areas and Double River.
| Type of Information | Data Purpose | Data Format | Analysis Tools Used |
| Land use capacity, agricultural areas and classification | Protect areas of agricultural value from urban growth and ensure agricultural sustainability | Soil classification shapefiles, maps | QGIS |
Semi-structured interviews were then conducted with municipal officials, urban development experts, community leaders, and cantonal authorities to obtain detailed, firsthand information on the policies, practices, and challenges related to urban development in Quevedo. These interviews were carefully recorded and subsequently analyzed to identify relevant patterns and themes.
Finally, field visits were conducted to directly observe the urban environment in different areas of Quevedo, gathering qualitative information on infrastructure, land use, and the quality of the urban environment. Detailed observations will be recorded to complement the data obtained through surveys and interviews. These activities will be carried out in a coordinated manner, following ethical protocols and utilizing appropriate sampling techniques to ensure the validity and reliability of the data collected.
Once the data was collected, it was systematically and securely organized. It was then analyzed using appropriate techniques, such as statistical analysis. This process allowed for the data to be examined and the results to be interpreted in relation to the research objectives and questions posed. Significant patterns, trends, relationships, or findings that emerged from the data were then identified. These findings were related to the existing literature to conduct a discussion relevant to each of the specific research objectives.
2.5 Data processing and analysis.
The processing and analysis of the collected information was carried out through a combination of manual and automated methods, using specialized software when necessary. First, data was coded by assigning numerical codes or categories to the survey and interview responses. The data were then entered into spreadsheets or databases, ensuring their accuracy and completeness. Extensive data cleaning was performed to identify and correct any errors or inconsistencies, ensuring data quality for analysis.
Regarding data analysis, different techniques were applied depending on the nature of the information collected. Descriptive statistical analyses were performed to summarize and present the data in a clear and understandable manner, using tables, graphs, and measures of central tendency and dispersion. In addition, a qualitative analysis of the open-ended responses from the surveys and interviews was conducted, identifying patterns, themes, and emerging trends.
For the spatial analysis of data related to urban expansion, geospatial analysis tools such as population density maps, land use, and service distribution were used. Relevance, consistency, and interpretation criteria were applied during data analysis, ensuring that the results were relevant to answering the research questions and objectives of the study.
The software used for data analysis included tools such as Microsoft Excel and a combination of GIS (Geographic Information Systems) software such as IDIRIS, using the Lean Chain Modeler module for Markov Chain analysis. ArcGIS and QGIS were also used, depending on the specific needs of each statistical and spatial analysis. These tools enabled a comprehensive and rigorous analysis of the collected data, providing valuable information for research on the urban expansion of Quevedo and its impact on local development.
III. RESULTS
3.1 Urban growth history using geospatial and temporal data to identify significant areas of expansion in the Quevedo canton.
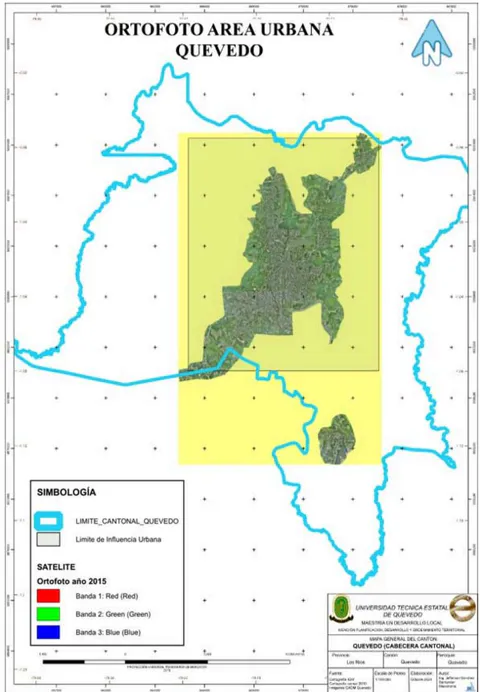
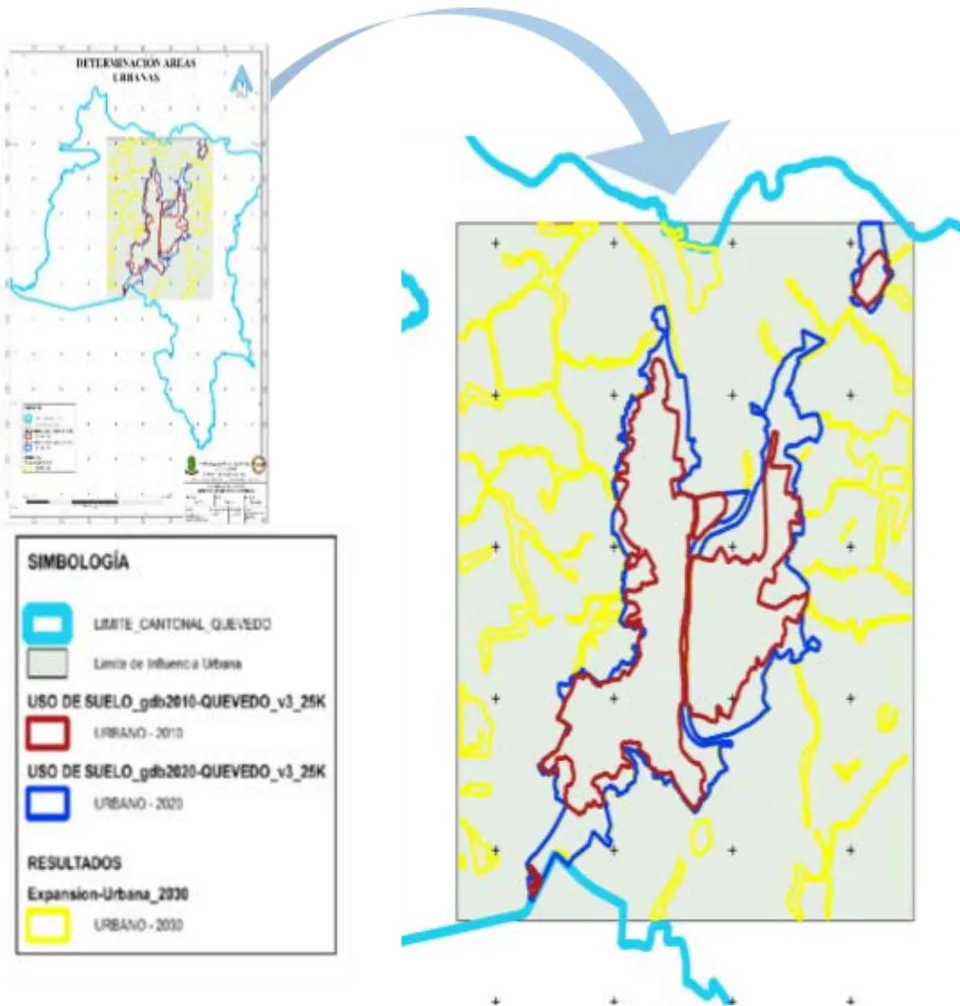
The collection and analysis of geospatial data from the Municipality of Quevedo identified key points for planning a potential urban expansion. Using strategic information, sectors with high growth potential were delimited by integrating urban zoning, land use, and orthophotography into a Geographic Information System (GIS). Processing shapefiles and vector maps at a scale of 1:1000 in ArcGIS and QGIS facilitated the assessment of territorial evolution and its compliance with current regulations. The results revealed clear growth patterns in urban and peri-urban areas, highlighting strategic sectors for expansion. The precision provided by orthophotography allowed for more precise delimitation of these areas, consolidating an essential database for territorial planning and the sustainable management of urban growth in the Quevedo canton (Fig. 3).
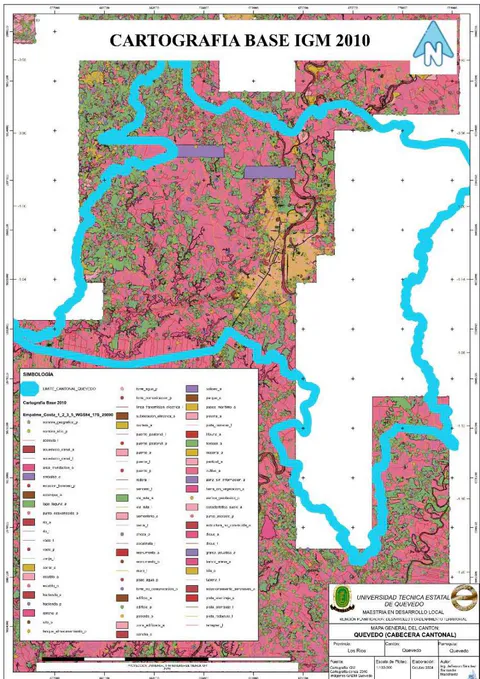
The data provided by the IGM, which include base cartography and geospatial data with detailed information on topography and land use at a scale of 1:25,000 for the 2010 and 2020 periods, established a solid geographic basis for assessing urban growth. From this analysis, areas with significant land-use changes and high potential for urban expansion were identified. Additionally, a spatial analysis was conducted to exclude areas of high agricultural value and protected areas, ensuring that urban growth projections are compatible with the principles of territorial sustainability. A base map was generated delimiting viable areas for urban expansion, considering the canton's topography and its interaction with urban growth dynamics. This information represents a key tool for territorial planning and strategic decision-making, facilitating orderly and sustainable urban development in Quevedo (Fig. 4).
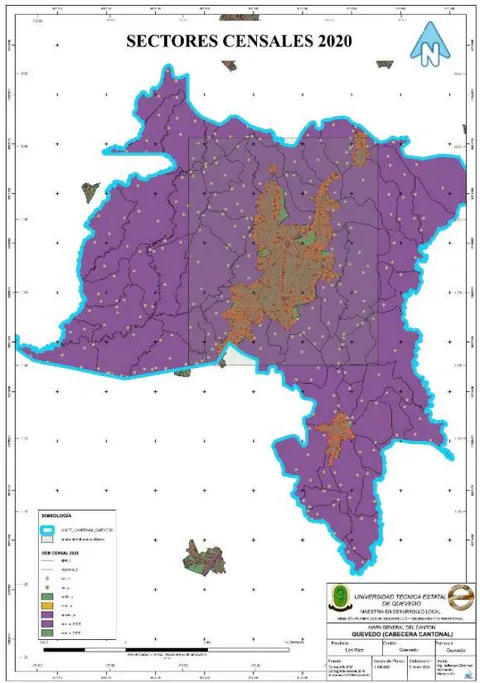
Data obtained from the National Institute of Statistics and Census (INEC) for the years 2010 and 2020 allowed for the correlation of territorial expansion with key variables such as population density, settlement growth, and service demand. The integration of census data into population density maps, processed in Excel and ArcGIS, revealed significant changes in the canton's demographic distribution. Areas of accelerated growth were identified, allowing for an assessment of the impact of urbanization on the territory's socioeconomic structure. Despite the delay in the 2020 Census, the 2019-2020 base cartography was a key input for projecting expansion trends. As a result, comparative maps were generated highlighting the areas with the greatest urban growth and their relationship with population distribution, providing essential information for territorial planning and the sustainable management of urban development in Quevedo (Fig. 5).
{"image_source":{"path":"images/f8e81e109f3ac9b1b5668db811c516fa21b0b757d996e37b3f36f81b845a4dc4.jpg"},"content":"","chart_caption":[{"type":"text","content":"(a)"}],"chart_footnote":[]}
Analysis of information provided by the Ministry of Agriculture and Livestock (MAG) enabled the establishment of a precise land classification in the Quevedo canton for the 2010 and 2020 periods, differentiating between five key categories: forestry, agricultural, livestock, consolidated urban areas, and double rivers. This segmentation was essential for delimiting areas of high agricultural value and identifying zones with potential for urban expansion. By processing soil classification shapefiles and maps in QGIS, data was cross-referenced with urban growth zones, allowing for the identification of priority areas for agricultural conservation and the avoidance of unplanned urbanization of productive lands. A land use capacity map was generated, providing a key tool for the sustainable management of urban growth, ensuring a balance between territorial expansion and the protection of agricultural resources. This information is essential for strategic decision-making in Quevedo's territorial and urban planning (Fig. 6).
{"image_source":{"path":"images/f6f736097d33003674333c57d224e134588392c631565bb1b7d24d45e848df61.jpg"},"content":"","chart_caption":[{"type":"text","content":"(a)"}],"chart_footnote":[]} {"image_source":{"path":"images/72bd7a46a08878624c522bc5e1e4763912fd5e46b757f7a4fd39e6dd65a7e637.jpg"},"content":"","chart_caption":[{"type":"text","content":"(b)"},{"type":"text","content":"Figure 6: Land-use cover maps for Quevedo canton: (a) 2010 land cover layer; (b) 2020 land cover layer."}],"chart_footnote":[]}
3.2 Urban expansion scenarios using geospatial modeling techniques in Quevedo with a 2030 vision
The results obtained from the urban expansion scenario modeling process in Quevedo offer a detailed and phased projection of land use changes over 20-year intervals, visualizing projected urban growth for the years 2030 as an initial resulting basis for the scope of the research, and additionally generating projections for the years 2050, 2070 and 2090.
The implementation of the Markov chain in the IDRISI Land Change Modeler enabled a robust simulation based on the observed transitions between the 2010 and 2020 stages, identifying areas with a high probability of conversion to urban uses and reflecting the influence of factors such as land use, proximity to roads and proximity to towns (Fig. 7).
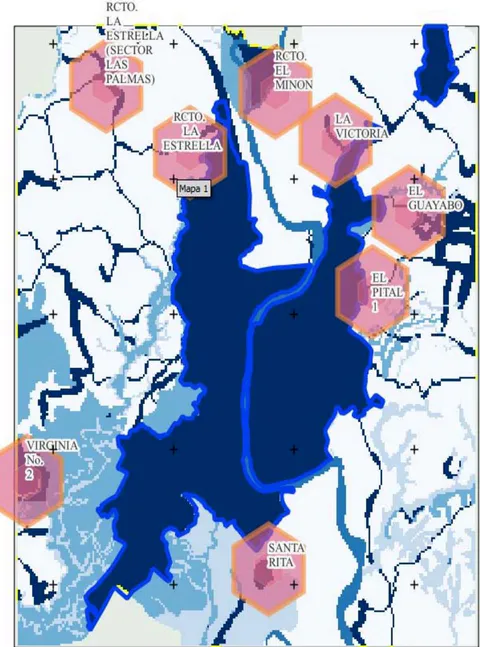
The scenario for 2030 projects an urban growth of 1,104 hectares, corresponding to a 32% increase compared to the 2020 stage, concentrated in areas with high accessibility, particularly in sectors such as El Guayabo, La Victoria, El Pital, Recinto El Minón, Recinto La Estrella, La Estrella (Las Palmas sector), Santa Rita, Virginia N°2, These sectors coincide with being in areas close to the main communication routes and towns, especially on lands whose activities were previously destined for agriculture and livestock. Based on the prediction established in the model, significant pressure on these productive lands is shown, which poses challenges for territorial planning and natural resource management (Fig. 8).
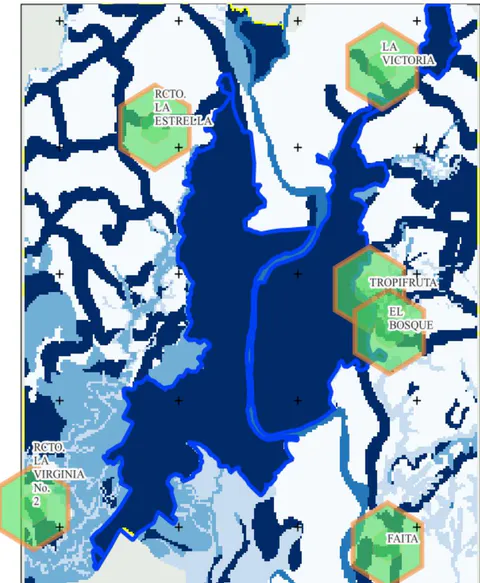
The scenario for the year 2050 shows an expansion that includes forest lands and areas further away from population centers. This pattern reflects a growing pressure on lands that were previously not urban, such as those located in the southern part of Recinto la Virginia #2, El Bosque sector, Tropifrutas, Recinto la Estrella, La Victoria Norte, Faita, reaching an urban land occupation of 6,286.2 hectares, which is an increase of 81% compared to the 2020 stage, implying a possible significant transformation of natural areas. Considering maintaining correct control over the expansion areas, it is extremely important to apply conservation measures and territorial planning policies that can effectively manage this advance, in order to minimize the environmental impact and preserve (Fig. 9).
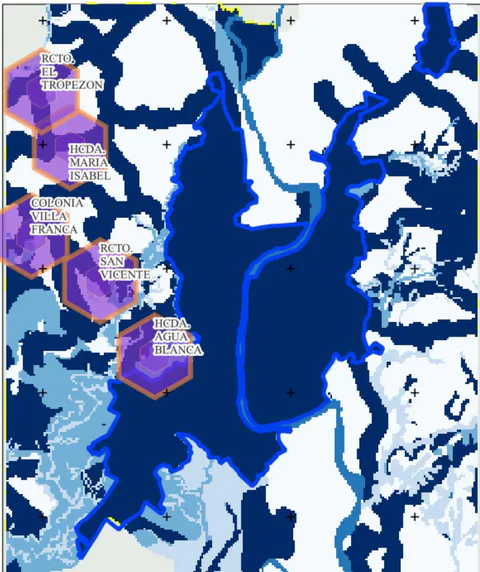
The scenario for the year 2070 shows a projection with considerable advances in peripheral and less accessible areas, indicating a dispersed growth that could generate challenges in access to basic services, such as drinking water, electricity, health and education, especially in more remote areas such as Recinto El Tropezón, Hacienda María Isabel, Colonia Villa Franca, Recinto San Vicente, Hacienda Agua Blanca, which is reflected in a total increase of 116% in occupation of the urban area in relation to the 2020 stadium, reaching a total of 7,527.3 hectares of occupation of urban land in Quevedo (Fig. 10).
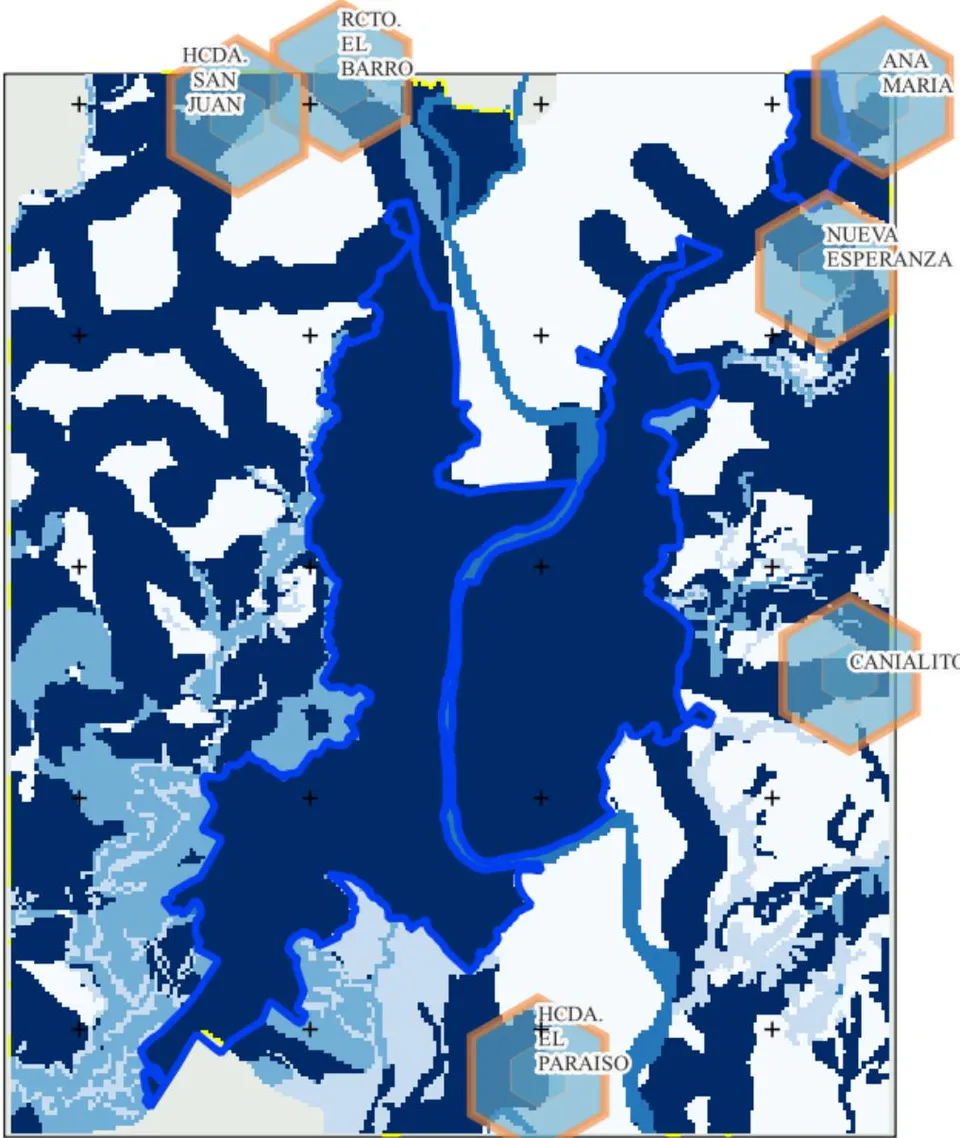
The 2090 scenario shows a final projection with substantial urban growth reaching 8,494.6 hectares, with urbanized areas occupying a significant portion of the lands originally designated for agricultural and livestock activities, marking a consolidation in the sectors established in the 2030, 2050 and 2070 scenarios and additionally expanding urban expansion in sectors such as Cañalito, Nueva Esperanza sector, Ana María Sector, Recinto El Barro, Hacienda San Juan. This scenario suggests a considerable impact on the availability of land for agricultural uses, which could affect food production and the economic sustenance of rural communities (Fig. 11).
3.3 Urban expansion scenarios influence access to basic services, security, and economic activity in the Quevedo canton.
The polygons marked in dark tones within the expansion zones suggest areas with a high density of projected growth. These areas are aligned with road and access infrastructure that connect directly to the urban core of Quevedo, facilitating access and, therefore, increasing their attractiveness for residential and commercial development. The proximity of these sectors to main transportation routes is a determining factor in their selection for expansion, as it facilitates the mobility of residents and enhances access to basic goods and services (Fig. 12).
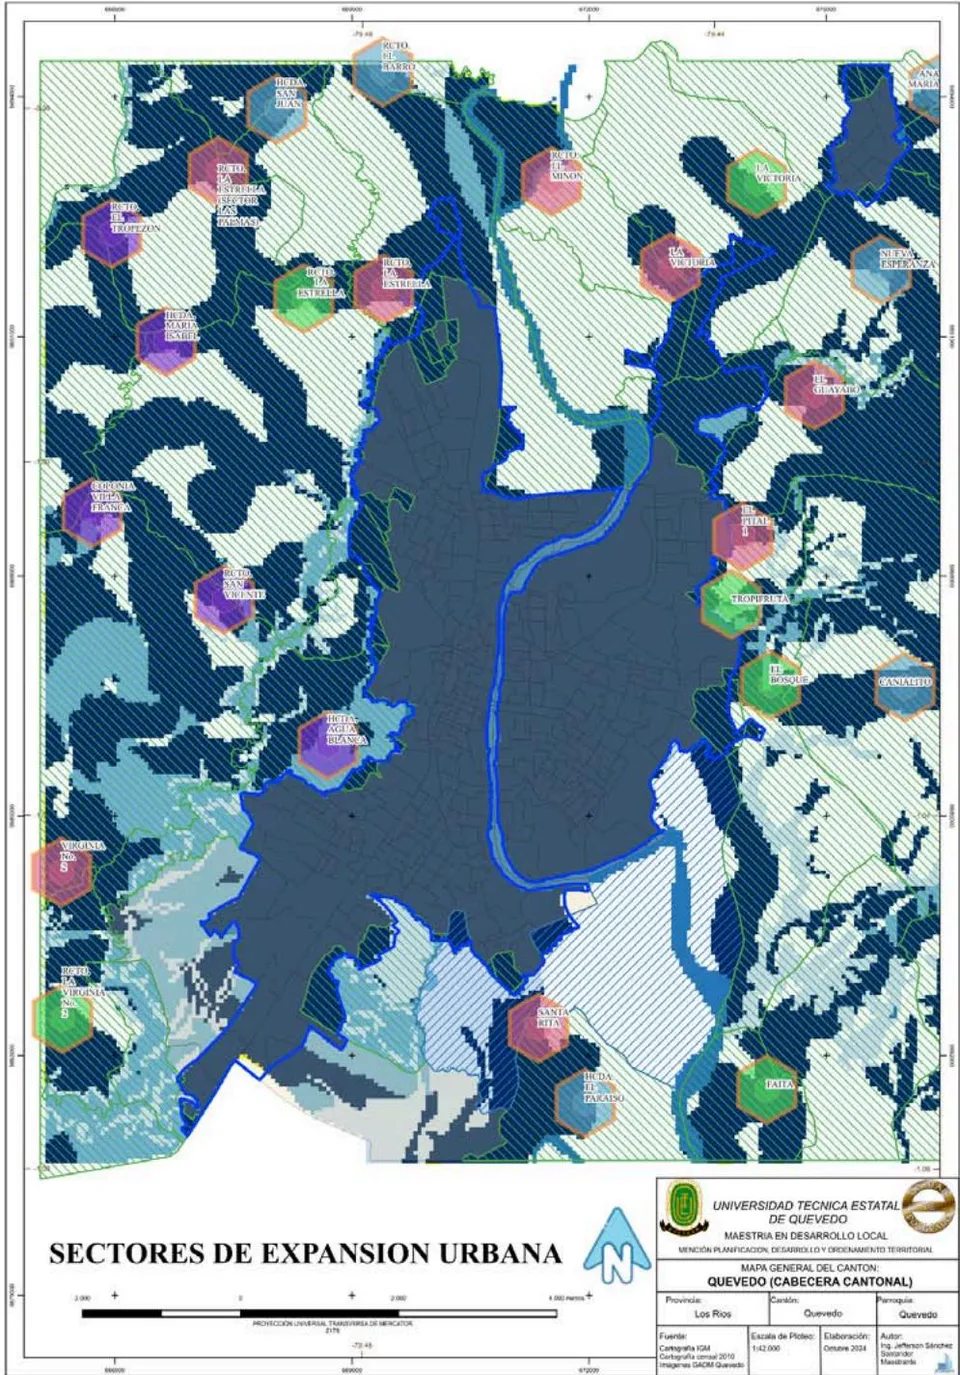
Based on the analysis of data obtained from the urban expansion scenario modeling process and looking toward 2030, the areas of the Quevedo canton with a high projection of urban expansion are revealed, highlighting strategic sectors located mainly on the outskirts of the consolidated urban area. These sectors, with greater predominance located in the northern part of the city, include areas identified as: El Guayabo, El Bosque, Tropifruta, La Victoria, Nueva Esperanza, Recinto El Minón, La Estrella (Las Palmas sector), and a slight projection in the south and southwest where the sectors known as Hacienda Agua Blanca, Santa Rita, Virginia N°2, Faita, among others, are located. The concentration of areas prone to expansion in these sectors suggests a tendency for urban growth to shift towards peripheral areas, which coincides with the need for infrastructure and basic services development in these areas.
Within the geospatial analysis, a combination of urbanizable zones and rural areas, especially those used for agriculture and forestry, also stands out, suggesting potential land-use conflicts between urban expansion and the preservation of agricultural land. This projected expansion presents challenges in terms of balancing urbanization and the protection of natural resources. Therefore, it is crucial to establish planning policies that ensure the sustainable development of these areas, avoiding the loss of productive land.
IV. DISCUSSION
The analysis of urban growth in Quevedo, supported by an exhaustive collection and review of data from the various sources investigated, ensured the reliability and accuracy of the results obtained. The integration of information from key institutions, such as the Military Geographic Institute (IGM), the National Institute of Statistics and Census (INEC), the Ministry of Agriculture and Livestock (MAG), and the municipality of Quevedo, established a solid foundation of geospatial and socioeconomic data. These data covered critical aspects for modeling urban expansion scenarios in the city of Quevedo, such as land use, infrastructure for services and basic facilities, and demographic patterns, allowing for a comprehensive view of urban expansion in the canton.
IGM mapping and INEC census data provide precision in land-use classification and delimitation, while MAG data contribute to understanding areas of agricultural value that could be affected by urban expansion (Ulloa and Martín, 2024). Specifically, MAG data reflected significant changes in land categories between 2010 and 2020.
The agricultural area experienced a 24.1% reduction, going from 17,683.4 hectares in 2010 to 13,442.3 hectares in 2020, while the urban area increased by 56.4%, from 2,226.9 hectares to 3,482.4 hectares over the same period. Likewise, an increase in the forest area was observed, which went from 800.0 hectares in 2010 to 2,005.5 hectares in 2020, suggesting reforestation efforts or changes in land use. Similarly, livestock use showed growth from 2,444.8 hectares to 3,022.2 hectares, while the water body category (double river) increased from 806.5 hectares to 1,306.2 hectares.
These changes reflect a transformation in land use that, while responding to the dynamics of urban expansion and population growth, also poses challenges in terms of territorial planning and sustainability (Salazar et al., 2020). The reduction in agricultural land and the increase in urban land indicate growing pressure on productive resources, underscoring the importance of territorial planning strategies that seek a balance between urban development and the conservation of strategic land for agricultural, livestock, and forestry production.
The application of the Markov chain (CA-Markov) in IDRISI software, as mentioned (Viana et al., 2022), is one of the most effective methods for modeling stochastic and probabilistic evolution processes, especially when the only available information is the current state of the system. This application, combined with data preprocessing in ArcGIS, allowed the development of a robust and detailed projection of urban expansion in Quevedo from 2030 to 2090. The modeling results clearly show how factors such as land use type, proximity to main communication routes, and proximity to population centers are key determinants of the direction and pace of future urbanization.
Considering the prospective urban expansion scenarios for Quevedo, it can be seen that without an adequate land use and management plan, urban growth could jeopardize highly valuable agricultural areas, affecting both the economic and territorial sustainability of the canton. This situation is worrying, since studies carried out in Ecuador have shown that uncontrolled urban expansion and the consequent loss of agricultural land negatively affect the environmental balance as well as food security and the local economy, a problem already observed in other cities with similar growth patterns, as indicated by (Ortiz, 2023). The projection to the year 2090 also points to the danger of dispersed urban development, which could lead to disconnected areas with limited access to basic services, increasing territorial and social inequalities in the region.
The generation of urban expansion scenarios in the Quevedo canton suggests a series of significant impacts on various aspects of the canton's urban environment, including access to basic services, security, and economic activity in the areas with the greatest growth projections. This third outcome focuses on understanding how projected urban growth will influence these three fundamental aspects, considering both quantitative data derived from geospatial modeling and the opinions of key stakeholders interviewed, including municipal officials and neighborhood leaders.
Urban expansion into peri-urban areas poses a significant challenge in terms of service management. The areas with the greatest potential for expansion, such as the neighborhoods of El Guayabo, La Estrella, and Santa Rita, currently face limitations in drinking water, sewage, and electricity infrastructure. The Director of Planning for the Municipal GAD stated that proximity to access roads and the availability of infrastructure significantly influence zoning decisions and investment prioritization in these areas. However, he mentioned that rapid and significant expansion could exceed existing capacity, which would put greater pressure on municipal resources to improve or expand these services in these areas.
Previous studies have shown that in similar situations, considering the conversion of land to urban uses without adequate planning, it has complicated the delivery of basic services, such as drinking water, electricity, and waste management, particularly in areas with rapid population growth. According to Salazar et al., 2021, (Salazar et al., 2020).
Urban sprawl could also increase the risks of insecurity in areas with low connectivity and limited police presence (Cabrera et al., 2020). Expansion into peri-urban areas complicates the work of police surveillance, which, according to the councilor, taking his words, expansion into rural areas often increases the risk of crime by making constant surveillance difficult (Cabrera-Barona et al., 2020). This phenomenon is supported by studies that indicate that rapid urban growth has been linked to an increase in security problems, particularly in areas of informal settlements that lack appropriate infrastructure. This problem is generating a greater perception of insecurity among residents of the sector and the community in general (Bonilla et al., 2020). (Ortiz, 2023).
Economic activity, in general terms, anticipates that urban growth or expansion could expand opportunities for developing businesses and services and generating employment for the local population. However, residents of areas like El Guayabo maintain that the local economy still faces significant limitations. While the arrival of new residents has favored the establishment of small businesses, such as neighborhood stores, real economic growth in the community requires stronger support from municipal and government authorities. This requires public investment in infrastructure and policies that promote the formalization and diversification of stable jobs, capable of guaranteeing solid and recurring income for families, thus incentivizing local consumption.
The research of (Donoso & Sarmiento, 2020) (Ortega and Pino, 2021) supports this idea, demonstrating that an urban expansion process where effective territorial planning is implemented attracts investment and promotes local employment, especially in activities such as commerce and construction, which becomes a boost for the local economy, while a disorderly expansion without planning by the competent authorities tends to slow down development due to the lack of adequate services and incentives for companies.
V. CONCLUSIONS
The analysis of urban growth in Quevedo between 2010 and 2020 revealed a significant transformation in land use, with a reduction in agricultural areas from 17,683.4 to 13,442.3 hectares and an increase in urban areas from 2,226.9 to 3,482.4 hectares, reflecting sustained expansion. The integration of geospatial and temporal data from official sources allowed for precise mapping of these dynamics, correlating them with demographic factors, infrastructure, and territorial regulations. The use of GIS tools enabled a detailed comparative analysis, identifying key spatial patterns for territorial planning.
Geospatial modeling of urban expansion scenarios in Quevedo with a 2030 vision allowed for the accurate projection of territorial growth and its future implications. The implementation of the Markov Chain-based methodology and the use of IDRISI software made it possible to identify sectors with a high probability of conversion to urban land, such as El Guayabo, El Pital 1, La Victoria, Recinto El Minón, Recinto La Estrella, Recinto La Estrella (Las Palmas Sector), Santa Rita, Virginia No. 2, El Bosque, Faita, La Victoria, Tropifruta, Colonia Villa Franca, Hacienda Agua Blanca, Hacienda María Isabel, Recinto El Tropezón, Recinto San Vicente, Ana María, Cañalito, Hacienda El Paraíso, Hacienda San Juan, Nueva Esperanza, and Recinto El Barro, considering key factors such as land use, proximity to roads, and population centers. The results showed sustained urban growth, projecting a 32% increase in 2030 and reaching 144% by 2090, with a significant impact on the reduction of agricultural and livestock areas. Uncontrolled expansion could generate land-use conflicts and challenges in the provision of basic services, requiring land-use planning strategies that balance urbanization with environmental and productive sustainability.
The analysis of urban expansion in Quevedo demonstrated its significant impact on access to basic services such as drinking water, sewage treatment, electricity, and public transportation, as well as access to educational institutions, health sub-centers, security, and economic activity. The identification of sectors with high growth projections, such as El Guayabo, El Pital 1, Faita, La Estrella, Santa Rita, and La Virginia, revealed that rapid urbanization generates a growing demand for essential infrastructure, which can exceed municipal capacity if not properly planned. Furthermore, it was determined that expansion into peri-urban areas such as the Tropifruta sector, Colonia Villa Franca, Hacienda Agua Blanca, Hacienda María Isabel, Recinto El Tropezón, Recinto San Vicente, Ana María, Cañalito, Hacienda El Paraíso, Hacienda San Juan, Nueva Esperanza, and Recinto El Barro, presents security risks due to poor connectivity and limited surveillance coverage, highlighting the need for integrated land use and control strategies. In the economic sphere, while urban growth has boosted trade and job creation in specific sectors, the lack of infrastructure and strategic planning limits its sustainable development.
Conflict of Interest
The authors declare no conflict of interest.
Ethical Approval
Not applicable
Data Availability
The datasets used in this study are openly available at [repository link] and the source code is available on GitHub at [GitHub link].
Funding
This work did not receive any external funding.
References
Cite this article
Related Research

Special Issue
Launch a focused special issue to highlight research, emerging trends, and expert insights in your academic field.