

Explore Digital Article Text
I. INTRODUCTION
Yam (Dioscorea spp.) is widely cultivated in West and Central Africa, Asia and South American countries. More than 90% of the global world yam production (30 million tons of fresh tubers per year) is produced in West Africa (FAO, 2007).
In West Africa, yam contributes approximately one-third of the calorific intake (FAO, 2007). Yams are an excellent source of carbohydrates, energy, vitamins (especially vitamin C), minerals and protein. Some cultivars of yam have been found to contain protein levels of 3.2 – 13.9% of dry weight. A yam meal could supply 100% of the energy and protein, 13% of the calcium and 80% of the iron requirements of an adult male (Oke, 1990).
Starch in yam tubers is frequently converted to sugars probably as a result of stress experienced during growth and storage. The sugar content is influenced by variety, location and cultural treatment. The free sugars consist mainly of sucrose and glucose, with the former predominating. Fructose and maltose have been detected during dormancy/sprouting periods (FAO, 2010).
The most common use of yam is as a boiled vegetable with some kind of sauce, but the skin may be removed before or after boiling, since it is normally not eaten. In West Africa, yam is often pounded into a thick paste after boiling and is eaten with soup (Orkwor et al., 1998). Yam is also processed into flour that is used in the preparation of another type of paste. It may also be baked, fried, roasted or mashed to suit regional tastes and customs. Other specific ways of preparing yam (puree, dry chips as basic ingredients for snack (Okaka et al., 1991).
The demand for yam tubers in Nigeria has always exceeded its supply, partly because an estimated average of over 50% of the yam tubers produced and harvested in Nigeria are lost in storage (Onayemi, 1983). Root and tuber crops are still living organisms after they have been harvested and losses that occur during storage arise mainly from their physical and physiological conditions. The main causes of loss are associated with mechanical damage, physiological condition (maturity, respiration, water loss, sprouting), diseases and pests. To ensure effective storage of root and tuber crops, these major causative factors need to be properly understood and, where appropriate, be properly controlled, taking into account the socio-economic factors which prevail in the areas of production and marketing (FAO, 1998). In view of the influence of sprouting on post-harvest losses, efforts have been made to prolong dormancy by applying sprout regulators (Afoakwa and Sefa-Dedeh., 2001). During long-term storage of yam, changes in starch, sugars, and protein take place. A study of the physical, chemical and sensory changes occurring in white yams (Dioscorea rotundata) and yellow yams (Dioscorea cayenensis) stored for 150 days in traditional barns showed losses in moisture, dry matter, crude protein and ascorbic acid after 120 days of storage (Onayemi and Idowu.,1988). A similar study reported a 17-22% reduction in weight, 30-50% reduction in crude protein and 38-49% increase in sugar content for two cultivars of white yams (D. rotundata) stored in a barn. Chemical methods used in prolonging dormancy and controlling sprouting of yam tubers were found to be effective but with resultant changes in culinary properties (Osunde and Orhevba., 2009). The most practical and affordable method of sprout control method used by most farmers in Nigeria and West Africa is the manual sprout removal method. However, there is little or no information on how the methods affect the physicochemical properties of different sizes of yam tubers during storage. Therefore, this work aims at investigating manual sprout removal and effect of tuber size on some physicochemical properties of stored yam.
II. MATERIALS AND METHODS
2.1 Sources of yams tubers
Yam tubers of Ameh were purchased directly from a known yam market at Zakibian in Benue State, Nigeria. History of the yams showed that they were not freshly harvested but were fully matured before harvest.
2.2 Grouping of yam tubers in terms of sizes and weighing
The method of Etudaiye et al., (2016) was used. Tuber sizes were characterized as small ( ), medium (0.6-0.9Kg) and big ( ). Weights of yam tubers were determined with an electronic scale (S.METER, Hz-2000g/0.1g) of 2Kg maximum weigh scale of 0.1 decimal points.
2.3 Laboratory yam store and storage of yam tubers
Experimental yam tubers were placed on shelves in a laboratory yam store located within the National Root Crops Research Institute, Umudike, Nigeria.
2.4 Manual sprout removal method used
The method employed by Tschannen, (2003) was used. The primary nodal complex (PNC), that is the bud-bearing organ at the apical end of the tuber, was either fully or half removed. Manual sprout removal methods used were (i) Hand-pick where the primary nodal complex was removed by hand picking or hand snap at intervals of 2 weeks during storage; (ii) Half-cut where the PNC was cut half way before storage, depending on the length of the bud and (iii) Full cut where the PNC was completely removed before on set of storage. The control served as a base line to other methods used in determining best manual sprout removal across tuber size and their effects on product quality.
additive model for interaction: Sample size is 108 tubers based on 1 yam variety, 3 tuber sizes, and 4 treatments, replicated 3 times, one storage technique a to, 8 and 16 weeks storage period.
Completely Randomized Block Design (RCBD) or Two-way classification was used with a linear or
2.6 Starch isolation from yam
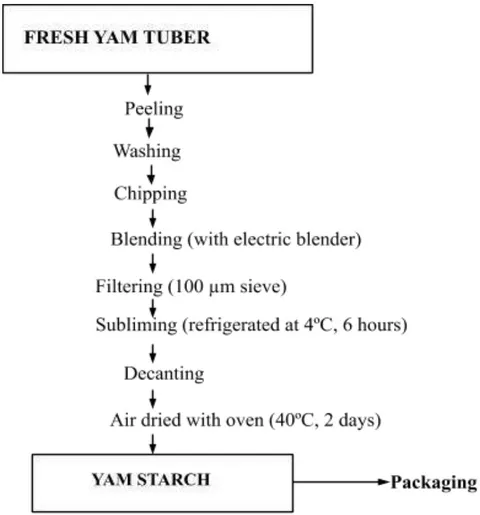
Starch isolation was done with the method recommended by Ceballos et al., (2007) as shown in Figure 1. Freshly cut yam pieces were suspended in tap water in a 2L capacity electric blender. The tubers pieces were blended into slurry which was filtered through a sieve. The starch was allowed to settle in a 200 ml beaker and refrigerated for 12 hours at . The supernatant was decanted and the starch sample dried in an oven with fan-forced ventilation at for 2 days.
2.5 Experimental design
2.7 Processing of yam into flour
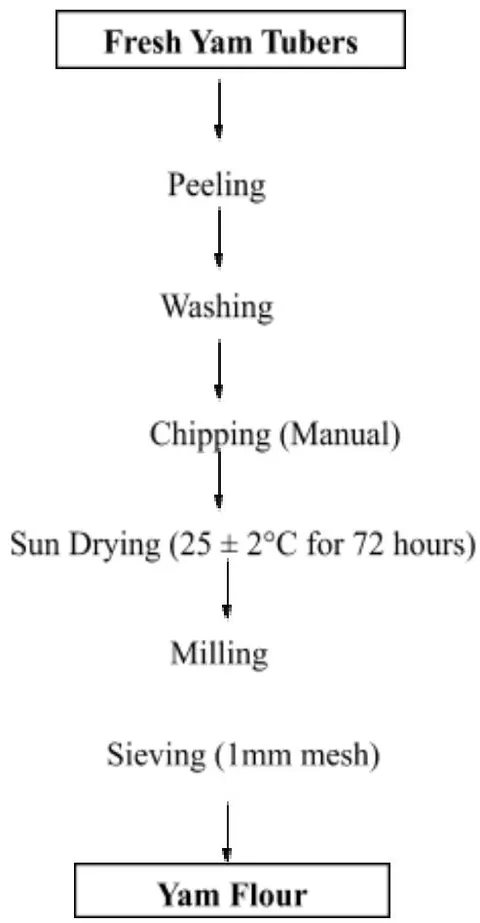
The method recommended by Ceballos et al., 2007 was used. Freshly cut yam pieces were spread on a stainless steel tray and sun-dried for 72 hours. The sundried yam chips were then dried in an oven with a fan- forced ventilation at for 24 hours. The dried chips were milled, sieved (1 mm mesh size) and stored in a low density polyethylene (LDPE) bag for analyses (Figure 2).
2.8 Determination of Temperature and Relative Humidity
Temperature and Relative humidity in the yam storage laboratory house were recorded with the aid of a LASCAR data logger (EL-USB-2-LCD PLUS), DH/IL MP, made in China (Tschanen, 2003).
2.9 Determination of weight of tuber
The weights of yam tubers and sprouts were determined using an electronic loading scale balance sensitive to 0.1 Kg as described by (Tschanen, 2003). The cumulative weight loss was based on the original weight of tuber.
I. WL = ((Wa - Wb) / Wa x 100
WL = percentage weight loss
Wa = original fresh weight of tuber (kg)
Wb = present weight of tubers
2.10 Determination of periodic sprout count
The method recommended by (Tschanen, 2003) was used. Total sprout count is number of sprouts occurring on yam tubers in a batch and across tuber sizes.
2.11 Determination of Dry matter Content
Moisture and dry matter contents were carried out using AOAC (1996) method. A clean eighing petri dish was placed in an oven and dried at C for 30 minutes, cooled in a desiccator and weighed ( ). Some 2g of the each sample was weighed into the Petri dish and re-weighed (b). The Petri dish with the sample was dried in an oven at C for 5 hours and cooled in a desiccator. The procedure was repeated until a constant weight (c) was achieved.
II.% moisture content (MC) = b - w
Where
Dry matter content (DM) = 100 - moisture content.
2.12 Determination of reducing sugars
Reducing sugar and starch contents were determined using the methods recommended by Ceballos et al., (2007). Weigh 100 mg of the sample and extract the sugars with hot 80% ethanol twice. Collect the supernatant and evaporate it by keeping it on a water bath at 80 °C. Add 10 ml water and dissolve the sugars. Pipette out aliquots of 0.1 or 0.2ml to separate test tubes. Pipette out 0.2, 0.4, 0.6, 0.8 and 1ml of the working standard solution into a series of test tubes. Make up the volume in both sample and standard tubes to 2ml with distilled water. Pipette out 2ml distilled water in a separate tube to set a blank. Add 1ml of alkaline copper tartrate solution to each tube. Place the tubes in boiling water for 10 minutes. Cool the tubes and add 1mL of arsenomolybolic acid reagent to all the tubes. Make up the volume in each tube to 10 ml with water. Read the absorbance of blue colour at 620 nm after 10 minutes. From the graph drawn, calculate the amount of reducing sugars present in the sample.
III. Calculation
Absorbance corresponds to 0.1 ml of test sample = x mg of glucose
10 ml contains = x/0.1 × 10 mg of glucose =% of reducing sugars
2.13 Colorimetric Determination of Amylose in starch
The method recommended by Ceballos et al., (2007) was used. Weigh 100 mg of yam starch into 100 ml volumetric flask. Add 1 ml 95% ethanol and 9 ml 1 N NaOH. Heat the sample for 10 minutes in boiling water bath, cool it and make up the volume to 100 ml. Pipette 5 ml from the 100 ml into another 100 ml volumetric flask. Add 1 ml I N acetic acid and then 2 ml iodide solution and make up the volume to 100 ml. Shake, stand for 20 minutes and determine the percent Transmittance at 620 nm using a colorimeter. Prepare a series of standard starch solution containing 0, 20, 40, 60, 80 and 100% amylose as in the steps 1 to 5. Read the transmittance of the standards at 620nm and plot a standard graph. Amylose content of the sample is determined in reference to the standard curve and expressed on percent basis.
2.14 Determination of Bulk Density (BD)
The method recommended by Etudaiye et al., (2008) was applied. Some 50 g of yam flour sample was weighed into a 100 ml graduated cylinder and tapped constantly against a table (10-15 times) until there was no further change in volume. Bulk density was expressed as weight of sample per unit volume of the sample. Determinations were made in triplicate and mean values recorded.
IV. Bulk density (BD) = (g/ml)
Where:
weight of sample
volume of sample
2.15 Determination of Water absorption capacity (WAC)
The method described by Etudaiye et al., (2008) was applied. Some 1g of the yam flour sample was weighed into 15ml centrifuge tube. Ten (10ml) of distilled water was added, mixed thoroughly and allowed to stand for 1hour at . The slurry was centrifuged at 2000 - 5000 ppm for 30 minutes. Excess water was decanted after centrifugation by inverting the tube over absorbent paper and allowed to drain dry. The volume of the drained water (supernatant) was measured in a calibrated measuring cylinder and recorded. The volume difference was recorded as the volume of water adsorbed or retained by 1g of sample. Measurements were made in triplicate and average volume recorded.
\begin{array}{c} \text{V. WAC = (V_{1} - V_{2}) g / ml} \\\text{Where:} \end{array}Initial volume of water before centrifugation final volume of water after centrifugation
2.16 Statistical analyses
Means of replicated data collected were calculated and subjected to Analysis of variance (ANOVA) using Statistical Analytical System software, version 8(SAS,2000). Mean separations for significant differences was carried out using Fisher LSD.
III. RESULTS AND DISCUSSION
3.1 Effect of manual sprout removal on sprout count of Ameh during storage
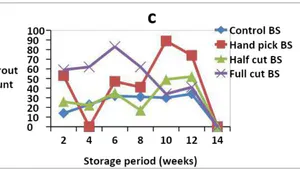
The sprout counts (SC) of different tuber size of Ameh during storage are shown in Figures 3a-c. For small sized tubers, it showed that SC was highest in half cut (hc) and lowest in the control (c). Sprout count followed the order hc > fc > hp (Figure 3a). Sprout count in hp, hc and fc at 2 weeks storage were lower than the control while no sprout were observed in hp after 4 weeks storage. Generally, sprout count in hc increased as storage period increased. Sprout removal methods on SS tubers of Ameh showed that hand pick was most effective during 14 weeks storage. Sprout count increased with storage time in the order hc>fc>hp>c. Sprout count of medium sized tubers (Figure 3b) showed similar trend like that of small size tubers except in hp that was nil within the first 4 weeks of storage. Sprout count was in the order hc > hp < fc. Sprout count in the control increased up to 12 weeks. Sprout count in the hp increased to 8 weeks and decreased at 4, 10, 12 and 14 weeks storage. Sprout count in the full cut decreased to 8 weeks and increased up to 12 weeks and then decreased at 14 weeks. Decrease in fc was twice. Sprout count in hc increased at 2,4 and 6 weeks storage, reduced at 8 and 10 weeks and increased at 12 and 14 weeks. Sprout count across the methods used for sprout removal was nil during the 14 weeks storage. Figure 3c shows sprout count of big sized tubers, there was similar trend like that of small size tubers (Figure 3a). Sprout count increased in the order hp > fc > hc during 6 and 8 weeks. Sprout count in the fc increased progressively. Sprout count in the fc increased to 12 weeks, and then decreased to 14 weeks. Sprout count in the hp decreased to 8 weeks, then increased to 10 weeks and decreased to 14 weeks. Sprout count in the control increased to 12 weeks and decreased to 14 weeks. Sprout count across the methods used for sprout removal was nil during 14 weeks storage. The study showed that sprouting is the major factor that contribute and account for losses of yam tubers during storage. Generally, sprouting was significantly high at the onset of storage. However, sprout control by handpick reduced at 2 weeks storage period. Without any pre-storage treatment, it was difficult for sprouting to be controlled. Mozie (1984) reported that, high rate of ventilation reduces the growth rate of vines in stored tubers. Sprout control by handpick was most effective on the stored tubers of the three yam varieties as the method recorded lower rot rate during storage. Variations in sprout count across the different tuber sizes of the yam varieties is in line with the report of Knoth (1993) that the duration of natural dormancy fluctuate according to the variety of yam between 4-18 weeks. Sprout count showed no consistency across the treatments, among tuber sizes and at different storage. This may be as a result of polar sprouting, that is, partial distribution of sprouts on yam tubers. Another condition for this may be as a result of apical control or classical apical dominance, because they are characterized by competition between true buds ((Tschanen, 2003). Yam tubers were meant to store for 16 weeks but rot was observed at 14 weeks. Post-harvest losses of yam in storage have been attributed to such factors as sprouting, respiration, evaporation and spoilage micro-organisms (Osagie, 1992). The dormant state is characterized by lack of visible growth of sprout or vine on the tuber. Variation in dormancy and subsequent sprouting may be attributed to age of tubers and yam variety used. Eze (2011) reported that the readiness with which a yam tuber sprouted depended on the physiological age of the tuber. Although, the sprout is the only visible factor of loss in sound tubers, both respiration and evaporation are also important. Respiration is the oxidative breakdown of starch, sugar and organic acids with simple molecules as carbon dioxide and water lead to dry mass loss in stored yam while other source of loss is total damage through rot caused by microorganisms (Eze, 2011).
{"image_source":{"path":"images/312f563901181c8937b181b6cbfd434212f1115e17d74f3f704b8115460de2e4.jpg"},"content":"","chart_caption":[],"chart_footnote":[]} {"image_source":{"path":"images/ef19ff99d765150b5bee284cf06a3f0db87c497183798a5a0a6561e2bfb13f05.jpg"},"content":"","chart_caption":[],"chart_footnote":[]}
{"image_source":{"path":"images/864f530e0fa91d1c4c1d3cf92705d05f58fcdd859bdd8e032f401b76a7786eda.jpg"},"content":"","chart_caption":[{"type":"text","content":"Figure 3a-c: Sprout counts on small, medium and big sized tubers of Ameh as affected by manual sprout removal during 16 weeks storage"}],"chart_footnote":[]}
3.2 Temperature and relative humidity within yam storage environment
Temperature was within room temperature while relative humidity was slightly high (Table 1). Temperature ranged from 23.21 °C to 27.79 °C while relative humidity ranged from 84.62 to 93.86%. Average temperature and relative humidity during storage were 25.52 °C and 89.85%, respectively. Storage of yam tubers at a relative humidity of 80% and temperature of 16°C reduces moisture loss and delays sprouting. Osunde (2008) recommended that 15 °C is a safe temperature for storage of yam and it inhibits sprouting for six months. Though rot in yam tubers was at 14 weeks but temperature and relative humidity were recorded for 16 weeks.
| Storage (Weeks) | Temperature (°C) | Relative Humidity (rh) |
| 0 | 25.50 | 90.00 |
| 2 | 25.75 | 91.00 |
| 4 | 25.18 | 91.00 |
| 6 | 24.89 | 92.11 |
| 8 | 23.21 | 93.86 |
| 10 | 26.39 | 87.54 |
| 12 | 25.47 | 89.97 |
| 14 | 25.83 | 89.50 |
| 16 | 27.79 | 84.62 |
| Average | 25.56 | 89.96 |
| Minimum | 23.21 | 84.62 |
| Maximum | 27.79 | 93.86 |
3.3 Effect of manual sprout removal and tuber sizes on weight loss of Ameh during storage
Weight loss of stored yam tubers of Ameh with manual sprout removal is shown in Table 2.
Weight loss was determined up to 18 weeks storage time (at 2 weeks intervals). Increase in weight loss of tubers during storage may be attributed to sprouting related activities across treatments and sizes. This is in line with the report of Jerkins (1981) that the physiological losses through respiration and evaporation of moisture increased during sprouting. Percentage weight loss of small size (SS), medium size (MS) and big size (BS) tubers of the control, hand pick, half cut and full cut were lowest at 2 weeks storage and highest at 18 weeks. Weight loss in stored tubers using different cutting method to control sprouting showed that untreated tubers (control) of SS ranged from 6.06 – 54.55%, MS 4.29-60.00% and BS 11.50- 65.49%. WL with hand picking for SS tubers ranged from 20.00 – 60.00%, MS 9.45- 60.81% and BS 15.46- 75.18%. WL with half cut for SS tubers ranged from 23.08 – 63.59%, MS 1.54- 46.00% and BS 14.95- 53.18%. WL with full cut for SS tubers ranged from 10.23 – 58.97%, MS 8.97-65.39% and BS 13.91- 65.04%. Weight loss across tuber sizes was in the order ms>bs>ss. Weight loss across treatment per tuber size were compared. Weight loss in BS tuber was lowest in the control. For MS tubers, weight loss was lowest with half cut. Weight loss was lowest in tubers with hand picking. Osunde et al., (2003) reported an increase in weight loss (17-22%) for two cultivars of white yams (D rotundata) stored in a barn. Weight loss of tubers with manual sprout removal was generally lower than the weight loss in the control. Osunde (2008) reported percentage weight loss for tubers with and without sprouts after 18 weeks of storage in the barn and improved pit storage for two cultivars of D. rotundata, the weight loss for tubers with removed sprout was lower than when the sprout was not removed. Weight loss is influenced by temperature, relative humidity, the rate of air movement surrounding the tuber, most significantly, the permeability of the skin and how this may have been affected (FAO,1998).
| Storage period | BS | MS | SS | ||||||||
| Cr | Hp | Hc | Fc | Cr | Hp | Hc | Fc | Cr | Hp | Hc | |
| 2 | |||||||||||
| 4 | |||||||||||
| 6 | |||||||||||
| 8 | |||||||||||
| 10 | |||||||||||
| 12 | |||||||||||
| 14 | |||||||||||
| 16 | |||||||||||
| 18 | |||||||||||
| LSD (0.05) | 0.31 | 0.05 | 0.11 | 0.04 | 0.53 | 0.03 | 0.09 | 0.06 | 0.31 | 0.10 | 0.04 |
Key: ocr (Untreated); HP (hand pick); HC (half cut); FC(full cut); LSD (Least Significant Difference); BS (big size); MS (medium size) and SS (small size)
3.4 Effect of manual sprout removal and tuber sizes on dry matter content and starch yield of Ameh during storage
Table 3 shows the effect of storage over 16 weeks on dry matter and starch yield of tubers during storage. The mean dry matter content was lowest in big sized tubers (30.77%) and highest in small sized tubers (34.75%). Low dry matter in big sized tubers indicated higher moisture content, low evaporation and respiration rates probably resulting from a less compact arrangement of starch granules in the endosperm. Eze (2011) reported a decrease in moisture content of stored tubers resulting in an increase in dry mass. Dry matter was highest in the control during 8 weeks storage period (45.29%) and lowest in same tubers (18.82%) at 16 weeks storage period. There was a significant difference (p=0.05) in dry matter content of tubers with different manual primary nodal complex (PNC) cutting methods except in tubers with non-removal of PNC (control) and manual PNC removal with hand picking at 8 weeks storage. At 16 weeks, dry matter content was highest in small sized tubers (34.75%) and lowest in big sized tubers (30.77%). Rot in tubers was noticed at 16 weeks storage. The results on changes in dry matter caused by manual sprout removal conforms with the work of Hamadina and Asiedu (2015) who reported that dry matter increased in the first instance due to surface evaporation, and then declines gradually during dormancy due to respiration at low metabolic rate, and then, rapidly during sprouting due to increased metabolic rate. The study showed that tuber sizes and treatment during storage had significant (p >0.05) effect on dry matter content. Within tuber sizes, BS tubers of had the lowest dry matter content.
Starch yield was highest in medium sized tubers (25.88%) and lowest in big sized tubers (20.58%). Starch yield was highest in the control at 8 weeks storage (25.45%) and lowest in tubers with half cut (20.43%) at 16 weeks storage. There was a significant difference (p>0.05) in starch yield during storage. Starch yield decreased as storage period increased. At 16 weeks, starch yield was highest in MS tubers (25.88%) and lowest in BS tubers (20.58%). Interactions between manual sprout removal methods, storage period and tuber sizes on starch yield was highly significant (p=0.01). Starch and sugar content have been shown to change in a definite manner during dormancy and sprouting. The starch contents of the stored tubers reduced with increase in storage time. (Hamadina and Asiedu, 2015). Passam et al (1978) obtained similar results and attributed it to the metabolic processes in yam which convert starch to sugar.
| Storage period | Dry matter | Starch yield | ||||||
| BS | MS | SS | Mean of storage period | BS | MS | SS | Mean of storage period | |
| oCr | 30.45 | 35.93 | 35.11 | 18.80 | 25.93 | 24.25 | ||
| 8Cr | 49.40 | 44.02 | 42.45 | 21.44 | 28.25 | 26.66 | ||
| 16Cr | 17.46 | 18.44 | 20.54 | 24.34 | 24.86 | 24.04 | ||
| oHp | 30.45 | 35.93 | 35.11 | 18.80 | 25.93 | 24.25 | ||
| 8Hp | 43.23 | 45.04 | 47.46 | 22.30 | 27.32 | 25.76 | ||
| 16Hp | 17.36 | 23.24 | 21.13 | 20.86 | 24.90 | 23.75 | ||
| oHc | 30.45 | 35.93 | 35.11 | 18.80 | 25.93 | 24.25 | ||
| 8Hc | 43.09 | 38.87 | 40.86 | 22.57 | 26.07 | 25.12 | ||
| 16Hc | 17.54 | 21.34 | 38.87 | 20.28 | 21.77 | 19.26 | ||
| oFc | 30.45 | 35.93 | 35.11 | 18.80 | 25.93 | 24.25 | ||
| 8Fc | 39.24 | 34.43 | 43.17 | 20.23 | 27.43 | 26.07 | ||
| 16Fc | 20.13 | 21.91 | 22.12 | 19.79 | 26.23 | 20.26 | ||
| Mean of Yam size | ||||||||
| Size (0.05) | <0.0001 | 0.11 | <0.0001 | 0.08 | ||||
| Storage period (0.05) | <0.0001 | 0.22 | <0.0001 | 0.16 |
Mean values down the columns with same superscript are not significantly different (p<0.05)
Key: ocr (Untreated week 0); oHP (hand pick week 0); oHC (half cut week 0); oFC (full cut week 0); 8cr (Untreated week 8); 8HP (hand pick week 8); 8HC (half cut week 8); 8FC (full cut week 8); 16cr (Untreated week 16); 16HP (hand pick week 16); 16HC (half cut week 16); 16FC(full cut week 16); LSD (Least Significant Difference); BS (big size); MS (medium size) and SS (small size).
3.5 Effect of manual sprout removal and tuber sizes on Amylose and Total reducing sugars of Ameh during storage
The effect of storage period and tuber size on the amylose content and total reducing sugars in tubers during storage is shown in Table 4. Storage was from week 0 to 16 weeks. Comparison was between control and hand pick PNC removal method during storage. This was based on the fact that hand pick PNC removal method had lowest sprout count during storage. Amylose content was highest in medium sized tubers (13.13%) and while the lowest was in big sized tubers. Amylose decreased with storage. There was a significant difference in amylose content during storage. Amylose is important in plant energy storage. It is less readily digested than in plants. It makes up about 30% of the stored starch in plants, though the specific percentage varies by species and variety (Wang et al., 2017). Interactions between storage period and tuber size was highly significant .
There was a significant difference in TRS during storage. For tuber sizes, TRS was highest in BS and MS tubers during storage. Total reducing sugars increased as storage period increased. During long-term storage of yam, changes in starch, sugars, and protein take place (Afoakwa and Sefa-Dedeh, 2001). In D. dumetorum stored under ambient and cold room conditions there was a rapid drop in moisture and starch content and an increase in the total soluble sugars and reducing sugars after 72 hours (Afoakwa and Sefa-Dedeh, 2001).
| Storage period | Amylose | Total Reducing sugars | ||||||
| BS | MS | SS | Mean of storage period | BS | MS | SS | Mean of storage period | |
| o Cr | 14.49 | 14.54 | 14.68 | 3.07 | 3.10 | 3.02 | ||
| 8 Cr | 12.86 | 12.97 | 12.83 | 3.11 | 3.15 | 3.02 | ||
| 16 Cr | 12.25 | 12.31 | 12.18 | 3.33 | 3.27 | 3.18 | ||
| Hp o | 14.49 | 14.54 | 14.68 | 3.07 | 3.10 | 3.02 | ||
| Hp 8 | 12.29 | 12.31 | 12.26 | 2.95 | 2.93 | 2.88 | ||
| Hp 16 | 12.10 | 12.15 | 12.07 | 3.15 | 3.12 | 3.04 | ||
| Mean of Yam size (kg) | ||||||||
| Size (0.05) | <0.0001 | 0.01 | <0.0001 | 0.01 | ||||
| Storage period (0.05) | <0.0001 | 0.02 | <0.0001 | 0.01 | ||||
| Size * Sp (0.05) | <0.0001 | 0.03 | 0.03 | <0.0001 | 0.02 | 0.02 |
Mean values down the columns with same superscript are not significantly different (p<0.05)
Key: ocr (Untreated week o); oHP (hand pick week o); oHC (half cut week o); oFC(full cut week o); 8cr (Untreated week 8); 8HP (hand pick week 8); 8HC (half cut week 8); 8FC(full cut week 8); 16cr (Untreated week 16); 16HP (hand pick week 16); 16HC (half cut week 16); 16FC(full cut week 16); LSD (Least Significant Difference); BS (big size); MS (medium size) and SS (small size).
3.7 Effect of manual sprout removal on bulk density (g/ml) and water absorption capacity (g/ml) of yam flour during storage
Table 5 shows the effect of storage period and tuber sizes on the Bulk density and water absorption capacity in flours processed from sample tubers during storage. Mean BD was highest in tuber with hand pick PNC removal (0.57g/ml) at 8 weeks storage and was significantly (p>0.05) different from other methods. BD was lowest in tubers with removed PNC (0.13 g/ml) at 16 weeks storage. Mean BD for tuber sizes was highest in BS tuber (0.47 g/ml) and lowest in SS tuber (0.39 g/ml). There was a significant difference (p>0.05) in BD of BS, MS and SS tubers. BD is an indication of porosity of a product which influences package design. It is affected by moisture content and particle size distribution of the flour (Etudaiye et al., 2015). High bulk density in flours indicates that they would serve as good thickeners in food products while low bulk density in flours will be suitable for the formulation of weaning food (Adebowale et al., 2005).
Water absorption capacity was highest in control (2.17 g/ml) but was not significantly different (p<0.05) from non PNC removal, hand pick PNC and full cut PNC at 8 weeks storage. WAC was lowest in tubers with hand picking, half cut and full cut PNC removals at 16 weeks. There was no significant difference (p<0.05) in their WAC. Mean tuber size of WAC was highest in BS tuber (2.00 mg/ml) and lowest in SS tuber (1.54 g/ml). There was a significant difference (p>0.05) in WAC of BS, MS and SS tubers during storage.
| Storage period | Bulk density | Water absorption capacity | ||||||
| BS | MS | SS | Mean of storage period | BS | MS | SS | Mean of storage period | |
| oCr | 0.54 | 0.56 | 0.54 | 2.18 | 2.23 | 2.10 | ||
| 8Cr | 0.54 | 0.56 | 0.54 | 2.14 | 2.20 | 2.07 | ||
| 12Cr | 0.47 | 0.48 | 0.48 | 1.91 | 1.92 | 1.90 | ||
| 16Cr | 0.40 | 0 | 0 | 1.74 | nd | Nd | ||
| o Hp | 0.54 | 0.56 | 0.54 | 2.18 | 2.23 | 2.10 | ||
| 8 Hp | 0.56 | 0.58 | 0.56 | 0.57a | 2.10 | 2.22 | 2.07 | |
| 12 Hp | 0.46 | 0.50 | 0.49 | 1.90 | 1.95 | 1.94 | ||
| 16 Hp | 0.46 | nd | nd | nd | 1.76 | nd | Nd | |
| 0 Hc | 0.54 | 0.56 | 0.54 | 2.18 | 2.23 | 2.10 | ||
| 8 Hc | 0.50 | 0.51 | 0.51 | 2.03 | 2.20 | 2.03 | ||
| 12 Hc | 0.47 | 0.50 | 0.49 | 1.90 | 1.98 | 1.95 | ||
| 16 Hc | 0.43 | 0 | 0 | 0.14e | 1.78 | nd | Nd | |
| 0 Fc | 0.54 | 0.56 | 0.54 | 2.18 | 2.23 | 2.10 | ||
| 8 Fc | 0.54 | 0.58 | 0.56 | 2.03 | 2.20 | 2.03 | ||
| 12 Fc | 0.51 | 0.52 | 0.50 | 2.03 | 2.09 | 2.01 | ||
| 16 Fc | 0.44 | 0 | 0 | 1.76 | nd | Nd | ||
| Mean size (kg) | 0.47a | 0.40b | 0.39c | |||||
| Size (0.05) | <0.0001 | 0.01 | <0.0001 | 0.03 | ||||
| Storage period (0.05) | <0.0001 | 0.01 | <0.0001 | 0.06 | ||||
| Size * Sp (0.05) | <0.0001 | 0.03 | 0.01 | <0.0001 | 0.11 | 0.11 |
8 Hp 0.56 0.58 0.56 0.57a 2.10 2.22 2.07 2.13^a 12 Hp 0.46 0.50 0.49 0.48^d 1.90 1.95 1.94 1.93^c 16 Hp 0.46 nd nd nd 1.76 nd Nd 0.59^d 0 Hc 0.54 0.56 0.54 0.55^b 2.18 2.23 2.10 2.17^a 8 Hc 0.50 0.51 0.51 0.51^c 2.03 2.20 2.03 2.19^a 12 Hc 0.47 0.50 0.49 0.48^d 1.90 1.98 1.95 1.94^c 16 Hc 0.43 0 0 0.14^e 1.78 nd Nd 0.59^d 0 Fc 0.54 0.56 0.54 0.55^b 2.18 2.23 2.10 2.17^a 8 Fc 0.54 0.58 0.56 0.56a^b 2.03 2.20 2.03 2.13^a 12 Fc 0.51 0.52 0.50 0.51^c 2.03 2.09 2.01 2.04^b 16 Fc 0.44 0 0 0.15^e 1.76 nd Nd 0.59^d Mean size (kg) 0.47a 0.40b 0.39c 2.00^a 1.60^b 1.54^c Size (0.05) <0.0001 0.01 <0.0001 0.03 Storage period (0.05) <0.0001 0.01 <0.0001 0.06 Size * Sp (0.05) <0.0001 0.03 0.01 <0.0001 0.11 0.11
| 8 Hp | 0.56 | 0.58 | 0.56 | 0.57a | 2.10 | 2.22 | 2.07 | 2.13a |
|---|---|---|---|---|---|---|---|---|
| 12 Hp | 0.46 | 0.50 | 0.49 | 0.48d | 1.90 | 1.95 | 1.94 | 1.93c |
| 16 Hp | 0.46 | nd | nd | nd | 1.76 | nd | Nd | 0.59d |
| 0 Hc | 0.54 | 0.56 | 0.54 | 0.55b | 2.18 | 2.23 | 2.10 | 2.17a |
| 8 Hc | 0.50 | 0.51 | 0.51 | 0.51c | 2.03 | 2.20 | 2.03 | 2.19a |
| 12 Hc | 0.47 | 0.50 | 0.49 | 0.48d | 1.90 | 1.98 | 1.95 | 1.94c |
| 16 Hc | 0.43 | 0 | 0 | 0.14e | 1.78 | nd | Nd | 0.59d |
| 0 Fc | 0.54 | 0.56 | 0.54 | 0.55b | 2.18 | 2.23 | 2.10 | 2.17a |
| 8 Fc | 0.54 | 0.58 | 0.56 | 0.56ab | 2.03 | 2.20 | 2.03 | 2.13a |
| 12 Fc | 0.51 | 0.52 | 0.50 | 0.51c | 2.03 | 2.09 | 2.01 | 2.04b |
| 16 Fc | 0.44 | 0 | 0 | 0.15e | 1.76 | nd | Nd | 0.59d |
| Mean size (kg) | 0.47a | 0.40b | 0.39c | 2.00a | 1.60b | 1.54c | ||
| Size (0.05) | <0.0001 | 0.01 | <0.0001 | 0.03 | ||||
| Storage period (0.05) | <0.0001 | 0.01 | <0.0001 | 0.06 | ||||
| Size * Sp (0.05) | <0.0001 | 0.03 | 0.01 | <0.0001 | 0.11 | 0.11 |
Key: ocr (Untreated week o); oHP (hand pick week o); oHC (half cut week o); oFC(full cut week o); 8cr (Untreated week 8); 8HP (hand pick week 8); 8HC (half cut week 8); 8FC(full cut week 8); 16cr (Untreated week 16); 16HP (hand pick week 16); 16HC (half cut week 16); 16FC(full cut week 16); LSD (Least Significant Difference); BS (big size); MS (medium size) and SS (small size)
VI. CONCLUSION
The study showed that hand-pick manual sprout removal was most effective on yam tubers during storage as sprout counts reduced with storage. Physicochemical parameters determined showed superior quality values in medium size tubers. The study recommends hand-pick manual sprout removal for tuber storage. Selection of medium sized tubers and application of manual sprout removal during storage can go a long way to reduce post harvest loss in stored yam while maintaining quality. Work should be carried out on product quality in food forms prepared from experimental stored tubers to ascertain their level of food quality and consumer acceptance.
PROJECT INFORMATION
This work was funded under Yam Improvement for Income and Food Security in West Africa (YIIFSWA) Project, with contribution from National Root Crops Research Institute (NRCRI), Umudike, Nigeria and International Institute of Tropical Agriculture (IITA), Ibadan, Nigeria.
Conflict of Interest
The authors declare no conflict of interest.
Ethical Approval
Not applicable
Data Availability
The datasets used in this study are openly available at [repository link] and the source code is available on GitHub at [GitHub link].
Funding
This work did not receive any external funding.
References
Cite this article
Related Research


Special Issue
Launch a focused special issue to highlight research, emerging trends, and expert insights in your academic field.