





IntelliPaper
Abstract
With the background of emergencies and the digital economy industry as the core, this paper collects the data of China's 2020 input-output table, uses network analysis technology to establish digital economy industrial networks, analyzes the structural characteristics of industrial networks, and analyzes the risk transmission characteristics of industrial networks under the impact of various emergencies by establishing cascade failure simulation models. The results show that the digital trading industry occupies a higher position than other digital economy industries in the industrial network and is an important intermediary industry in the economy. Sudden systemic financial risks cause the largest damage at the highest risk transmission speed.
Explore Digital Article Text
I. INTRODUCTION
At present, various emergencies occur frequently, which might seriously hinder the development of the global economy and have a huge impact on the economy and society of all countries in the world. In today's globalization and deep integration of industrial chain, China possesses a complete industrial chain and the operation of various industries has formed a complex and huge industrial network. However, because some industries still rely on imports of high-end parts, the huge economic volume makes it have a high demand for exotic energy. Moreover, it has relied on cost advantages to act for brands in developed countries to obtain profits, which fully exposes the weakness of China's economy. When certain emergencies occur, certain industries in the economy will be affected, and due to the transmission effect, it will have a huge impact on the overall economy.
Therefore, the analysis of the possible impact of emergencies on Chinese industries under various scenarios and how risks are transmitted in the industrial network is helpful for China to prevent and resolve its own economic risks in today's complex and changing world pattern.
II. LITERATURE REVIEW
Xu.et.al[1] study the input-output table of 41 major economies in 2009 and find that China's metal products and petroleum refining industry have important resource transmission capacity in the international trade system. At the same time, the public administration and defense sectors of the United States have a greater influence on the upstream industries and the huge defense expenditure has significantly boosted the development of the global upstream industries.
Huang.et.al[2] apply the network cascade failure model to the systemic risk of the financial network, studying the risk transmission process when the US banking industry hit by the financial crisis in 2007. They propose that the model could be used for the systemic risk stress test of the financial system.
Acemoglu.et.al [3] study macroeconomic fluctuations from the perspective of network structure and believe that industrial asymmetry is the root of economic crisis because seemingly weak shocks from marginal industries could completely cause large fluctuations of the entire economic system due to structural asymmetry.
Cerina.et.al[4] study several input-output tables of the world in the way of time series to dynamically observe the changing trend of international economic structure.
Sonis.et.al[5] provide a new idea of applying the network analysis method to the inter-regional input-output table from the perspective of mathematical reasoning to study the inter-regional transmission of economic shocks through the network system.
Li.et.al[6] apply the cascading failure network model to the material and energy exchange network in an industrial park and measure the destructive impact of a single node on the entire network when considering the cascading failure through simulation experiments including single node failure and edge failure.
Giammetti.et.al[7] analyze the impact of output damage in key industries under the epidemic on the overall supply chain structure in Italy, which is helpful to guide the government in designing lockdown or un-lockdown policies under the epidemic.
III. METHODOLOGY
Based on the input-output table data, the strongest path weighted network analysis method is used to analyze the network structure between the digital economy industry and other industries. On this basis, the industrial network cascade failure simulation model is used to analyze the impact of the dynamic process of economic risk caused by accidents.
3.1 Input-Output Network Description
3.1.1. Strongest Path (SP)
SP is used in input-output analysis to measure the path of investing the intermediate products produced by one industry and maximizing the production of another industry. Based on the direct consumption coefficient a, the strongest path coefficient is defined as , which means that the intermediate input of sector i enters the per-unit output of sector j through the strongest path:
SP from sector i to j can be defined by the following equation:
where , Dijkstra algorithm is used to search the shortest path between two nodes and form the strongest path matrix Q.
3.1.2. SP Betweenness and Closeness
(2)
Industrial betweenness refers to the number of the shortest paths between any two industries, which is used to quantify the ability of an industry to act as a medium in the network. The industry betweenness definition based on matrix Q is as follows:
where . Similarly, the SP betweenness for a particular link is:
where .
Closeness measures the proximity of a particular industry to other industries. Downstream closeness is the average value of all SPs starting from a particular sector i:
Similarly, upstream closeness is defined as the average value of all SPs ending at a particular sector j:
3.2 Industrial Network Risk Transmission Cascade Failure Process
Due to the failure of an industry in the economic network, the failure of other adjacent nodes based on the coupling relationship, leads to the phenomenon of cascade failure, and then leads to the large-scale industrial collapse in the economic network, which can be divided into the supply side and demand side are affected by the risk contagion effects.
3.2.1 Input-Output Network Risk Transmission Path Under the Supply Shocks
The normal production and operation of an industry depends on the supply of products from its upstream industry. If the upstream industry cannot produce normally, the supply will decline or be interrupted, and due to the stickiness of the supply chain and the high conversion cost, it will decrease or the industry will stop production. This process can be characterized by the network cascade failure model. When node i is affected by the supply, the supply of the adjacent node j can be used for production decreases, represents the ratio of the available production supply of node j to the production supply of the previous period:
Assuming that there is a threshold of , represents the impact intensity, when the ratio of the supply of production materials and the initial situation in the current period is lower than the threshold, the industry is determined to be suspended, and the demand for production means and the supply of products in the industry are reduced to o:
Due to the decline in the supply of production materials, the industry will provide the supply of products to other industries to decrease in the next phase. The formula is:
3.2.2 Input-Output Network Risk Transmission Path Under the Demand Shocks
Similarly, when the industry is affected and the demand drops, the purchase of production materials will be reduced accordingly, affecting the income of the upstream industry and bringing about the overall contraction of the demand. When node i is affected by demand, the demand of the adjacent node j can be used for production will decrease, and the ratio of the income of industry j in t to the income of the previous period is expressed by :
Assuming that there is a threshold of , represents the impact intensity. When the ratio of the income supply of an industry to the initial situation is lower than the threshold, the industry is determined to be suspended, and the demand and income of the industry are reduced to o:
Due to the decline in demand for production materials, the demand for other industries in the next phase:
At the same time, in order to simulate the operation of the economy under the impact of emergencies, the capacity utilization index E is constructed to quantify the impact of each emergency on the impact of the overall economy:
Where represents the total of intermediate products in period t, and represents the total of intermediate products in the initial case.
VI. EMPIRICAL ANALYSIS
4.1 Input-Output Network Model
As the digital economy plays an important role in promoting the economic development of a country. Referring to Statistical Classification of Digital Economy and Its Core Industries (2021) and Chen et.al.(2023)[8]. The digital economy industry is classified and other industries are split and merged. The collated input-output table includes the following industrial sectors: (1) digital product manufacturing industry (DPM, corresponding to 39 categories in the input-output table, abbreviated as 39), (2) digital product service industry (DPS, 63-65), (3) digital media industry (DM, 86-87), (4) digital trading industry (DT,51-52,60,66-68,75), (5) agricultural services and products (AGR, 01-05), (6) Fossil fuel mining (FOS,06-07), (7) metal, non-metal and other mining (MET, 08-11), (8) food and tobacco (FT,13-16), (9) textile industry (TEX,17-19), (10) wood processing products and furniture (WOD,20-21), (11) paper, printing and cultural education sporting goods(PE,22-24), (12) petroleum, coking products and nuclear fuel processing products (PET,25), (13) chemical products (CHE,26-28), (14) non-metallic mineral products (NMET,29-30), (15) metalwork (MW,31-33), (16)general equipment (GE,34), (17) special equipment (SE,35), (18) transportation equipment (TE,36-37), (19) electrical machinery and equipment (ELE,38), (20) instrument and meter (INS,40), (21) other manufacturing goods (OMG,41-43), (22) production and supply of electricity, heat, gas and water (EHGW,44-46), (23) architecture (ARC,47-50), (24) transportation (TRA,53-59), (25) accommodation and catering (AC,61-62), (26) real estate (RE,70), (27) rental and business services (BSR,71-72), (28) scientific research and technical services (ST,73-74), (29) water conservancy, environment and public utilities management (WEU,76-78), (30) residential services, repairs and other services (RRO,80-81), (31) education (EDU,83), (32) health and social work (HW,84-85), (33) culture, sports and recreation(CSR,88-90), (34) public administration, social security and social organization (PSO,91 and 94).
Based on merge and accounting of 34 sector input-output table, the direct consumption coefficients are calculated. And then the Dijkstra algorithm is applied into the strongest input-output path matrix coefficient. The matrix describes 1122 even edge industry strongest output path, each even edge represents the intermediate products can realize the maximum value input and form a complex industrial network as shown in Figure 1.
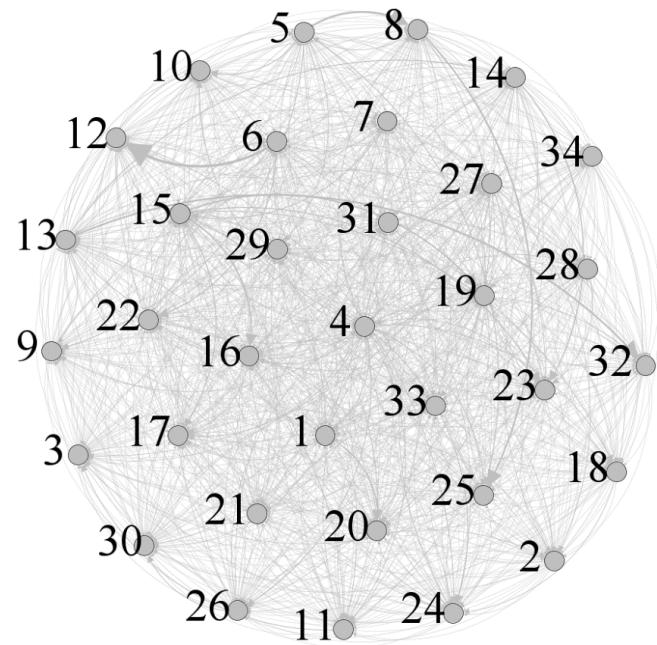 Figure 1: Industrial Strongest Path Network
Table1 shows the industrial betweenness, SP betweenness, downstream closeness and upstream closeness in China's input-output network. As for the industrial betweenness, DT includes the financial industry, which plays the role of resource allocation in the economy.
Therefore, this industry also possesses a very high betweenness in the network. DPM is not an important intermediary industry in China's economy. The digital infrastructure products produced by this industry are less invested in other industries. DPS and DM do not act as intermediary industries in the strongest path network. For SP betweenness, the path ranking of DT is high, indicating that it is in a relatively core position and the path mediation measurement value of other digital economy industries is low.
For the upstream and downstream tightness, the upstream and downstream tightness of the DT ranks second and first respectively and the upstream tightness measurement value is higher than that of the downstream tightness, indicating that the influence of DT on the downstream industry is stronger than that of the upstream industry. The upstream and downstream tightness measurement values of DPM, DPS and DM are all lower than the average level. In terms of the contribution degree and status to the economy, DT is significantly higher than that of these three industries.
Table 1: Industrial Betweenness, SP Betweenness, Downstream Closeness and Upstream Closeness in the Input-Output Network
| Industrial Abbreviation | Industrial Betweenness | Upstream Closeness | Downstream Closeness | SP | SP Betweenness |
| DPM | 354 | 1140 | 929 | RE→DT | 354 |
| DPS | 0 | 1012 | 954 | DT→ARC | 0 |
| DM | 0 | 91 | 31 | RBS→DT | 0 |
| DT | 10351 | 2635 | 5550 | DT→DPM | 10351 |
| RBS→DPS | 354 |
4.2 Industrial Network Risk Transmission Analysis
4.2.1 Simulation Scenario Setting
According to different types of emergencies, different emergencies are simulated to impact specific industries so as to study the risk transmission direction and time of the overall economic network paralysis, and find the first industry which stops production under different emergency scenarios. The following four kinds of emergency impact scenarios are mainly considered. Scenario 1: The supply shock of DPM is analyzed, and the supply shock of the first period is set as 50%, and the supply of the production means of the industry to other industries is reduced by half, and the impact of the decline in the supply of DPM on other industries is simulated. Scenario 2: It is assumed that the product supply of PET to other industries is reduced by 50%, that is, the industry is affected by the supply shock, and the intermediate use value of the industry is reduced by half. Scenario
3: Set the supply shock coefficient of DT to 50%. Scenario 4: The demand shock coefficient of RE is set at 50%, that is, RE is affected by the demand, and the intermediate input-output value of RE is reduced by half. When studying the cascade effect transmission mode of industrial network risk, the industrial shutdown threshold under all emergency scenarios is set at 0.3. In order to measure the systemic risk state of the industrial network affected by unexpected events, the industrial risk transmission is represented by E in the figure.
4.2.2 Industrial Risk Transmission Scenario Analysis
On the basis of the above-mentioned scenario setting and parameter design, the network cascade failure model is programmed to simulate the industrial risk transmission under the impact of emergencies, and the changes of economic production operation after the impact of various industries are drawn in Figure2 to Figure 5.
{"image_source":{"path":"images/f9adc3fd8c31d861bf0c86426acaa43639182985040b8442be16fbd37ba0f1a8.jpg"},"content":"","chart_caption":[{"type":"text","content":"Figure 2: Changes of DPM After Supply Shocks"}],"chart_footnote":[]} {"image_source":{"path":"images/7b255fc9a05a5f95413b77d90e80e69539d2eb187cd63d657a7315f6489abe4a.jpg"},"content":"","chart_caption":[{"type":"text","content":"Figure 4: Changes of DT After Supply Shocks"}],"chart_footnote":[]}
As can be seen from figures, no industry stopped production immediately after the economy was hit by unexpected events, and the capacity utilization rate gradually declined. However, as time goes on, the capacity utilization rate has decreased significantly and some industries have begun to stop production, which indicates that the industrial risk transmission has a certain time lag. In the impact of scenario 1, the first industry stopped production in the phase, followed by the second industry in the phase, and began to stop production in succession after the phase. In scenario 2, the first industrial shutdown occurs in the phase, the second industrial shutdown occurs in the phase, and then a large number of industries begin to shut down until the capacity utilization rate drops to 0. In scenario 3, the whole economy stops in the phase alone. After the real estate industry demand shock, the capacity utilization rate declined slowly, and the industrial production stopped continuously in the period, and the capacity utilization rate fell off the cliff.
{"image_source":{"path":"images/e6aa974bfde08fe813c6c8a4967a1b04b9fbd0f88b2816b5c414960e84c59947.jpg"},"content":"","chart_caption":[{"type":"text","content":"Figure 3: Changes of PET After Supply Shocks"}],"chart_footnote":[]} {"image_source":{"path":"images/036fe9b42c7fbfa977616d7cf2ffb90e6857f10c489c96d30b670ce02ff26e0d.jpg"},"content":"","chart_caption":[{"type":"text","content":"Figure 5: Changes of RE After Demand Shock"}],"chart_footnote":[]}
4.2.3 Industrial Risk Transmission Path
It is observed that different industries stop production in different periods. If the stop production threshold is set as 0.3, the path of industrial risk transmission from the target industry to other industries can be obtained according to the stop production sequence of various industries under different situations, as shown in the following figures.
Figure 6: Industrial Risk Transmission Path of Digital Product Manufacturing Industry (DPM)
Figure 7: Risk Transmission Path of Petroleum, Coking Products and Nuclear Fuel Processing Products (PET)
Figure 8: Risk Transmission Path of Digital Trading Industry (DT)
Figure 9: Risk Transmission Path of Real Estate (RE) As shown in Figure 6, DPM was the first industry to stop production in the phase after the supply shock; After passing the risk to the INS, the industry stopped production in the phase, because electronic information manufacturing products are important intermediate inputs for INS, and the production of the downstream INS will be subject to the product supply of the upstream DPM; As time goes on, in the and phases, the risk will be passed on to the ST and other more industries such as the DPS; In the phase, the remaining FT,TEX,PET and MW ceased production.
As shown in Figure 7, PET will stop production in a short time after the supply shock, followed by EHWG begin to spread to other industries. It is easy to find that EHWG is the upstream material link with PET. China has a large demand for crude oil products, and when the external supply chain breaks, it will seriously affect the production of downstream oil products.
As shown in Figure 8, the supply impact of DT leads to a large number of industries to stop production in a short period of time, and RE is the first industry to be affected. Real estate development and construction needs a large amount of loans from banks, and the real estate construction cycle is long, so the capital chain of real estate enterprises will be broken due to the impact of the banking industry and stop production quickly.
As shown in Figure 9, the industrial risk transmission path under public health emergencies shows that the contraction of RE demand also slows down the development of real estate enterprises, and takes the lead in affecting the demand of the upstream ARC.
{"image_source":{"path":"images/5f1e6682c9ce5eeebe5750bbc34620bb04c4134f5f029312ddc6b1194199dbb6.jpg"},"content":"","chart_caption":[{"type":"text","content":"4.2.4 The Critical Period of Industrial Supply and Demand Shock"},{"type":"text","content":"Figure 10: The Critical Period of Industrial Supply and Demand Shock"}],"chart_footnote":[]} As shown in Figure10, it can be seen that the economy is very slow to respond to some industrial risks. For example, the risk of DM has a long process of impact on the economy from the perspective of demand and supply. The supply and demand impact of DPM and DPS has a certain degree of impact on the economy. The supply shock of PET has a significantly faster impact on the economy than the demand shock, because PET has a low demand for intermediate products of other industries and a high share of output value supplied to other industries.
V. CONCLUSIONS AND SUGGESTIONS
In sum, the strongest path analysis method is applied to study the structural characteristics of industrial network. The structural characteristics of industrial networks in digital economy are studied by calculating the SP betweenness and closeness of networks, and the cascade failure simulation model of industrial networks is established to analyze the risk transmission situation of specific industries under different emergency backgrounds. The conclusions are summarized as follows.
-
In the digital economy industry, DPM is not an important intermediary industry in China's economy. DT plays a stronger role of path mediation in the network, while the measurement value of path mediation in other digital economy industries is low. The closeness of the upstream and downstream of DT is significantly higher than that of the other three digital economy industries, and DM has very little driving effect on the macro economy. Compared with other digital economy industries, DT has a higher position in the industrial network, playing a more and more role and controls the flow of more resources.
-
The impact degree and risk transmission speed caused by different emergencies are different. Systemic financial risk is the most destructive and the fastest spread of risk, followed by sudden international political events and major public health events, and the industrial risk transmission speed caused by trade protection and technological blockade is relatively slow.
-
In the process of industrial network failure, when the impact of the emergency reduces the production capacity of various industries, the industrial risk transmission first goes through a moderate period, during which only a few industries may stop production. However, with the extension of transmission time, industrial risks continue to accumulate, and the number of industries stopping production will increase substantially in a certain period.
In the face of the combined impact of multiple emergencies, strong risk confrontation and macro-control should be carried out. The suggestions are stated as follows.
-
Further promote the development of DPM and DPS, help DT of the macro economy, and balance the output value structure of the digital economy industry. In addition, promoting the development of DPM and DPS will also help to accelerate the digital transformation of industries, avoid excessive concentration of single industrial risks, disperse potential industrial network risks, and help to improve the stability of industrial network.
-
Focus on the impact of sudden systemic financial risk events. The simulation results show that the economy is more likely to collapse under the impact of sudden systemic financial risk events, and the systemic financial risks are more destructive than other emergencies. We should reduce the probability of systemic financial risks and continue to promote financial deleveraging. Emphasis should be laid on establishing a mechanism and plan to deal with sudden systemic financial risks, while improving prevention, early warning and response plans for other possible emergencies, and strengthening the national system to tackle key core science and technology, so as to spread potential economic risks.
. Establish a sound risk prevention and mitigation mechanism for emergencies, and pay attention to the upstream and downstream industries where emergencies mainly impact industries because the industrial risks firstly hit the linked industries.
Conflict of Interest
The authors declare no conflict of interest.
Ethical Approval
Not applicable
Data Availability
The datasets used in this study are openly available at [repository link] and the source code is available on GitHub at [GitHub link].
Funding
This work did not receive any external funding.
References
Cite this article
Related Research



Special Issue
Launch a focused special issue to highlight research, emerging trends, and expert insights in your academic field.
