





IntelliPaper
Abstract
Purpose:To enhance the performance of the logistic regression by integrating step-wise procedures and henceforth compare and evaluate its performance with the Logistic regression and Naïve Bayes in classifying HIV viral load suppression (VLS).
Methods:Models for classifying VLS were built using Logistic regression, modified logistic regression and Naïve Bayes classifiers. Accuracy, balanced accuracy and the area under the receiver operating characteristics curve (AUC) were the key performance metrics used to evaluate the generalizability of the various classifiers.
Results:The modified logistic regression model trained on fewer predictor attributes achieved an accuracy of 84.9%, a balanced accuracy of 83.8% and an AUC of 92.6%. The traditional logistic regression model trained on a full set of predictor attributes achieved an accuracy of 84.9%, a balanced accuracy of 83.6% and an AUC of 92.5% whereas the naïve Bayes model achieved an accuracy of 81.6%, a balanced accuracy of 80.5% and AUC of 89.4%.
Conclusion:The modified logistic regression model outperformed the traditional logistic regression and naïve Bayes models on account of recording higher balanced accuracy and AUC values of 83.8% and 92.6% respectively albeit with fewer predictor attributes. Hence integrating step-wise regression procedures in the traditional logistic regression model can enhance its classification performance leading to better predictions.
Explore Digital Article Text
I. INTRODUCTION
Logistic regression and Naïve Bayes are among the most used data mining classification techniques [1]. This might be because they have algorithms that are easy to implement [2, 3], their ability to handle both continuous and discrete data [1], application of probability theory in their classification modelling [4] and they produce real-time predictions that can be easily interpreted [5].
The Logistic regression classifier assumes the absence of multicollinearity among the predictors while conducting classifications . However, the performance of the Logistic regression classifier is usually weakened by the presence of multicollinearity among the predictors which may lead to poor classifications . A study by Senaviratna & Cooray reported that the best solution is to understand the cause of multicollinearity and remove the highly correlated variables in the model. However, O'Brien , objected to removing the correlated variables from the model because less information would be available potentially leading to suboptimal model performance. Despite this weakness associated with the Logistic regression classifier, several scholars have independently employed the logistic regression classifier while undertaking classification tasks.
Scholars [13, 14] have recommended the use of the Bayesian approach premised on Bayes' theorem as an alternative to the Logistic regression classifier to overcome the problem of multicollinearity because its assumption of mutual independence among the predictors enables each distribution to be independently estimated. Several scholars [15, 16, 17] further stressed that the Naïve Bayes classifier has superior strengths such as being efficient, computationally fast, and does not require a lot of data for training to conduct classifications. Owing to its strength, the Naïve Bayes classifier has outperformed the Logistic Regression classifier in various fields [3, 18, 19] to provide accurate and reliable results. Asharaf et al., [20] recommended the need for more comparative studies of the different data mining techniques to determine their classification ability so that the most optimal model can be chosen. Above all, a number of approaches have been proposed to improve the goodness of fit of the traditional logistic regression classifier in order to overcome its multicollinearity bottlenecks [21, 22]. These include Principal Components Analysis (PCA) [23], Monte Carlo simulation [24] and Variance Inflation factor (VIF) [25], which drops predictors with high VIFs.
Motivated by the performance improvement of enhanced independent classifiers coupled with the fact that stepwise regression procedures are more likely to have lower false classification rates . This study proposes a modified logistic regression classifier which employs the VIF integrated with step-wise regression due to its simplicity .
1.1 HIV Viral Load Suppression as a Case Study
HIV viral load suppression (VLS) is the ultimate measure of treatment success for People Living with HIV/AIDS (PLHIV) receiving antiretroviral therapy (ART) [28]. This is in line with the third Sustainable Development Goal (SDG 3) premised on the commitment made by the United Nations (UN) member states to end the AIDS epidemic by 2030 by achieving VLS by 2025 [29, 30]. The consolidated guidelines on the use of ART drugs for treating and preventing HIV infection define all PLHIV receiving ART with HIV viral load (VL) less than 1000 copies/mL as having a suppressed VL [28]. According to the Annual Health Sector Report for the Financial Year 2021/2022, Zombo District achieved VLS of 71% [28]. This falls below the national VLS rate for Uganda of 82% [29] and also below the UNAIDS 95-95-95 target of at least 95% VLS by 2025. Despite several efforts to improve the treatment outcome of PLHIV receiving ART outcome through health education, infrastructural development, bridging the human resource gaps and strengthening the supply chains for essential commodities [31], so little is known about the key factors associated with VLS as well as the performance of various classifiers in determining these factors among PLHIV on ART in Zombo District.
1.2 Classifier Evaluation Metrics
Evaluating the performance of a classifier is paramount as it permits researchers to compare competing models as well as determine the degree to which its results can be generalized to an unseen sample or population from the same distribution from which the existing data were drawn . Several scholars attest that the confusion matrix; which provides a summary of classification outcomes, is the commonest way for evaluating classifier performances.
On the other hand, presenting a confusion matrix by itself in the absence of a suitable summary statistic or metric is insufficient and easily leads to biased interpretations of performance . The most utilized summary statistic emanating from the confusion matrices is accuracy, defined as the number of correct predictions across all classes . However, classification accuracy is a misleading performance metric particularly when the data are not perfectly balanced .
The balanced accuracy metric, defined as the arithmetic mean from both the minority and majority classes was suggested to address the above limitation ; thus providing more reliable performance evaluations for imbalanced data .
1.3 Problem Statement
Many scholars have independently employed logistic regression for classification problems. However, the performance of the Logistic regression classifier is usually weakened by multicollinearity among the predictors which may lead to poor classification results. Naïve Bayes has been suggested as an alternative classifier to overcoming multicollinearity as it assumes mutual independence among the predictors. To this end, limited research has been done to enhance the performance of the logistic regression as well as compare its performance with respect to the naive Bayes classifier.
In order to deal with the existing multicollinearity challenges of the traditional logistic regression classifier, this paper proposes a modified logistic regression classifier which employs a step-wise procedure based on VIFs and hence compare and evaluate its performance with the traditional logistic regression and naïve Bayes classifiers on a similar dataset to determine the most optimal classifier.
II. METHODS
2.1 Data Preprocessing
2.1.1 Data Sources
Data was extracted from Patient forms in one Hospital and nine health facilities of level three (HC IIIIs) in Zombo District that are accredited to offer antiretroviral therapy (ART) services for PLHIV who were newly initiated on ART between February 2020 to May 2022. This period conforms with the revised ART guidelines that specify the evaluation of VL for all newly identified PLHIV started on ART after six months of ART treatment . The extracted variables and their descriptions are indicated in Table 1.
Table 1: Description of Variables used in this Study
| Sn | Variable Name | Description | Variable Type | Categories |
| 1 | HIV Clinic No. | Unique Number is assigned to the HIV patient upon being enrolled on care at the ART clinic in a health facility | ||
| 2 | Age | Age of the HIV patient in completed years | Continuous | This was transformed into four (4) categories namely; 0 – 9 years, 10 – 19 years, 20 – 49 years, 50 years and above |
| 3 | Gender | Gender of the HIV patient | Categorical | M-Male, F-Female |
| 4 | Marital | Marital Status of the HIV patient | Categorical | Married, Never Married, Separated, Widow |
| 5 | Stage | HIV WHO Clinical Stage of the patient | Categorical | Stage 1, Stage 2, Stage 3, Stage 4 |
| 6 | regimen | ART regimen | Categorical | DTG-based regimen, LPV-based regimen, NPV-based regimen |
| 7 | freq | Daily ART dosage drugs | Categorical | Once per day, Twice per day |
| 8 | month_2 | HIV patient monthly clinical encounter at the second month | Categorical | Active, Missed Appointment |
| 9 | month_3 | HIV patient monthly clinical encounter at the third month | Categorical | Active, Missed Appointment, Lost to Follow up |
| 10 | month_4 | HIV patient monthly clinical encounter at fourth month | Categorical | Active, Missed Appointment, Lost to Follow up |
| 11 | month_5 | HIV patient monthly clinical encounter at the fifth month | Categorical | Active, Missed Appointment, Lost to Follow up |
| 12 | month_6 | HIV patient monthly clinical encounter at the sixth month | Categorical | Active, Missed Appointment, Lost to Follow up |
| 13 | adherence | Adherence to taking ART drugs by the HIV patient during the sixth months period on care | Categorical | Fair, Good, Poor |
| 14 | Disclosure | Disclosure of HIV status by the client | Categorical | Yes, No |
| 15 | VLS | HIV Viral Load Suppression outcome after 6 months of being on HIV care. | Categorical /Binary variable | 0=Suppressed, 1=Non-Suppressed |
A total of 1,757 records were extracted, each denoting a newly identified PLHIV started on ART after six months of ART treatment.
2.1.2 Data Cleaning
The researchers examined the data set for missing values, outliers, and addressed discrepancies and observations with missing values were excluded [44].
2.1.3 Data Transformation
Given that the dataset contained both continuous and categorical variables, data discretization was used to create homogenous groups of continuous predictor variables, reducing outliers and minimizing noise formation [45].
2.1.4 Training and Validation Datasets
The researchers split the dataset into training and testing datasets. 70% of the dataset was assigned to the training group for the development of the classifiers. The rest of the dataset (30% of the total cases) was assigned to the validation groups for the assessment of model performance [46].
Analysis
The following classifiers were employed;
Naïve Bayes: It utilizes the Bayes theorem [47] to compute the posterior probability of dependent variable given predictor variables the following equation (1).
Where the probability of to be observed
the probability of to be observed
the posterior probability of class (Z) given predictor (y).
the probability of observing y given Z holds
Since the naïve Bayes assumption is that predictors are conditionally independent of the response variable Z, the posterior probabilities and are computed for a new sample by dropping the denominator in equation (1) as illustrated in equation (2).
Where x is the class of the response variable with the highest probability given a set of variables. Logistic regression: It uses numerical and or categorical predictors to estimate the likelihood of a dichotomous response variable . The logistic regression model can be expressed as;
Where Y denotes the response variable
denotes the predictor variables
denotes the coefficients of the predictor variables
denotes the intercept
The probability of is represented by equation (4)
2.1.5 Proposed Modified Logistic Regression
The researchers integrated the backward stepwise regression process into the traditional logistic regression indicated in equation (iii) in order to determine the importance of each predictor variable .
The researchers commenced with a full classifier and kept removing predictor attributes with the least significant values (highest P-values>0.05; variables that worsen the model highest), to the trained model, one at a time. For every removal, the trained modified logistic classifier was fit/generalized onto test data until the stopping
Where in the context of this study, the entries in the confusion matrix were defined as.
-
True positive (TP): is the number of actual "NO" VLS cases classified as "NO".
-
False Negative (FN): is the number of actual "NO" VLS cases classified as "YES".
2. False-positive (FP): is the number of actual "YES" VLS cases classified as "NO"
- True Negative (TN): is the number of actual "YES" VLS cases classified as "YES".
(4)
Software
(7)
The data processing and analysis were carried out in R, version 4.1.2 [50], using the R packages criteria were met. The criteria to terminate was achieving balanced accuracy metrics similar to or higher than those returned by the traditional logistic regression classifier. The above process was repeated until only variables that generated a parsimonious model were retained in the classifier
2.1.6 Goodness of fit
(6)
The 10-fold cross-validation method was employed to validate the accuracy, sensitivity, specificity and balanced accuracy of the classifiers [33] as indicated the equations (5) (6), (7) and (8);
(5)
(8) "dplyr" version 1.0.7 [51], "caret" version 6.0-90 [52], "pROC" version 1.18.0 [53] and "ROCR" version 1.0-11 [54].
III. RESULTS
In this section, the researchers first present the results from each classifier and then present the comparison results.
3.1 Key Variables for Classification of VLS
Results revealed that fourteen (14) out of 25 variables were key for classifying VLS, namely; "never married", "HIV WHO clinical stage 3",
"HIV WHO clinical stage 4", "daily ART dosage twice", "month 3 lost to follow up", "month 4 lost to follow up", "month 4 missed appointment", "month 5 lost to follow up", "month 5 missed appointment", "month 6 lost to follow up", "good ART drug adherence", "poor ART drug adherence" and "disclosure of HIV status by the patient".
Table 2: Key Variables for Classification of VLS for the Logistic vs Modified Logistic Regression Models
| Model | Accuracy(%) |
| Traditional Logistic regression model with all variables (25) | 84.9 |
| Modified Logistic regression model with fewer variables (14) | 84.9 |
Table 2 reveals that when the modified logistic regression is trained on the dataset, the number of predictor variables is reduced from 25 to 14. This implies that the modified logistic regression model was able to achieve the accuracy of the traditional logistic regression trained on a full set of variables at the expense of some irrelevant or correlated variables. Hence the resultant variable subset using the modified logistic regression is the most significant set of variables that improves the predictive accuracy of VLS and thus a more robust model for determining VLS.
3.2 Comparison of the Classifiers Performance
The performance of the classifiers was evaluated based on their capacity to classify the instances of the data set into "YES" and "NO" VLS. The researchers utilized 10-fold cross-validation to assess the performance of the three classifiers on previously unlearned data. Computation of the performance metrics indicated in equations 8-11 revealed the results indicated in Fig. 1.
{"image_source":{"path":"images/a0ab7d1298029c639b4576757b978143a4fa9062f341d4ad255bfe99e47aa22d.jpg"},"content":"","chart_caption":[],"chart_footnote":[]}
Fig. 1: Comparison of Classifiers' Performance Using 10 Fold Cross-Validation
According to Fig. 1, the modified logistic regression model attained the highest performance with respect to the accuracy, sensitivity, and balance accuracy metrics recorded at 84.8%, 80.1%, and 83.8% respectively. This implies that this model correctly classified 84.8% (accuracy) of PLHIV whose viral load was either suppressed or not suppressed. Additionally, this model also correctly classified 80.1% of PLHIV whose viral load was not-suppressed.
On the other hand, the naïve Bayes classifier registered the highest specificity at 90.8% compared to 88.3% registered by traditional logistic regression and 87.4% obtained by the modified logistic regression classifier. The achieved balanced accuracy results indicate that the proposed modified logistic regression model outperformed the traditional logistic regression and naïve Bayes classifiers by 0.2% and 10.3% respectively.
Comparatively, raw data in Table 1 revealed that the response variable (VLS) comprised uneven proportions of 36% suppressed VL and 64% suppressed VL and therefore the balanced accuracy metric was used as the overall evaluation which balances the precision and recall metrics across each response variable class [55].
3.2.1 Receiver Operating Characteristics (ROC) Curve
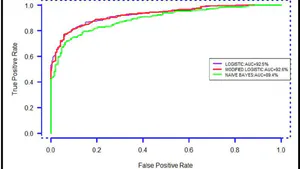
The ROC curve (Fig. 2) is a graphical illustration of the relationship between the performance of a classifier's sensitivity and specificity [42]. The ROC enabled the researcher to evaluate how well the developed models performed at different thresholds. Fig. 2 shows that the Modified logistic regression, traditional logistic regression and naive Bayes classifiers' corresponding Area under the Curve (AUC) values were , and . A random model would simply divide the graph in half, giving it an AUC of . For this reason, the classifiers' produced ROC curves supersede a random model, showing that the applied models provide a good measure of separability.
The purple line, which denotes the modified logistic regression, generated a superior cut-off decision level than the other two classifiers since it maximised the true positive rate at the lowest level of false positives (1-specificity).
{"image_source":{"path":"images/19c24c311b24d3424e5c86006e342ce99ccb5ff557caad335fa0a48c52e08892.jpg"},"content":"","chart_caption":[{"type":"text","content":"Fig. 2: Comparison of the ROCs for the Classifiers at Various Thresholds"}],"chart_footnote":[]}
IV. DISCUSSION
The purpose of this study was two fold. Firstly, to enhance the performance of the traditional logistic regression classifier and secondly, to compare and evaluate the performance of the traditional logistic regression, modified logistic regression and Naive Bayes models in classifying VLS. The findings showed that the modified logistic regression classifier slightly outperformed the traditional logistic regression and naïve Bayes classifiers with regards to accuracy, sensitivity and balanced accuracy whereas the naïve Bayes performed best in terms of specificity.
The proposed modified logistic regression classifier inherits properties of the backward stepwise regression algorithm. This implies that integrating the step wise regression procedures into traditional data mining classifiers can enhance their classification performance as evidenced by the better performance of the modified logistic regression classifier when fitted on previously unknown data samples. This phenomenon is in agreement with those of previous studies that reveal that the performance of the traditional data mining classifiers can be improved by integrating it with other machine learning techniques. In terms of key determinants of VLS, our findings were consistent with those of .
Conversely, the study faced a key challenge of available data being limited to data whose variables were regularly gathered from patients and caretakers and recorded in the patient medical records systems for the period under investigation hence the researchers were unable to subject the developed modified model to a higher dimensional dataset in terms of variables and observations from a known population which would return more reliable and robust performance results .
V. CONCLUSION
In this study, a modified logistic regression classifier is proposed to further enhance the classification performance of the traditional logistic regression classifier. Furthermore, performance comparisons were made between the modified logistic regression, traditional logistic regression and naïve Bayes classifiers. We found that the modified logistic regression performed slightly better than the traditional logistic regression and naïve Bayes classifiers on account of recording higher balanced accuracy and AUC values of 83.8% and 92.6% respectively albeit with fewer predictor attributes. We attribute this to the fact that the modified logistic regression adapts a step-wise regression procedure which uses a linear combination of the best variables to form a robust classifier, unlike the traditional logistic regression and naïve Bayes. Hence integrating step-wise regression procedures in the traditional logistic regression model can enhance its classification performance leading to better predictions.
ACKNOWLEDGEMENTS
The authors appreciate the efforts of the anonymous reviewers who contributed to improving this research. The financial support from Zombo district Local Government is also deeply appreciated.
Statements and Declarations
Funding: The authors declare that no funds, grants, or other support were received during the preparation of this manuscript.
Conflicts of interest/Competing interests: The authors declare that they have no conflict of interest
Availability of data and material: The data was sourced from the Patient forms in one Hospital and nine health facilities of level three (HC IIIs) in Zombo District, Uganda and it has been availed/uploaded as supplementary material.
Code availability: The program scripts/code can be availed by the corresponding author upon request
Authors' contributions: JS was involved in drafting the proposal, data collection, data preprocessing, data analysis, model designing and writing the manuscript. FFB was also involved in data analysis, model designing and writing the manuscript. DC and FB were supervisors of the work. All authors read and approved the final manuscript.
Ethical considerations: The data were accessed with official permission from Zombo District Health Office and personal identification data was de-identified and treated with the utmost confidentiality.
Research involving human participants: Not applicable. No experiment was performed on animal or human subjects.
Conflict of Interest
The authors declare no conflict of interest.
Ethical Approval
Not applicable
Data Availability
The datasets used in this study are openly available at [repository link] and the source code is available on GitHub at [GitHub link].
Funding
This work did not receive any external funding.
References
Cite this article
Related Research




Special Issue
Launch a focused special issue to highlight research, emerging trends, and expert insights in your academic field.
