




IntelliPaper
Abstract
Data structures are crucial aspects of Computer Science, but grasping their abstract nature poses challenges for students and software developers. A visualization tool for data structures such as arrays, stacks, and trees would effectively simplify the complex nature of data structures and algorithms. This research utilized an object-oriented approach to create a real-time Visualization Tool for Data Structures. This tool offers visual representations of fundamental data structures such as arrays and trees. The visualization tool is web-based and developed with HTML, CSS, and JavaScript technologies. The tool's efficacy underwent evaluation using complexity metrics. Results notably demonstrate that as the volume of data increases, the complexity of data structures follows suit. Consequently, this paper serves as an informative resource concerning the selection of data types and their respective implementation styles within data structures. Such insights furnish developers with valuable knowledge regarding the efficiency of diverse data types in software development, empowering informed decisions when choosing between data types based on their impact on space complexities within data structures.
Explore Digital Article Text
I. INTRODUCTION
Data structures are basic concepts in computer science and play a vital role in developing efficient software applications. Computer Science students must understand these concepts to create optimal and dynamic applications. Research has indicated that students have significant challenges when attempting to use abstract programming concepts such as data structures. They also lack the skills required to function in an abstractive manner and to understand the fundamental components of the concept and their relationships . Data structure is a manner to storing, organizing, and managing data to ease access and alteration of data. There is a range of data structures used in software applications (array, stack, tree, etc). Nevertheless, the unproductive use of data structure and its corresponding operations (such as adding, and deleting elements) generates memory issues that affect systems' performance. For this reason, data structure analysis is a prevalent task during software development . Illustrating the correlation between computing and the real world holds the promise of amplifying students' drive and fascination toward the field of computing . To boost the students' understanding in computer science education, and educational technologies are often used to assist students to understand data structures. These technologies ultimately rely on automated visualization as their main feature; a specific topic is explained through intuitive visuals and animation . This approach helps the development of problem solving skills, such as computational thinking, which are crucial in the field of software development.
Visualizing data structures offers productivity and effectiveness in understanding the underlying abstraction. A survey conducted by detected that 30.46% of visualizations, support developers in inspecting, and analyzing data structures. Again, studies done by have shown that by applying visualization tools, students' understanding is improved, and there is increase in their motivation and interest in learning data structures. The data structures' tools realistically and dynamically show the behavior of data structures and the state changes of their core components during program execution. These visualizations focused on abstracting the algorithm's data structures and operations, thereby presenting the user with a graphical representation of these abstractions [7]. The primary aim is to assist learners in comprehending the intricacies of implementing data structures, enabling them to create various mental models, establish connections between structures, and develop generalized problem-solving approaches [1,7]. The efficacy of visualization system is determined by measuring the pedagogical value [8].
According to [8, 9], an effective data structures and algorithm visualization systems ought to adhere to multiple guidelines, encompassing accessibility on platforms targeting global audiences, the utilization of a unified user interface to efficiently support diverse animations, and notably, the integration of input features within these visualization systems is deemed crucial for expediting comprehension of the underlying abstraction of the subject. Also, one of the effective features of an efficient visualization system is to provide a robust data set that accommodates all the cases to help students comprehend an unacquainted algorithm [7]. In recent years, the proliferation of HTML5 technology and its subsequent enhancement of high-quality browser-based graphics capabilities have spurred the creation of fully web-based data structure visualization tools, executable across diverse platforms and devices. Researchers have begun integrating various innovations into their visualization tools, such as color, smooth transitions between states, animations, and the integration of input features. However, despite the abundance of available tools, many of them lack a scalable input method and an intuitive user interface. Presently, they only support a single-element input method with a predetermined input size, which impedes the efficient representation of data structures. As data volumes increase, complexities escalate, underscoring the need for a novel approach to simplify data structures.
According to [7], involving students in constructing, customizing, manipulating, and directing various aspects of visualization, while enabling user input, fosters active engagement and enhances understanding. Consequently, we opined that incorporating a Hybrid Input method (supporting both file upload and single-element input) with customizable input sizes into the design of a data structure visualization tool will significantly enhance learner engagement and improve learning outcomes. Based on this idea, we propose a visualization tool for data structures featuring a Hybridized input method. This tool empowers users to visualize data structures using scalable datasets and a hybrid input approach, effectively simplifying the complex underlying abstractions of data structures. The tool will offer visualizations for fundamental data structures like Arrays, Stacks, and Trees. These intuitive visual representations will incorporate Algorithm-Specific Controls, adapting algorithmic operations based on the type of data structure being visualized. For instance, operations like 'push' and 'pop' in a stack structure can be visualized through straightforward button interaction.
Data structure visualization has gained increasing attention in the field of computer science with numerous researchers contributing their insight and techniques in the development of data structures visualization tools . As web browsers and the internet became more prevalent, data structures visualizers also followed this trend. Various web-based data structures visualization systems have been developed over the years with HTML5 technology and high-quality browser-based graphics. Nevertheless, none of them have provided the necessary level of scalability and intuitiveness needed to explore data structures.
Vrachnos et al. [1] developed DAVE, an interactive algorithm visualization environment designed specifically for visualizing Array data structure. Their literature review revealed a significant gap in research focused on understanding students' mental models and programming challenges related to arrays, despite arrays being a fundamental component of introductory programming curricula. Their work primarily concentrated on assessing the functionality of the system and its potential in aiding students in developing proficient mental models for visualizing array data structure. They capitalized on modern web browser capabilities by incorporating web technologies and methodologies. The researchers found that using visualization tools significantly assisted 98% of Computer Science students in Greek upper schools in solving algorithmic problems related to array data structures. Buchanan et al. [10] presented CSTutor, a sketch based interface designed to aid students' understanding of data structures. The tool utilized the interface to allow users to visually represent data structures such as Linked Lists, BS Trees, Heaps, and AVL Trees. CSTutor allows users to edit the generated code, and any modifications in the code, then animate the corresponding data structure on canvas. This integration aims to bridge the gap between conceptual understanding, represented through diagrams, and the practical implementation of data structures.
One of the most widely used data structure visualization tools today is Data Structure Visualization (DSV). Galles developed an open-source web-based data structure visualization tool [11]. This tool aids students in comprehending intricate data structures through interactive animations and visualizations. It was developed using Java-script and HTML5, ensuring compatibility with a broad array of modern browsers. Šimoňák and Benej [12], developed a desktop application called Algomaster, specifically designed for learning and teaching Data Structures and Algorithms. They used.NET Framework platform and C# programming language for the development of a plugin-based data structure and algorithm visualization tool. In their technique, the researchers combine two panels (for a pseudo code and a visualization) as an effective way of explaining data structures and algorithms. To ensure the extensibility, application could be plugin-based.
Burlinson et al. [3], introduced the BRIDGES (Bridging Real-world Infrastructure Designed to Goal-align, Engage, and Stimulate) system, a software framework aimed at facilitating the creation of more captivating assignments within the introduction to data structures courses. This system offers APIs that empower users to construct data structures using the BRIDGES client classes in either Java or C++. Additionally, the system integrates a BRIDGES server that provides APIs, granting users access to real-world datasets for visualization purposes. The system's capabilities were utilized to visually represent data structures such as queues, linked lists, stacks, arrays, trees, and graphs, alongside the implementation of search algorithms. A notable aspect of BRIDGES is its feature enabling easy sharing of visualizations via web links. Kumari et al. [13], introduced Algoviz, a web-based interactive tool that utilizes modern-day JavaScript to visually represent the logic of different searching and sorting algorithms. The researchers discussed the contrasting outcomes regarding the efficacy of visualization methods when compared to traditional approaches. Their investigation focused on identifying the key features that contribute to an efficient algorithm visualization system, leading them to outline five essential characteristics for achieving this objective. Unlike most web-based visualization systems that rely on java applets, Algoviz is a fully web-based system, Algoviz focuses on dynamic visualizations for only array data structures with the implementation of sorting and searching algorithms.
II. METHODOLOGY
Our goal in this study is to create a scalable and efficient visualization tool for data structures in real time that will increase learning results and engage learners. To achieve this goal, we analyse the proposed system, incorporate Object Oriented approach in the design process of the system and evaluate the tool using space complexity metrics. The first step in our approach is to analyse our proposed system. The tool aims to visualize array, stack, and tree data structures. By facilitating the visualization of these fundamental data structures, the tool intends to offer users a more comprehensive understanding and flexibility in exploring diverse data inputs and their impact on space complexity. The technologies that were employed in the development of this tool are HTML5, CSS and JavaScript. Furthermore, the system operates entirely on the client side, ensuring there's no added strain from interactions with a server. The proposed system uses Direct visualization algorithm. Direct-visualization algorithms uses a user-defined transfer parameter to allocate color opacity and size to data . Direct visualization algorithms, are algorithms designed specifically to visualize data directly. They take data as input and produce the visualization as output, without an intervening step of data interpretation. Additionally, the proposed system uses Algorithm-Specific Controls to manipulate and control the visualization of data, this control delivered algorithm operation that changes depending on the type of algorithm being visualized. Fig. 1 illustrates the architecture of the system being proposed.
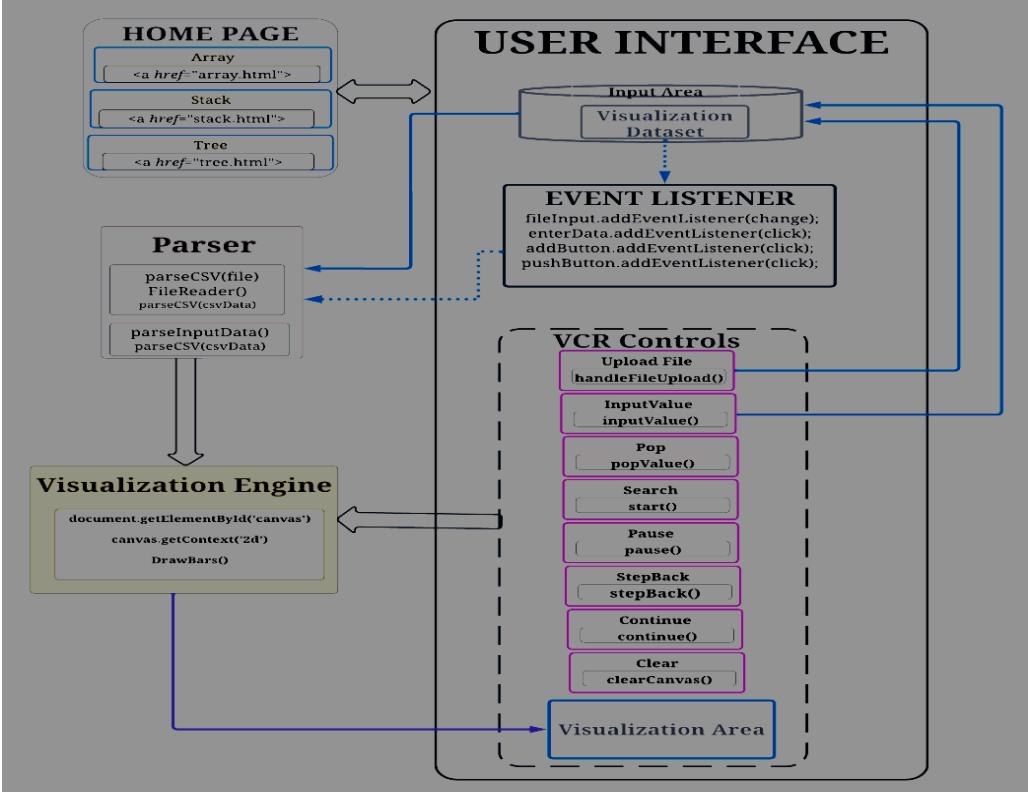 Fig. 1: Architecture of the proposed system
The proposed system's architecture represents the fundamental structure and design blueprint, offering an abstract overview of how its diverse elements collaborate. It delineates the system's constituents, their interconnections, interactions, and the guiding principles steering the system's design. The system comprises two primary components. Firstly, the Home Page functions as a hub for Visual components, showcasing array, stack, and tree data structures. These visuals are interactive, enabling users to navigate to specific interfaces, such as the array interface, through clickable array icon on the homepage. Secondly, the User Interface Components consist of the Data Input Area, Visualization Controls (VCR Controls), and Animation Area. The Input Area employs a Hybrid-Input technique, supporting file uploads (CSV) and single data entry. The Visualization Controls, actively interact with and manipulate the displayed data structures. These controls are embedded with functions like Push, Pop, Clear, Search, Pause, Continue, and
StepBack, facilitating user interaction and manipulation of the visualized data. The third component of the system is the Parser Module that handles the handleFileUpload(event) reads uploaded file content via FileReader API. Parses CSV data into structured arrays/stacks and trees, then transfers the formatted data to the visualization engine. The fourth component is Visualization Engine: which receives the formatted data from the parser and Uses CanvasRenderingContext2D API to renders data structures animations on the visualization area (canvas).
Having analysed the proposed system, we then proceed to design the proposed system using Object-Oriented Analysis and Design (OOAD). Unified Modelling Language (UML) is one of the standards widely accepted languages, generally used for modelling any system considered as objects for better analysis . This technique mainly focuses on the modelling of the exact procedure or near to the exact procedure within its application domain which may be modeled by using different object classes. The different types of UML diagrams used for OOAD and to model the proposed system include the Use Case Diagram, Sequence Diagram, and Class Diagram. Use Case Diagrams graphically models functionalities and the various ways the end user may interact with the target system. Fig.2 depicts the Use Case Diagram of the proposed system, by using various types of graphs, the structure illustrates the connections among the internal systems and also different external systems along with end users. In this system, the actors include the user (An individual interacting with the system, utilizing its functionalities) and the System Administrator (Responsible for managing system settings and configurations). The actions are depicted in circles while the dotted lines; '\<< extend>>' depicts the corresponding response of the system when a user loads data into the system. Additionally, '\<< include >>' depicts the methods within a specific action. The sequence diagram of the proposed system in fig. 3 depicts the sequence of interactions between the user, the proposed visualization system and the three data structures. Each vertical line represents a participant, and arrows indicate the flow of messages between them. It starts with user interaction triggering the system's response to visualize the selected data structure. The diagram depicts how the system processes user inputs, manipulates data structures, and updates visual representations accordingly. It highlights the synchronization between user actions, data manipulation, and the real-time reflection of changes in the visualizations, providing a clear overview of how the system handles interactions and updates during data structure visualization.
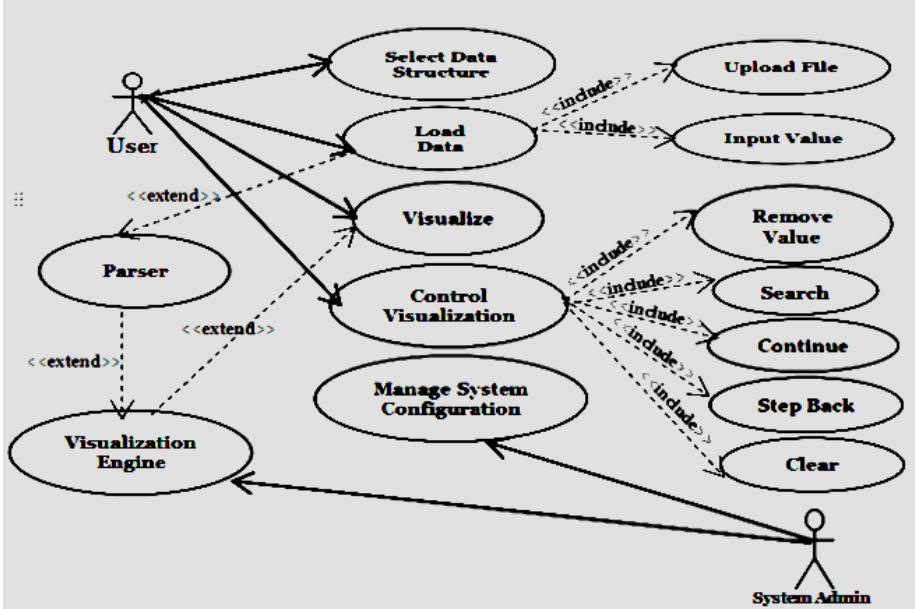
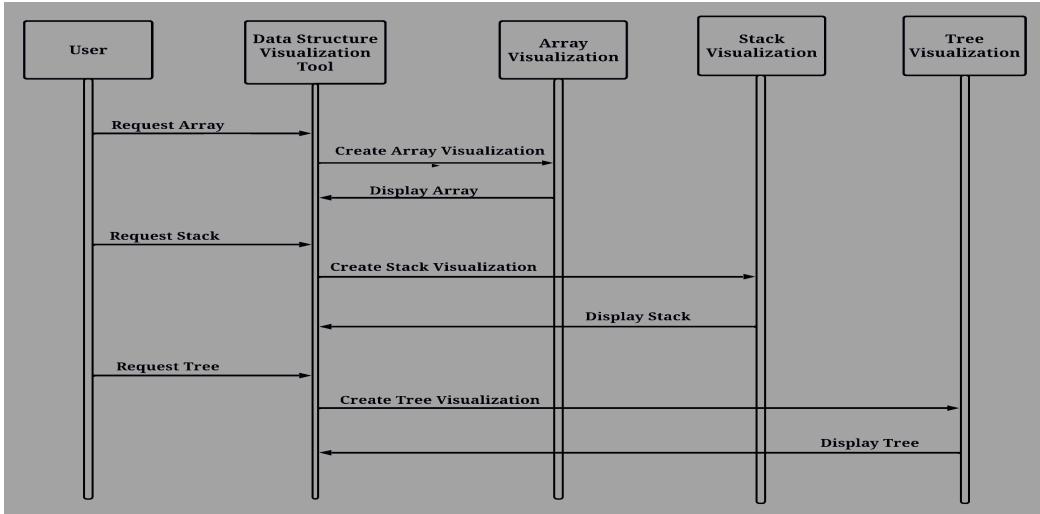 Fig. 2: Use Case Diagram of the Proposed System Fig. 3: Sequence Diagram of the Proposed System
Fig.4 depicts the rigid framework of our system built with classes. At the core of this diagram is the 'DataStructure Visualization' class, responsible for orchestrating the visualization process and managing interactions between various data structure classes. This class aggregates instances of 'ArrayDataStructure,' 'StackDataStructure,' and 'TreeDataStructure,' each dedicated to managing the visualization of arrays, stacks, and trees, respectively. The 'ArrayDataStructure,' 'StackDataStructure,' and 'TreeDataStructure,' classes inherit from 'DataStructure Visualization,' leveraging common visualization functionalities while focusing on rendering their specific data structures graphically. Furthermore, the 'Visualization Controls' classes handles user interactions with the visualizations, controlling functionalities such as play, pause, and step forward/backward. The 'Array Visualization Control,' 'Stack Visualization Control,' and 'Tree Visualization Control,' classes associate with the 'Array Visualization,' 'Stack Visualization,' and 'Tree Visualization,' enabling users to manipulate and interact with the visualized data structures seamlessly. These classes and their relationships form the backbone of the proposed system,
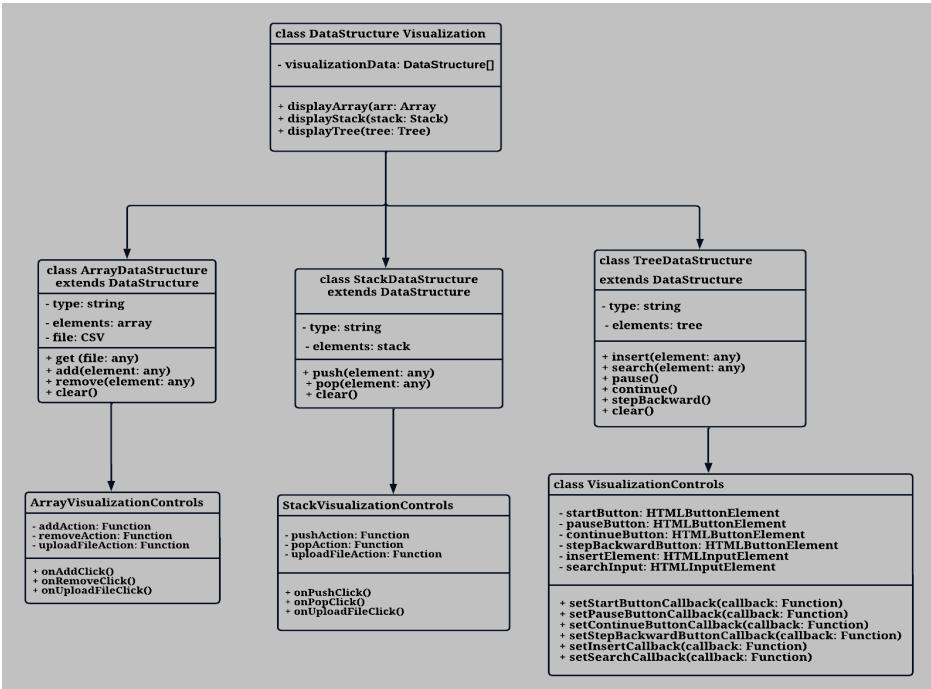 Fig. 4: Class Diagram of the Proposed System
III. RESULTS AND DISCUSSION
To construct the Data Structures Visualization tool, we employed HTML, CSS, and JavaScript. CSS and JavaScript play pivotal roles in designing an efficient user interface and creating visual representations, offering adaptability to the tool. This flexibility ensures platform independence, exemplified by the URL https://dsgrafix.netlify.app/ in Fig. 5. Within the visualization tool, we introduced the Hybrid-Input technique, presenting specific buttons such as "Add," "Push," and "Insert Value" for array, stack, and tree user interfaces respectively, as depicted in Figures 6, 7, and 8. These buttons enable users to practice randomized single-element data entry techniques. Additionally, we included a file upload input method, allowing users to upload CSV files containing large datasets for tailored practice sessions. Various colour gradients are utilized to aid learners in comprehending the fundamental steps and transitions within the data structures. User interaction is facilitated through different buttons like "push," "pop," "search," "pause," "continue," "stepback," and "clear." These buttons ensure smooth navigation through the visualization stages, accommodating users' specific requirements.
In the evaluation of the tool using space complexity metrics, we conducted a detailed experiment with our visualization tool. During the experiment, from the home page(https://dsgrafix.netlify.app/) in fig. 5, we navigated to the data structures interfaces using and for the array, stack and tree interfaces respectively. On the array interface we uploaded a CSV file containing 200 float elements using the file upload technique. For the stack and tree, we entered 50 and 22 integer elements respectively into the Data Area through the manual data single element entry technique.
The change event listener was activated by the file upload to handle the file input element's alteration. The event listener for change (fileInput.addEventListener('change', this.handleFileUpload.bind(this));) responds to the change event occurring in the file input element, initiating the execution of the handle File Upload (event) function. The `handleFileUpload(event) retrieves the uploaded file and reads its content using the FileReader API. The FileReader() called the parseCSV(file) function, which is a function responsible for parsing the contents of the selected file. The Parser Parsing CSV Data: Inside the onload callback function, received the content of the CSV file as a string in the csvData variable.
The content was assumed to contain data separated by newline characters (\n'). The parser then parsed this CSV data into a structured format of arrays, stacks and trees respectively. The parser then transferred the formatted data to the Visualization Engine. The Visualization Engine; draw(), then used the 2D context API to draw and render the formatted data on the Visualization Area (HTML canvas element).
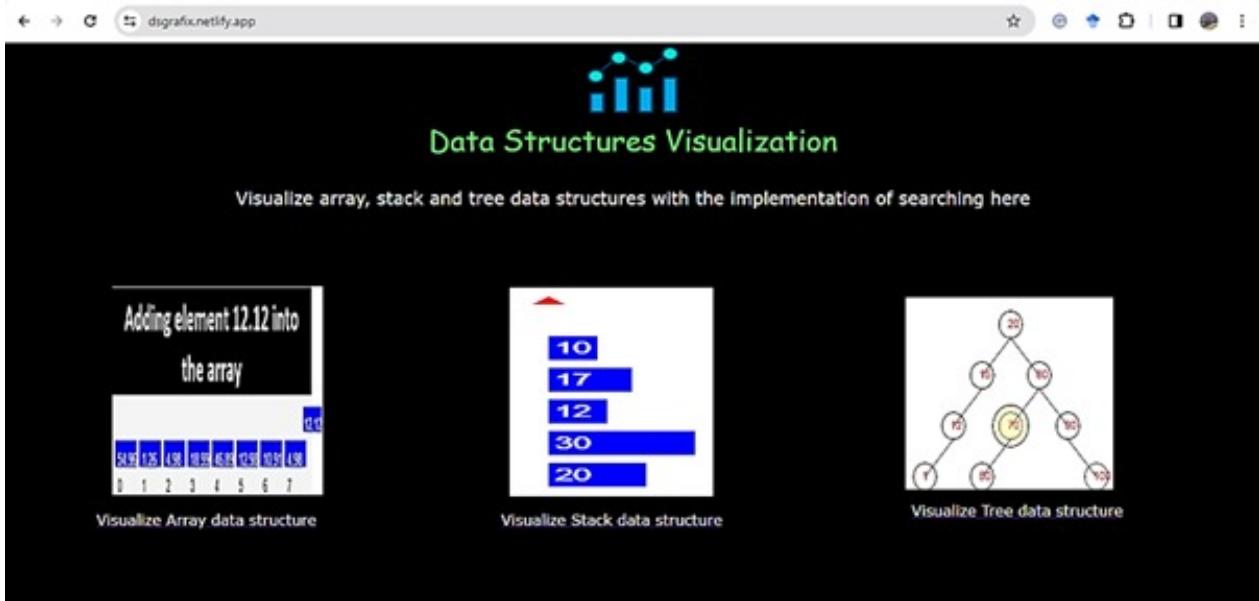 Fig. 5: Data Structures Visualization Home page
The graphical representation of the array data structure is depicted in Fig. 6, demonstrating array with a length of 200. The indices range from 0 to 199, serving as numerical identifiers. The initial index is 0, concluding at 199. The values within the square boxes denote the array elements. The array's first index, 0, holds the value 54.98, while the final index, 199, holds the value 3.08. However, index 200 remains empty as each array element possesses a distinct memory address, beginning with a zero index. The graphical representation in Fig. 7 demonstrates the stack structure, starting from element 45, which was the first input pushed into the stack as the base element, up to 378, the last input and the top element. The red pointer on top of the stacked elements indicates the top of the stack. The stack operates on a 'First In, Last Out' principle where the first element added to the stack is the last element to be removed from the stack. The 'push' adds an object to the stack, and 'pop' removes an object from the top of the stack.
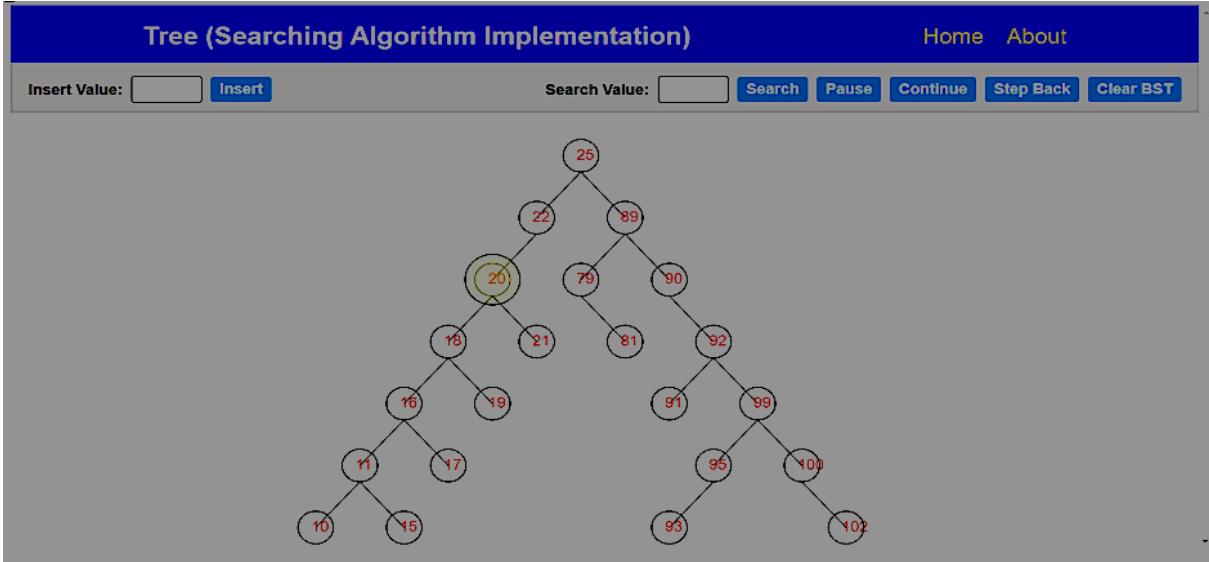
Fig. 8 illustrates the binary tree data structure, commencing with the insertion of 25 as the initial element, functioning as the root at level zero or the first index of the tree. Subsequently, elements 22 and 89 were added in sequence as the immediate nodes branching from element 25. Further additions represent subsequent nodes or children of elements 22 and 89, positioning them as grandchildren based on their arrangement as shown in the figure. In a tree structure, multiple sub-trees can be delineated. The terminal elements, such as 10, 15, 93, and 102, often termed as leaf nodes, serve as the endpoints without further branches. These leaf nodes are parented by elements 11, 85, and 100, forming the hierarchy within the tree. A search operation was performed to locate the element 20 within the tree data structure. The indication of a double circle on the element signifies that the search operation successfully found the element within the structure.
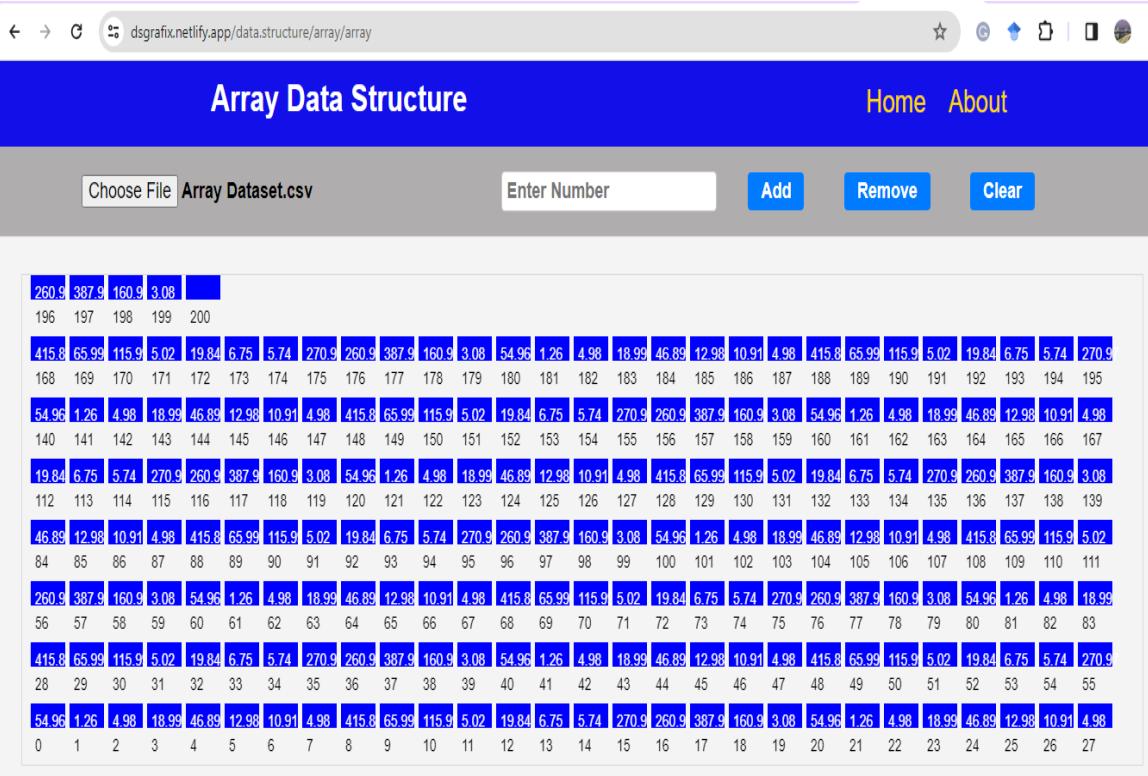 Fig. 6: Visualization of Array of Two Hundred Elements.
{"image_source":{"path":"images/08f11a642d46e81261f96a0dda3aafb02cbde00a3214a878746a42fc90008d7e.jpg"},"content":"","chart_caption":[{"type":"text","content":"Fig. 7: Visualization of Stack Data Structure with Fifty Elements."}],"chart_footnote":[]}
 Fig. 8: Visualization of Tree Data Structure with Twenty Two Elements.
Table 1 shows the space complexities of the visualized array, stack and tree data structures. For arrays, the space complexity O(n) is directly related to the total number of elements multiplied by the size of each element. Here, the array contains 200 elements, and the assumption is that each element takes up 4 bytes of memory. Hence, the total space required to store all 200 elements is 800 bytes. The space complexity for a stack often relies on the number of elements and the way elements are stored. Also noted with O(n) is the space complexity of the binary tree data structure. Fig. 9 shows that the complexity of data structures rises along with increase in the volume of data. The space complexity by memory consumption depends on the storage required by each value.
Table 1: Tests Results for the Data Structures Visualization.
| Data Structures | Elements Attributes | Space Complexity | ||
| Type | Type | Number | By Number | By size |
| Array | Float | 200 | O(200) | 800 bytes |
| Stack | Integer | 50 | O(50) | 200 bytes |
| Tree | Integer | 22 | O(22) | 88 bytes |
{"image_source":{"path":"images/511148003850a9a1fd49fb7000042e0431bf147960132e94e3d83386fa3d6b23.jpg"},"content":"","chart_caption":[{"type":"text","content":"Fig. 9: Effect of Data Size on Space Complexity"}],"chart_footnote":[]}
Conflict of Interest
The authors declare no conflict of interest.
Ethical Approval
Not applicable
Data Availability
The datasets used in this study are openly available at [repository link] and the source code is available on GitHub at [GitHub link].
Funding
This work did not receive any external funding.
References
Cite this article
Related Research



Special Issue
Launch a focused special issue to highlight research, emerging trends, and expert insights in your academic field.
