




IntelliPaper
Abstract
Sugarcane cultivation in many industries happen under diverse soil conditions, and soils are known to influence the productivity of sugarcane varieties. The purpose of this study was to assess the impact of soil types on the yields of different sugarcane varieties to inform variety selection strategies. Data (cane yield, TCH; sucrose yield, TSH; sucrose content) from three variety trials established on three different soil types (well draining, WDS; moderately draining, MDS; poorly draining, PDS), comprising eight varieties, and collected over six successive crops (plant cane and five ratoons) were used for this study. The data were subjected to a linear mixed model to assess the relative contribution of variance components to yield variability across ratoon crops. Linear and quadratic regressions were used to evaluate yield trends across ratoon crops. Soils significantly impacted ratoon crop yields, with the rate of yield decline (TCH and TSH) increasing with decrease in drainage abilities of the soils. Significant differences in varieties’ ratooning ability and soils’ effect thereof highlighted an opportunity to select varieties that are adopted to specific soil conditions, hence benefiting from genetic gains. Greater soil type impact than variety on variation in ratoon crops’ yield emphasized the need to adopt best management practices aimed at improving soil hydraulic characteristics than relying only on improved varieties.
Explore Digital Article Text
I. INTRODUCTION
Sugarcane [Saccharum sp.] is an important commercial crop predominantly grown in tropical and subtropical areas as a source of sugar. It supplies about 86% of the world's sugar and the remaining 14% is produced from sugar beet (OECD-FAO, 2019). Besides the production of sugar from the sugarcane stalk, there are other valuable by-products that are derived after the extraction of sucrose at the mills such as bagasse and molasses. Bagasse is the fibrous portion of sugarcane that remains after the removal of the juice, and in many industries, it is used to generate electricity for milling operations, estates and the excess may be exported to the national electricity grid. Molasses is the thick syrupy residue left after the abstraction of sucrose from the clarified sugar juice (syrup). It is utilized to produce alcohol and its by-product named vinasse (or condensed molasses soluble) is used as fertilizer for sugarcane fields.
The profitability of sugarcane (Saccharum sp.) production is largely dependent on the availability of varieties that are adaptable and high yielding across diverse growing conditions over several ratoon crops. The ability of a variety to sustain profitable yields over several ratoon crops is termed ratooning ability (RA) (Chapman et al., 1992; Ferraris et al., 1993; Milligan et al., 1996). RA is a desirable trait for improved economics in sugarcane production (Farrag et al., 2019), and in many sugarcane growing countries, high RA is a prerequisite for commercializing a variety. Past studies have reported significant differences in RA of sugarcane varieties (Ricaud and Arceneaux, 1986; Chapman et al., 1992; Ramburan et al., 2009; Zhou and Shoko, 2012; Masri and Amein, 2015; Chumphu et al., 2019), indicating that RA is genetically influenced. This therefore presents sugarcane breeders and agronomists with an opportunity to simultaneously select for both high yield and RA in sugarcane development programmes.
Ratoon yields in sugarcane production are affected by several factors including the variety grown (RA) and the soil type on which it grows. Apart from fertility, another essential characteristic of a soil that affects sugarcane yields is its hydraulic properties. This is consistent with findings of previous studies (Chapman et al., 1992; Henry and Ellis, 1996; Kingston, 2003; McGlinchey and Dell, 2010; Marin et al., 2019). However, these studies and others, have looked at the effect of soil on yields in isolation. Information on how different sugarcane varieties' ratoon yields are impacted by soil types is scanty. In many sugarcane industries, variety trials are run over three crops (i.e., plant crop and two ratoons) making it hard to appreciate how soils affect yields beyond the second ratoon crop.
The objective of this study was to: (i) assess the RA of released sugarcane varieties, (ii) determine the relative effect of soil types and varieties on sugarcane ratoon yields, and (iii) ascertain the impact of soil types on RA.
II. MATERIAL AND METHODS
2.1 Datasets
Data for this study were sourced from three sugarcane variety trials conducted by the Eswatini Sugar Association (ESA) at three sites namely Simunye, Big Bend and Mhlume representing well draining (WDS), moderately draining (MDS) and poorly draining (PDS) soils, respectively (Figure 1). Details of the soil classification are given in Table 1. Figures 2 and 3 show climatic data for these areas for the seven year period (2015-2021) of the study. During the period 2015 – 2016, the industry experienced a severe drought resulting in water rationing across all areas. In the year 2021, tropical cyclone Eloise provided above-normal rainfall in all three areas.
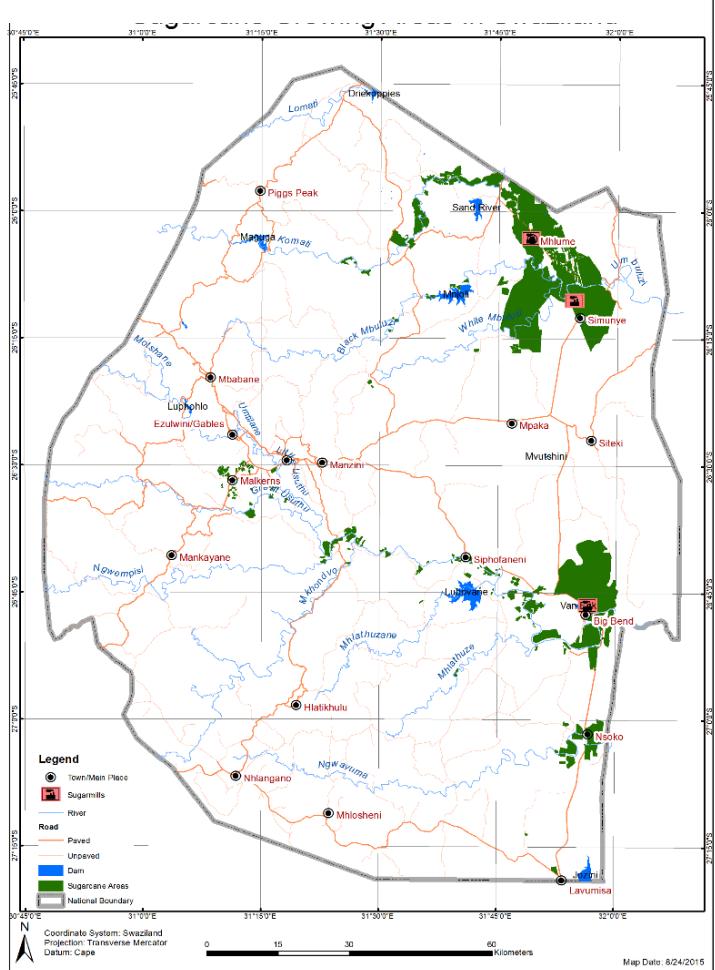 Figure 1: Map showing sugarcane growing areas and sugar mills of Eswatini.
The trials were planted in August 2015, and data were collected over six successive crops (plant crop plus five ratoon crops). All three trials were planted with eight varieties (i.e., N23, N25, N36, N41, N46, N49, N53 and N57) imported from the South African Sugarcane Research Institute (SASRI) (Table 2). The Simunye trial had plots with five rows each that were 10 meters long and 1.9 meters apart. The Big Bend trial plots had five rows each that were 12 meters long and 1.8 meters apart, and the Mhlume trial had four rows per plot that were 17 meters long with inter row spacing of 1.5 meters. All trials were established as randomized complete block design with six replications per site. The trials were managed as per estate standard practices including fertilizer applications, irrigation and weed control.
A day before cutting, the cane was burnt to remove extraneous matter as per industry practice. The cut cane was topped (i.e., removal of the topmost vegetative section of cane stalks) according to estate practice, which is below the natural breaking point, and placed in bundles. The weights of the bundles of cane from the net rows were measured using a digital scale mounted on a tractor-operated hydraulic boom. The cane yield per plot was then transformed to a per ha basis. After weighing, a total of 16 stalks per plot were randomly sampled from the bundled cane to determine cane quality parameters such as sucrose content (SUC,%), brix, purity, and fiber content at the laboratory using standard protocol explained by Shoonees-Muir et al. (2009). The secondary trait, tons sucrose per hectare (TSH), was calculated as a product of tons cane per hectare (TCH) and SUC.
2.2 Data analysis
Statistical analyses for this study were conducted using GenStat 23 Edition statistical software (VSN International, 2023). To establish the relative effect of variety and soil type on sugarcane ratooning for each trait, the data from the three trials were combined and the following linear mixed model was fitted:
Where, is observation for variety, in the soil type, replication nested within the soil type, in crop-year l; is the overall mean; is the effect of the soil type; is the random effect of the replication nested within the soil type; is the effect of the variety; is the interaction effect of the variety and soil type; is the random interaction effect of the variety and the replication nested within the soil type; is the effect of the crop-year; is the interaction effect of the crop-year with soil type; is the interaction effect of the crop-year and variety; is the random interaction effect of the crop-year and the replication nested within the soil type; is the interaction effect of the soil type, variety and crop-year; and is the residual term.
Table 1: Land classes and soil types in the Eswatini sugar industry (sourced from Nixon et al. 1986).
| Land Class | Sets/Series | Description | Soil type |
| I | R, N, L sets | Deep, red, well structuredMedium to heavy texturedFree draining | Well draining |
| II | W, B, F sets, Daputi series | Moderate to weak structureDeep, light texturedExcessively drainingMainly of alluvial origin | Well draining |
| III | S set | Shallow, well structuredMedium to heavy textureFreely draining | Well draining |
| IV | T, D sets (excluding Daputi series) | Moderate structureMedium to heavy textureImperfectly drainingModerately deep | Moderately draining |
| V | K, C, V sets | DeepBlocky or cracking claysModerate to poor drainage | Moderately draining |
| VI | Z set, Homestead series | Thin topsoil (often absent)Coarsely structured subsoilInherent salinity/sodicity problemsPoorly draining | Poorly draining |
| VII | E, O, P, J, G, H sets (excluding Homestead series) | Coarsely structured topsoilAbrupt change to heavy, poorly drained subsoilHigh salinity/sodicity risk | Poorly draining |
{"image_source":{"path":"images/b28d3632d4cc1f0f7bf52b37ad1866f33ebce22c5c5e79842af80915d7f5956a.jpg"},"content":"","chart_caption":[],"chart_footnote":[]} {"image_source":{"path":"images/49f6e2c9058abc8410768e0936c8f520640efb6ba5112748f9427a9355f8cf44.jpg"},"content":"","chart_caption":[],"chart_footnote":[]}
{"image_source":{"path":"images/14e0120c2becbc637e57e1a16b042504bd94df254728c93f63b1eb6f764a626f.jpg"},"content":"","chart_caption":[],"chart_footnote":[]} {"image_source":{"path":"images/9da927213479ba67f9d4e1101f42beec0d3830ce52cb7c22fabeb149d80b9ee9.jpg"},"content":"","chart_caption":[{"type":"text","content":"Figure 2: Average monthly solar radiation (A), maximum temperature (B) and minimum temperature (C) trends recorded during the study period (2015 – 2021) for the three trial areas (Mhlume, Simunye and Big Bend)"},{"type":"text","content":"Figure 3: Cumulative annual rainfall received in the three trial areas (Mhlume, Simunye and Big Bend) during the study period (2015 – 2021)"}],"chart_footnote":[]}
Table 2: Parentage, origin and year of release of the eight varieties used in this study. SASRI: South African Sugarcane Research Institute; : parent is unknown
| Variety | Parentage | Origin | Year of release |
| N23 | NC0376 x N52/219 | SASRI, South Africa | 1992 |
| N25 | C062175 x N14 | SASRI, South Africa | 1994 |
| N36 | 82F1225 x 78Z1635 | SASRI, South Africa | 2000 |
| N41 | 77F0790 x 82W1542 | SASRI, South Africa | 2002 |
| N46 | 97F2857 x Unknown* | SASRI, South Africa | 2007 |
| N49 | 87E1331 x N30 | SASRI, South Africa | 2008 |
| N53 | 89F1649 x 88F1903 | SASRI, South Africa | 2011 |
| N57 | N25 x Unknown* | SASRI, South Africa | 2013 |
Simple linear regression was conducted to estimate intercepts and slopes of the different yield traits across ratoon numbers:
where compare is the yield of variety i in ratoon crop m; is the intercept predicting plant cane yield of variety i; is the slope of yield of variety i; is ratoon crop number m; and is the random error.
To compare the variety trends across ratoon crops, quadratic curves were fitted for the different traits for each variety. The quadratic model was of the form:
where, Y is cane yield at ratoon crop x; A is the quadratic coefficient (it indicates whether the curve opens upward or downward. When positive, the curve is opening upward and when negative, the curve is opening downward. The absolute value of this coefficient also indicates whether the curve is narrow or wide); B is the linear coefficient (it indicates a slope of the curve which is a measure of ratooning ability); and, C is the intercept (the yield of the plant cane crop i.e., the first crop). The quadratic model was chosen because it gave a substantially better fit than the linear model. The results were presented in graphical form.
III. RESULTS
3.1 Yield traits' values
The summaries of the data of three traits are presented in Tables 3 to 5. The plant cane at the PDS had a larger mean TCH than the plant cane on WDS and MDS (Table 3). However, the rate of TCH decline across ratoon crops was larger in the PDS compared to the other two sites. The MDS had a larger TCH decline than WDS. The coefficient of variation (CV%) for TCH data ranged from 9.2% (plant cane) to 13.8% (third ratoon) indicating that the quality of data was acceptable. According to Gomes (2009), for field experiments, if CV% is below 10%, the data quality is considered very good; between 10% and 20%, the data quality is considered good; between 20% and 30%, it is said to be low; and above 30%, it is considered very low.
The MDS had significantly lower average SUC than the other sites for the plant cane, third and fifth ratoon crops (Table 4). There were no distinct patterns of SUC change across ratoon crops for the three sites indicating that this trait was stable across the test crops. The CV% for SUC data ranged from 3.7% (third ratoon) to 6.0% (plant cane) indicating a low variability in the data.
TSH trends across ratoon crops were similar to those of TCH, suggesting that TCH had a greater influence on TSH than SUC (Table 5). The PDS gave a larger TSH than WDS and MDS in the plant cane. However, from the second ratoon crop, TSH for the PDS was consistently below those of the other soil types. The CV% for TSH data ranged from 10.4% (plant cane) and 14.0% (third ratoon crop) indicating that the experimental data was good. The CV% for TCH and TSH were larger than those of SUC, indicating greater stability for SUC compared to TCH and TSH.
Table 3: Cane yield (tons cane per ha, TCH) trends for eight sugarcane varieties tested in three different sites across six crops (PC: plant crop; R1: first ratoon;...; R5: fifth ratoon)
| Site | Variety | PC | R1 | R2 | R3 | R4 | R5 | Mean |
| Simunye | N23 | 115.2 | 110.1 | 132.6 | 118.6 | 139.6 | 98.3 | 119.1 |
| N25 | 131.9 | 133.3 | 133.0 | 126.1 | 123.2 | 102.8 | 125.0 | |
| N36 | 117.7 | 122.7 | 124.7 | 113.5 | 116.3 | 109.1 | 117.3 | |
| N41 | 106.1 | 108.6 | 122.3 | 108.5 | 111.7 | 97.3 | 109.1 | |
| N46 | 107.9 | 117.8 | 133.9 | 115.3 | 129.9 | 121.2 | 121.0 | |
| N49 | 111.4 | 116.4 | 126.6 | 116.8 | 119.5 | 107.2 | 116.3 | |
| N53 | 125.5 | 126.4 | 140.3 | 115.0 | 127.0 | 118.4 | 125.4 | |
| N57 | 102.6 | 120.9 | 139.2 | 117.3 | 121.2 | 85.4 | 114.4 | |
| Mean | 114.8 | 119.5 | 131.6 | 116.4 | 123.5 | 105.0 | 118.5 | |
| Big Bend | N23 | 108.1 | 143.2 | 137.2 | 115.8 | 94.8 | 74.8 | 112.3 |
| N25 | 105.9 | 145.6 | 142.4 | 113.2 | 107.7 | 94.6 | 118.2 | |
| N36 | 100.7 | 128.5 | 124.2 | 112.3 | 98.8 | 83.7 | 108.0 | |
| N41 | 95.3 | 128.7 | 130.0 | 100.8 | 86.5 | 75.0 | 102.7 | |
| N46 | 92.6 | 136.5 | 138.2 | 113.7 | 121.7 | 118.9 | 120.3 | |
| N49 | 103.6 | 120.8 | 141.2 | 112.8 | 105.7 | 97.8 | 113.7 | |
| N53 | 109.4 | 139.4 | 136.7 | 111.4 | 112.2 | 103.7 | 118.8 | |
| N57 | 99.3 | 139.8 | 138.7 | 93.4 | 59.9 | 71.3 | 100.4 | |
| Mean | 101.9 | 135.3 | 136.1 | 109.2 | 98.4 | 90.0 | 111.8 | |
| Mhlume | N23 | 126.0 | 110.5 | 80.7 | 72.2 | 71.4 | 46.9 | 84.6 |
| N25 | 136.9 | 135.9 | 102.1 | 96.5 | 85.9 | 59.5 | 102.8 | |
| N36 | 133.9 | 124.0 | 89.2 | 85.6 | 79.8 | 66.8 | 96.5 | |
| N41 | 119.5 | 112.5 | 83.8 | 72.5 | 69.4 | 58.2 | 86.0 | |
| N46 | 134.9 | 123.9 | 89.2 | 96.4 | 90.8 | 81.4 | 102.8 | |
| N49 | 109.2 | 109.5 | 86.5 | 86.9 | 68.7 | 61.1 | 87.0 | |
| N53 | 130.0 | 110.2 | 79.8 | 74.2 | 64.5 | 49.8 | 84.7 | |
| N57 | 123.8 | 109.6 | 75.2 | 67.4 | 53.5 | 29.4 | 76.5 | |
| Mean | 126.8 | 117.0 | 85.8 | 81.4 | 73.0 | 56.6 | 90.1 | |
| LSD(5%) | 12.0 | 14.3 | 14.5 | 16.2 | 13.9 | 12.8 | 14.1 | |
| CV% | 9.2 | 10.1 | 10.8 | 13.8 | 12.4 | 13.3 | 11.7 |
3.2 Impact of site and variety on traits performance
Table 6 presents the fixed effects of the linear mixed model (equation 1) for the three traits. The main effects of soil, variety and crop were highly significant for all three traits suggesting large impact of soil type, variety and crop number on the yield traits. Soil x variety interaction was highly significant for the three traits indicating that varieties' performance on the traits was largely affected by soil type. The two way interactions of soil x crop and variety x crop were highly significant for all three traits implying that crop yields were greatly impacted by soil types and varieties. Significant variety x crop, suggest differences in ratooning abilities of the sugarcane varieties. The three-way interaction, soil x variety x crop, was also highly significant suggesting that soil type had a large effect on ratooning abilities of the varieties for the three traits.
Table 4: Sucrose content (%) trends for eight sugarcane varieties tested in three different sites across six crops (PC: plant crop; R1: first ratoon;...; R5: fifth ratoon)
| Site | Variety | PC | R1 | R2 | R3 | R4 | R5 | Mean |
| Simunye | N23 | 17.7 | 17.4 | 17.6 | 17.0 | 16.8 | 17.4 | 17.3 |
| N25 | 16.3 | 16.9 | 17.0 | 17.6 | 17.0 | 17.2 | 17.0 | |
| N36 | 18.8 | 19.6 | 18.9 | 18.2 | 18.8 | 18.9 | 18.9 | |
| N41 | 17.8 | 18.3 | 18.4 | 17.9 | 17.9 | 18.8 | 18.2 | |
| N46 | 18.4 | 17.6 | 17.1 | 17.7 | 18.1 | 17.7 | 17.7 | |
| N49 | 18.4 | 19.8 | 19.0 | 17.9 | 18.8 | 19.2 | 18.8 | |
| N53 | 18.6 | 18.8 | 18.7 | 18.0 | 17.8 | 18.8 | 18.4 | |
| N57 | 18.6 | 18.8 | 18.2 | 17.9 | 18.5 | 18.0 | 18.3 | |
| Mean | 18.1 | 18.4 | 18.1 | 17.8 | 18.0 | 18.2 | 18.1 | |
| Big Bend | N23 | 14.2 | 17.6 | 17.4 | 16.1 | 16.8 | 15.9 | 16.3 |
| N25 | 14.4 | 17.2 | 17.4 | 16.1 | 17.9 | 15.6 | 16.4 | |
| N36 | 15.9 | 19.5 | 19.2 | 17.5 | 18.7 | 18.1 | 18.2 | |
| N41 | 15.9 | 19.3 | 18.5 | 17.5 | 18.9 | 17.3 | 17.9 | |
| N46 | 15.5 | 18.2 | 18.5 | 16.8 | 17.5 | 16.7 | 17.2 | |
| N49 | 17.0 | 19.2 | 18.6 | 18.1 | 18.9 | 17.9 | 18.3 | |
| N53 | 16.0 | 18.0 | 17.7 | 16.9 | 18.6 | 17.1 | 17.4 | |
| N57 | 14.9 | 18.6 | 18.6 | 16.1 | 18.4 | 16.4 | 17.1 | |
| Mean | 15.5 | 18.4 | 18.2 | 16.9 | 18.2 | 16.9 | 17.4 | |
| Mhlume | N23 | 16.0 | 17.9 | 16.7 | 16.7 | 18.1 | 17.2 | 17.1 |
| N25 | 16.2 | 18.7 | 16.9 | 16.7 | 18.6 | 18.2 | 17.5 | |
| N36 | 18.2 | 19.1 | 18.0 | 18.2 | 19.1 | 17.5 | 18.4 | |
| N41 | 16.9 | 19.1 | 17.4 | 17.6 | 18.8 | 18.3 | 18.0 | |
| N46 | 17.9 | 18.4 | 16.7 | 16.7 | 18.2 | 17.6 | 17.6 | |
| N49 | 18.9 | 19.9 | 18.3 | 18.7 | 19.8 | 20.0 | 19.3 | |
| N53 | 18.6 | 19.7 | 18.1 | 18.4 | 19.4 | 19.4 | 18.9 | |
| N57 | 18.1 | 19.8 | 17.5 | 17.5 | 19.1 | 18.9 | 18.5 | |
| Mean | 17.6 | 19.1 | 17.4 | 17.6 | 18.9 | 18.4 | 18.2 | |
| LSD(5%) | 1.2 | 1.0 | 0.9 | 0.7 | 0.9 | 0.8 | 0.9 | |
| CV% | 6.0 | 4.8 | 4.4 | 3.7 | 4.1 | 4.0 | 4.6 |
The F-values for the main effects indicated that crop effect on the traits was larger than those of soil and variety. For TCH and TSH, soil had a larger effect than variety, while for SUC variety had a greater influence than soil. Among the four interactions, the F-values suggested that soil x crop had the largest influence on the traits' values. Variety x crop effect on TCH and TSH was greater than those of soil x variety and soil x variety x crop, insinuating that ratooning ability had a larger effect on these traits compared to the latter interactions.
Table 5: Sucrose yield (tons sucrose per ha, TSH) trends for eight sugarcane varieties tested in three different sites across six crops (PC: plant crop; R1: first ratoon;...; R5: fifth ratoon)
| Site | Variety | PC | R1 | R2 | R3 | R4 | R5 | Mean |
| Simunye | N23 | 20.3 | 19.1 | 23.3 | 20.2 | 23.4 | 17.1 | 20.6 |
| N25 | 21.5 | 22.5 | 22.6 | 22.1 | 20.9 | 17.6 | 21.2 | |
| N36 | 22.2 | 24.1 | 23.5 | 20.6 | 21.9 | 20.6 | 22.1 | |
| N41 | 18.9 | 19.9 | 22.5 | 19.4 | 20.0 | 18.3 | 19.8 | |
| N46 | 19.9 | 20.7 | 22.9 | 20.3 | 23.4 | 21.4 | 21.4 | |
| N49 | 20.6 | 23.0 | 24.0 | 20.9 | 22.5 | 20.6 | 21.9 | |
| N53 | 23.3 | 23.7 | 26.2 | 20.6 | 22.5 | 22.2 | 23.1 | |
| N57 | 19.1 | 22.7 | 25.3 | 21.0 | 22.4 | 15.4 | 21.0 | |
| Mean | 20.7 | 22.0 | 23.8 | 20.6 | 22.2 | 19.2 | 21.4 | |
| Big Bend | N23 | 15.3 | 25.2 | 23.9 | 18.6 | 15.8 | 11.9 | 18.4 |
| N25 | 15.3 | 25.0 | 24.7 | 18.2 | 19.3 | 14.7 | 19.6 | |
| N36 | 15.9 | 25.0 | 23.8 | 19.7 | 18.5 | 15.2 | 19.7 | |
| N41 | 15.1 | 24.8 | 24.0 | 17.6 | 16.3 | 12.9 | 18.5 | |
| N46 | 14.3 | 24.9 | 25.5 | 19.2 | 21.2 | 19.9 | 20.8 | |
| N49 | 17.6 | 23.2 | 26.3 | 20.4 | 20.0 | 17.6 | 20.8 | |
| N53 | 17.4 | 25.0 | 24.2 | 18.8 | 20.8 | 17.8 | 20.7 | |
| N57 | 14.8 | 25.9 | 25.7 | 15.0 | 11.0 | 11.7 | 17.3 | |
| Mean | 15.7 | 24.9 | 24.8 | 18.4 | 17.9 | 15.2 | 19.5 | |
| Mhlume | N23 | 20.2 | 19.8 | 13.5 | 12.1 | 12.9 | 8.0 | 14.4 |
| N25 | 22.3 | 25.4 | 17.2 | 16.1 | 15.9 | 10.9 | 18.0 | |
| N36 | 24.4 | 23.7 | 16.1 | 15.6 | 15.2 | 11.7 | 17.8 | |
| N41 | 20.1 | 21.5 | 14.6 | 12.7 | 13.0 | 10.7 | 15.4 | |
| N46 | 24.2 | 22.8 | 15.0 | 16.1 | 16.5 | 14.3 | 18.1 | |
| N49 | 20.7 | 21.8 | 15.8 | 16.3 | 13.6 | 12.2 | 16.7 | |
| N53 | 24.1 | 21.7 | 14.4 | 13.7 | 12.6 | 9.6 | 16.0 | |
| N57 | 22.3 | 21.7 | 13.1 | 11.8 | 10.2 | 5.5 | 14.1 | |
| Mean | 22.3 | 22.3 | 15.0 | 14.3 | 13.7 | 10.4 | 16.3 | |
| LSD(5%) | 2.3 | 2.8 | 2.7 | 2.9 | 2.6 | 2.4 | 2.6 | |
| CV% | 10.4 | 10.6 | 11.2 | 14.0 | 12.5 | 13.9 | 12.1 |
3.3 Regression analysis for TCH, SUC and TSHA
Since the fixed term of soil x variety x crop was significant for the three traits, regression analysis was conducted on a per soil type basis (equation 2). The purpose was to establish how these traits change over ratoon crops for the eight varieties as influenced by soil type. Intercepts represented the plant crop yield while the slopes represented the rate of yield change across ratoon crops. The slope is a measure of varieties' RA. The more negative the slope is, the higher the rate of yield decline and vice versa. Preferred varieties (or soils) are those with higher intercepts and a slope above zero (indicating an incline) or closer to zero (indicating low rate of decline).
Table 6: Fixed effects for three sugarcane yield traits - tons cane per ha (TCH), sucrose content (SUC,%) and tons sucrose per ha (TSH).
| TCH | SUC | TSH | |||||
| NDF:DDF | F stat | P-value | F stat | P-value | F stat | P-value | |
| Soil (S) | 2:15 | 73.77 | <0.001 | 30.67 | <0.001 | 73.28 | <0.001 |
| Variety (V) | 7:105 | 12.28 | <0.001 | 45.49 | <0.001 | 11.67 | <0.001 |
| Crop (C) | 5:75 | 146.98 | <0.001 | 54.08 | <0.001 | 170.03 | <0.001 |
| S x V | 14:105 | 2.50 | 0.006 | 2.99 | <0.001 | 2.36 | 0.008 |
| S x C | 10:75 | 58.26 | <0.001 | 23.25 | <0.001 | 71.63 | <0.001 |
| V x C | 35:525 | 7.19 | <0.001 | 2.04 | 0.002 | 6.02 | <0.001 |
| S x V x C | 70:525 | 2.43 | <0.001 | 1.50 | 0.002 | 2.31 | <0.001 |
| Mean | 106.80 | 17.87 | 19.07 | ||||
| CV% | 11.70 | 4.60 | 13.90 | ||||
The different soil types had different variety rankings on TCH intercepts (Table 7). For WDS and PDS, variety N25 had the highest intercept, while variety N23 had the highest for MDS. Variety N46 had the lowest intercept on WDS and MDS, and variety N49 was the lowest on PDS. For WDS, only two (N25 and N57) of the eight varieties had significant TCH slopes while only five varieties had significant slopes for MDS. For the PDS, all eight varieties had highly significant slopes. These results suggest larger TCH decline across ratoon crops for PDS compared to the other soil types. MDS had a larger TCH decline compared to WDS.
Similar to TCH, varieties were ranked differently on SUC for the three soil types (Table 8). On WDS, variety N36 had the highest SUC intercept while variety N25 had the lowest. On MDS and PDS, variety N49 had the largest intercept while N23 had the least intercept. SUC slopes for all varieties on WDS and MDS were not significant suggesting absence of ratoon crop effects for these soils. On PDS, only variety N25 had a significant positive SUC slope indicating a large increase in SUC for the variety with advance in ratoon crop number. These findings confirm that SUC was comparatively stable across ratoon crops compared to TCH.
Varieties N53 and N57 had the largest TSH intercepts for WDS and MDS, while N25 and N36 had largest TSH intercepts for PDS (Table 9). On WDS, only varieties N25 and N57 had significant TSH slopes suggesting larger TSH decline for the two varieties compared to the other varieties. On MDS, four varieties (N57, N23, N41 and N36) had significant negative TSH slopes, while all eight varieties had significant negative TSH slopes for PDS. Similar to TCH, PDS had greater TSH decline across ratoon crops than the other soil types. MDS had a greater TSH decline than WDS. This supports previous observations that TCH had a bigger influence on TSH than SUC.
3.4 Quadratic trends for TCH, SUC and TSHA
To graphically compare the influence of soil on trends of the three traits, quadratic curves were drawn per variety per trait per soil type. For WDS and MDS, varieties' TCH trends assumed the same pattern, which were parabolic curves facing downward (Figure 4). However, MDS curves generally were narrow compared to those of WDS confirming that varieties experienced a larger decline in TCH on MDS compared to WDS. The upward movement of variety N46 within the first four crops was observed on these soil types (i.e., WDS and MDS). This observation validates the positive slopes for this variety noted in the regression analysis. While the variety had mediocre plant cane yields on both soils, its trends indicate that it has a higher RA compared to the other varieties. Variety N57, which had a larger decline in the regression analysis on WDS, showed an incline in the first three crops before assuming a steeper decline from the third ratoon crop than all the other varieties. On MDS, N57 also showed a sharper decline from the second ratoon crop together with N23. The yield gap between N46 and N57 in the last ratoon crop was larger on MDS than on WDS. On PDS, unlike on the other soils, all varieties assumed a downward linear trend confirming the larger TCH decline on this soil type compared to the other soil types. Similar to MDS, N57 had consistently lower TCH from the second ratoon than the other varieties. On PDS, N46 had the lowest TCH decline indicating higher RA for the variety in this soil type as well.
Table 7: Results of regression analysis for tons cane per ha (TCH) based on ratoon crop number (plant crop and four successive ratoons) showing estimated intercepts and slopes of the regression lines and p-values of the slopes.
| Well draining soil | Moderately draining soil | Poorly draining soil | |||||||
| Variety | Intercept ± SE | Slope ± SE | P-value | Intercept ± SE | Slope ± SE | P-value | Intercept ± SE | Slope ± SE | P-value |
| N23 | 119.80 ±4.57 | -0.30 ±1.51 | 0.844 | 136.10 ±5.96 | -9.52 ±1.97 | <0.001 | 121.82 ±4.03 | -14.89 ±1.33 | <0.001 |
| N25 | 138.05 ±4.57 | -5.21 ±1.51 | <0.001 | 130.70 ±5.52 | -5.13 ±1.82 | 0.005 | 141.56 ±4.03 | -15.50 ±1.33 | <0.001 |
| N36 | 122.54 ±4.57 | -2.09 ±1.51 | 0.168 | 121.56 ±6.53 | -6.02 ±2.16 | 0.006 | 130.25 ±4.03 | -13.49 ±1.33 | <0.001 |
| N41 | 112.58 ±4.57 | -1.39 ±1.51 | 0.358 | 121.45 ±5.52 | -6.77 ±1.82 | <0.001 | 117.93 ±4.03 | -12.78 ±1.33 | <0.001 |
| N46 | 115.00 ±4.57 | 2.40 ±1.51 | 0.113 | 115.82 ±5.96 | 1.78 ±1.97 | 0.367 | 128.44 ±4.03 | -10.27 ±1.33 | <0.001 |
| N49 | 117.85 ±4.57 | -0.62 ±1.51 | 0.684 | 121.02 ±5.96 | -2.94 ±1.97 | 0.137 | 112.85 ±4.03 | -10.35 ±1.33 | <0.001 |
| N53 | 129.63 ±4.57 | -1.68 ±1.51 | 0.267 | 129.46 ±6.53 | -3.99 ±2.16 | 0.065 | 123.60 ±4.03 | -15.55 ±1.33 | <0.001 |
| N57 | 122.06 ±4.57 | -3.06 ±1.51 | 0.044 | 130.79 ±5.96 | -12.16 ±1.97 | <0.001 | 122.80 ±4.03 | -18.52 ±1.33 | <0.001 |
Table 8: Results of regression analysis for sucrose content (SUC) based on ratoon crop number (plant crop and four successive ratoons) showing estimated intercepts and slopes of the regression lines and p-values of the slopes.
| Well draining soil | Moderately draining soil | Poorly draining soil | |||||||
| Variety | Intercept ± SE | Slope ± SE | P-value | Intercept ± SE | Slope ± SE | P-value | Intercept ± SE | Slope ± SE | P-value |
| N23 | 17.57 ±0.25 | -0.10 ±0.08 | 0.204 | 15.99 ±0.42 | 0.12 ±0.14 | 0.374 | 16.64 ±0.29 | 0.18 ±0.10 | 0.069 |
| N25 | 16.60 ±0.25 | 0.16 ±0.08 | 0.054 | 16.07 ±0.39 | 0.23 ±0.13 | 0.072 | 16.88 ±0.29 | 0.26 ±0.10 | 0.007 |
| N36 | 19.07 ±0.25 | -0.08 ±0.08 | 0.303 | 17.86 ±0.46 | 0.14 ±0.15 | 0.378 | 18.60 ±0.29 | -0.09 ±0.10 | 0.330 |
| N41 | 17.93 ±0.25 | 0.10 ±0.08 | 0.210 | 17.42 ±0.39 | 0.18 ±0.13 | 0.178 | 17.57 ±0.29 | 0.18 ±0.10 | 0.069 |
| N46 | 17.87 ±0.25 | -0.05 ±0.08 | 0.546 | 17.02 ±0.42 | 0.07 ±0.14 | 0.594 | 17.73 ±0.29 | -0.06 ±0.10 | 0.527 |
| N49 | 18.85 ±0.25 | 0.00 ±0.08 | 0.958 | 18.04 ±0.42 | 0.10 ±0.14 | 0.480 | 18.89 ±0.29 | 0.15 ±0.10 | 0.121 |
| N53 | 18.64 ±0.25 | -0.08 ±0.08 | 0.311 | 16.93 ±0.46 | 0.15 ±0.15 | 0.322 | 18.67 ±0.29 | 0.11 ±0.10 | 0.277 |
| N57 | 18.62 ±0.25 | -0.11 ±0.08 | 0.162 | 16.81 ±0.42 | 0.13 ±0.14 | 0.337 | 18.37 ±0.29 | 0.04 ±0.10 | 0.695 |
Table 9: Results of regression analysis for tons sucrose per ha (TSH) based on ratoon crop number (plant crop and four successive ratoons) showing estimated intercepts and slopes of the regression lines and p-values of the slopes.
| Well draining soil | Moderately draining soil | Poorly draining soil | |||||||
| Variety | Intercept ± SE | Slope ± SE | P-value | Intercept ± SE | Slope ± SE | P-value | Intercept ± SE | Slope ± SE | P-value |
| N23 | 21.05 ±0.85 | -0.18 ±0.28 | 0.513 | 22.03 ±1.31 | -1.44 ±0.43 | <0.001 | 20.34 ±0.84 | -2.37 ±0.28 | <0.001 |
| N25 | 22.97 ±0.85 | -0.71 ±0.28 | 0.012 | 21.28 ±1.21 | -0.62 ±0.40 | 0.125 | 24.16 ±0.84 | -2.47 ±0.28 | <0.001 |
| N36 | 23.37 ±0.85 | -0.49 ±0.28 | 0.081 | 21.92 ±1.44 | -0.99 ±0.47 | 0.039 | 24.16 ±0.84 | -2.56 ±0.28 | <0.001 |
| N41 | 20.21 ±0.85 | -0.15 ±0.28 | 0.586 | 21.42 ±1.21 | -1.07 ±0.40 | 0.008 | 20.75 ±0.84 | -2.13 ±0.28 | <0.001 |
| N46 | 20.47 ±0.85 | 0.39 ±0.28 | 0.171 | 20.06 ±1.31 | 0.31 ±0.43 | 0.481 | 22.94 ±0.84 | -1.92 ±0.28 | <0.001 |
| N49 | 22.22 ±0.85 | -0.12 ±0.28 | 0.662 | 21.96 ±1.31 | -0.45 ±0.43 | 0.300 | 21.46 ±0.84 | -1.89 ±0.28 | <0.001 |
| N53 | 24.17 ±0.85 | -0.42 ±0.28 | 0.138 | 22.01 ±1.44 | -0.52 ±0.47 | 0.274 | 23.20 ±0.84 | -2.87 ±0.28 | <0.001 |
| N57 | 22.69 ±0.85 | -0.68 ±0.28 | 0.016 | 22.41 ±1.31 | -2.03 ±0.43 | <0.001 | 22.69 ±0.84 | -3.43 ±0.28 | <0.001 |
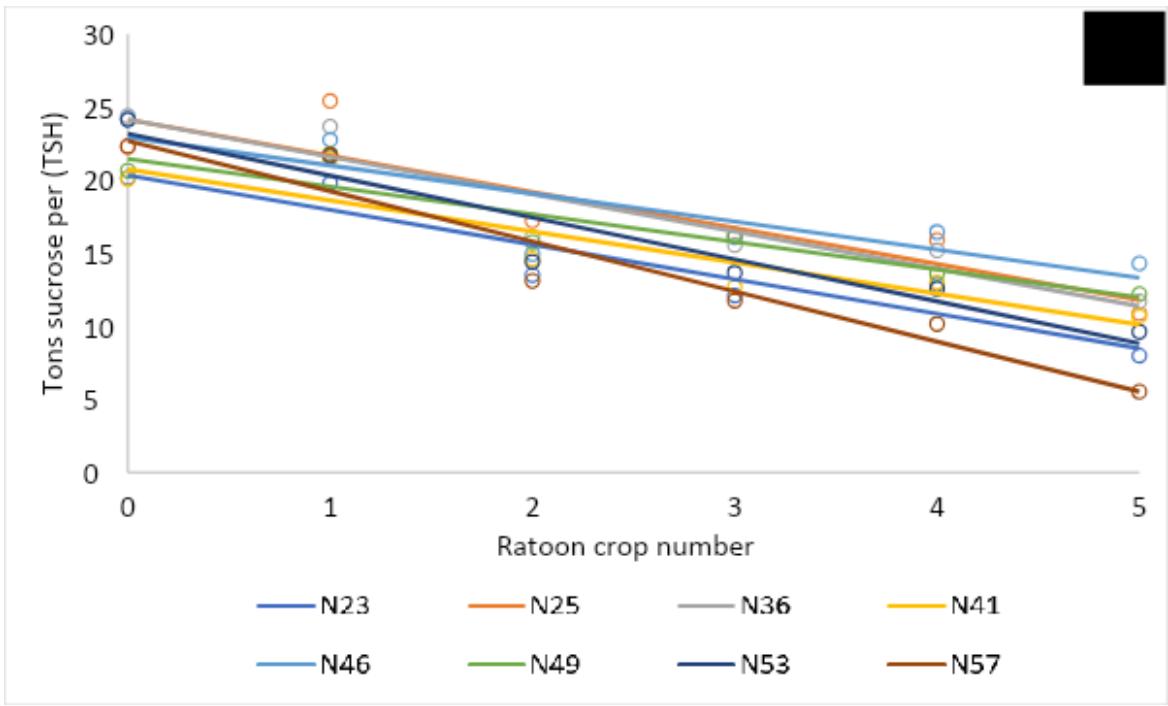
The SUC curves were almost similar for WDS and PDS indicating stability of the trait across ratoon crops (Figure 5), with some varieties showing insignificant increases as shown in the regression analysis. On MDS, the varieties assumed a parabolic curve facing downward. The varieties demonstrated an increase from the plant cane to the third ratoon crop after which they assumed a downward trend. The varieties' TSH curves (Figure 6) simulated those of TCH supporting the prior observation that the influence of TCH on TSH was larger than that of SUC.
IV. DISCUSSION
Significant soil type effects on varieties' ratoon cane and sucrose yields were apparent in this study largely due to their hydraulic properties. Loss of yields across ratoon crops was larger on PDS compared to WDS and MDS, and MDS experienced larger losses than WDS. WDS are deep and well-structured thus providing an effective crop root habitat. MDS are well structured, however, relative to WDS they are shallow hence root growth is restricted. On the other hand, PDS are weakly-structured/duplex soils and they are characterized by prolonged periods of waterlogging especially after heavy rains. Apart from the detrimental effect of anaerobic conditions on plant growth, waterlogged conditions lead to salinity and sodicity challenges. The accumulation of salts within the root zone limits root growth and development resulting in yield losses and decline across ratoon crops.
{"image_source":{"path":"images/74f22062dd56f471b69c1e76d3769f2ca6b5063f0dbcd778576e81c9f01b0e79.jpg"},"content":"","chart_caption":[],"chart_footnote":[]} {"image_source":{"path":"images/4146dff1e9aaaa7d710ce681f962c9509a195057a8ea00ef89ef81daf41065ae.jpg"},"content":"","chart_caption":[],"chart_footnote":[]}
{"image_source":{"path":"images/84eafce7ae933bf2246050e3015c046d9f8ee73f57b9352b1cb55914f59dc825.jpg"},"content":"","chart_caption":[{"type":"text","content":"Figure 4: Quadratic cane yield (TCH) trends for eight sugarcane varieties tested on three soil types (A: well draining, WDS; B: moderately draining, MDS; C: poorly draining, PDS) harvested over six successive crops (plant cane, 0 and five ratoon crops, 1 to 5)."}],"chart_footnote":[]} {"image_source":{"path":"images/58157be9d3aa5e2b0e61c1371093d1313267511531f379911cdea03c8f9c2b22.jpg"},"content":"","chart_caption":[],"chart_footnote":[]}
{"image_source":{"path":"images/65b64e929c4b0a0088f368bf691f27ec3ac7c60a99294be207d49e819cbcb39c.jpg"},"content":"","chart_caption":[],"chart_footnote":[]} {"image_source":{"path":"images/87902094588925c56ccb7d1932e714177b70669655f9ca9a237d4cfe9748e574.jpg"},"content":"","chart_caption":[{"type":"text","content":"Figure 5: Quadratic sucrose content (%) trends for eight sugarcane varieties tested on three soil types (A: well draining, WDS; B: moderately draining, MDS; C: poorly draining, PDS) harvested over six successive crops (plant cane, o and five ratoon crops, 1 to 5)."}],"chart_footnote":[]}
{"image_source":{"path":"images/ab0b04140b9de7539c9e2ea8f41b2ff248bc284e45fea55213149034264810b9.jpg"},"content":"","chart_caption":[],"chart_footnote":[]} {"image_source":{"path":"images/3c93761fa0b3abb1bf6b1a0527a15cfccb6599d85656234782625e43483dfb15.jpg"},"content":"","chart_caption":[],"chart_footnote":[]}
{"image_source":{"path":"images/9b7354355f5261cb1d3ae3aa6a897723eecb8d8ecafb1bf726a9489d4c789b51.jpg"},"content":"","chart_caption":[{"type":"text","content":"Figure 6: Quadratic sucrose yield (TSH) trends for eight sugarcane varieties tested on three soil types (A: well draining, WDS; B: moderately draining, MDS; C: poorly draining, PDS) harvested over six successive crops (plant cane, o and five ratoon crops, 1 to 5)."}],"chart_footnote":[]} To address these challenges and improve productivity of poorly draining soils, installation of subsurface drainage pipes (especially for irrigated cane), application of gypsum (Henry and Ellis, 1996), adoption of best irrigation practices (Nixon and Simmonds, 2004), and fallowing and green manuring (Nixon, 1992) are greatly recommended.
The significant variety x crop and soil x variety x crop interactions suggested that the varieties had different ratooning abilities, and these ratooning abilities were different for the three soil types. This therefore indicated the existence of opportunity to select varieties that are adapted to the different soil conditions. Crop yields can be improved by exploiting genetic diversity whereby broadly and or specifically adapted varieties are deployed in environments where their performances are optimized. Variety N46 which had low to average yields in the plant cane, showed great stability across ratoon crops for all soil types (i.e., broad adaptation) indicating that the variety is suitable for long ratoon crop cycles. Variety N25 which had the highest plant cane yields on WDS and PDS, and N23 which was the highest on MDS are ideal for shorter ratoon cycles because of the large yield decline across ratoon crops. Previous studies (Rattey and Kimbeng 2001; Rea and Vieira 2002; Kimbeng et al. 2009; Masri and Amein 2015; Mehareb et al. 2016; Sengwayo et al. 2016) also reported significant variety x crop interactions, signifying the importance of testing for ratooning ability. This further emphasizes the criticality of evaluating new sugarcane varieties across diverse soil types.
The larger soil x crop interaction than variety x crop interaction for the studied traits suggested greater soil type effect on crop yields than variety. In other words, soil conditions had more influence on yield than variety choice. Most growers are of the perception that a good variety on its own guarantees higher and sustainable yields. This finding disputes such an idea emphasizing that soil management is critically important if good yields are to be achieved and sustained over multiple crops. Similar findings were reported by Ramburan et al. (2013). These authors suggested that to enhance ratoon yields more focus should be placed on environment manipulation through good crop management rather than focusing on varietal longevity.
The greater contribution of TCH on TSH than SUC was glaring in this study. TSH is a secondary trait, produced from the primary traits, TCH and SUC. Other studies (Milligan et al., 1990; El-Hinnawy et al., 2001; Masri et al., 2008; Abu-Ellail et al., 2019; Gravois et al., 2019) have reported similar observations, suggesting that efforts directed at increasing TCH of ratoon crops will likely lead to higher TSH. However, such efforts should not compromise sucrose content levels. At both genetic and phenotypic levels, TCH and SUC are known to be negatively correlated (Milligan et al., 1990; Jackson, 2005; Klomsa-ard et al., 2013). Maybe with the advent of advanced biotechnology tools, geneticists will assist unravel and overcome this incompatibility. TCH is highly influenced by the environment while SUC is genetically determined (Nayamuth et al., 1999, 2005; Badaloo et al., 2005; Ramburan and Zhou, 2011; Sandhu et al., 2012). TCH has a more complex genotype x environment (GEI) compared to sucrose content (Jackson and McRae, 2001). This is mainly caused by the large number of genes with small individual additive effects that control this trait (Zhou et al., 2011; Zhou, 2015). The larger effect of soil type on TCH and TSH than variety, and larger effect of variety on SUC than soil type perhaps supports this understanding. The relative stability of SUC across ratoon crops than TCH and TSH probably emphasizes the same.
The causes of the differences in SUC trends across ratoon crops for the different soil types were not obvious. WDS and PDS trends were comparable, while MDS trends were not similar to those of WDS and PDS. Beyond soil type effect, this may also be attributed to location effect. The Big Bend trial site representing MDS is located south-east of the country while the Simunye and Mhlume sites representing WDS and PDS, respectively, are both located in the north-east as shown in Figure 1.
Future studies will need to investigate these differences in SUC in-depth. This will help inform future variety tests. Location effects in the current arrangement are treated as noise or confounding factors, yet incorporating them in the analyses may assist in explaining the GEI present in the trial networks.
The larger crop effect on the three traits relative to soil and variety effects underscores the great impact of environmental conditions on yields. Multi-environment trial studies reported that the environment accounts for a larger effect on yield variation than the effects of variety and variety x environment interactions (Gauch and Zobel, 1996; Verma et al., 2006; Anley et al., 2013; Akbarpour et al., 2014). The crop-year variable indicates the effects of biotic and abiotic factors on yields of aging ratoon crops (Zhou and Shoko, 2012). The yield in a ratoon crop is largely influenced by the prevailing conditions in which the ratoon crop grows (Ramburan, 2013). A ratoon crop growing under conducive climatic conditions is expected to yield better than one growing under less conducive conditions. In this study, variation in rainfall received during the testing period as shown in Figure 3 may have had tremendous effect on the differences in the ratoon crop yields.
V CONCLUSION
This study indicated that the effect of soil types on ratoon crop yields and varieties' RA should not be ignored. The rate of yield decline increases with decline in soil quality in terms of drainage properties. To exploit genetic gains, the diversity in varietal adaptability presented an opportunity to match varieties with their ideal soil types. The larger effect of soil type on cane and sucrose yields than variety effect was a critical finding for this study, emphasizing the importance of adapting best soil management practices in sugarcane production as opposed to relying only on improved varieties. TSH is a product of TCH and SUC, and TCH proved to have a bigger contribution to TSH than SUC. With TCH and SUC gains from breeding programmes having stagnated over the years, efforts to break this stagnation are needed if TSH is to be increased in the long-term.
Conflict of Interest
The authors declare no conflict of interest
ORCID
Conflict of Interest
The authors declare no conflict of interest.
Ethical Approval
Not applicable
Data Availability
The datasets used in this study are openly available at [repository link] and the source code is available on GitHub at [GitHub link].
Funding
This work did not receive any external funding.
References
Cite this article
Related Research



Special Issue
Launch a focused special issue to highlight research, emerging trends, and expert insights in your academic field.
