

IntelliPaper
Abstract
Heat stress is one of most domineering abiotic stress influences that border barley production. Herein, three different field screening locations were carried out at Sakha, Mallawi and New-valley research stations, to identify the response of ten barley genotypes to different temperatures degrees using phenotypic diversity and, multivariable analysis during two consecutive seasons 2020/2021 and 2021/2022 under different temperatures degrees. Heat stress index (HI) activated a reduction in all traits ranged from lowest average reduction in plant height PH by (5.43 and 20.37%) to highest average reduction in no. of tillers /m2TM by (14.49 and 40.83 %) under Malawi (T2) and New Valley (T3) locations respectively as camper by Sakha, also high temperature enhancement all the genotypes to quicken flowering and days to maturity by average (7.24 and 8.35 %) under New Valley. Days to heading HD and to maturity MD exhibited a strong and significant negative relationship with all studied traits Loading principal component analysis PCA accounted 86.1% of the total variability, which PCA2 clarified 24.2 % of the total variability influenced by HD and MD which placed in the left side (negative). Scatter plot of PCA categorizing all the barley genotypes in four groups indicated that the Egyptian barley genotypes (Giza 137, Giza 138, line5, line 1 and line 3) were separate from the other genotypes and located in the right side with of PCA1 analysis cluster with a significant distance which could be considered as a heat tolerance genotypes. A cluster heatmap according their resulted form all studied traits showing that the ten barley genotypes were clustered into two main clusters, Giza 137, Giza 138, line5, line 1 and line 3 were the most closed genotypes together due to their tolerance to heat stress while line 2 and line 8 were the most closed genotypes together due to their sensitive to heat stress. Thus, we could use them as a source for future barley breeding programs for heat stress such as important step to get a new genotype with high heat tolerance and high yield.
Explore Digital Article Text
I. INTRODUCTION
Heat stress is one of most vital climate change influences, which there was a universal will increase the average of temperature by 1.8–4 °C in the 21st century, the increasing will due to a significant yield losses with great dangers for the future global food safety around the worldwide (Mariey et al., 2023a, Horváth et al., 2024 and Habouh and Abo-Sapra, 2025). In Egypt temperature changes from low and worm in coastal zone to hot in the Upper area that the winter season is from December to February and the summer season from June to August, so these weather change had negative influence on Egypt agricultural strategy. (Elbasiouny et al., 2017 and Mahmoud et al., 2017 and Mariey et al., 2023a).
Barley (Hordeum vulgare L.) is a chief cereal crop that has well improved to numerous abiotic stresses in dry areas, it was found to be moderately tolerant to drought stress, due to it is the restricted amount of water that is available for irrigation (Habib et al., 2021 and Mariey et al., 2022). In Egypt, barley is a major winter crop cultivated in old and newly reclaimed lands that hurt from a dearth of irrigation, low soil fecundity, and salinity of both soil and water. However, there is a lack of consciousness of the nutritional role of barley for both humans and animals (Mariey et al., 2023b and Horváth et al., 2024) The important responsibilities for plant breeders is to increase yield per unit area by evolving high tolerant genotypes to be suitable for sowing in bad area which surfing from abiotic stresses, These tasks could be realized over using effective methods that help the breeders to screening and documentation the response of genotypes for stress. Agro-morphological parameters and yielding period were the most useful selection criteria to evaluation barley response to heat salinity stress under real field conditions. (Mariey et al., 2021, 2023 a, Horváth et al., 2024, Kim et al., 2024 and Habouh and Abo-Sapra, 2025).
Multi-traits include several related traits that could be included in a multivariate analysis. Bi-plot, principal component and cluster analysis were the most influence mathematical methods that could provide a simultaneous analysis of multiple variables to improve the ranking accuracy of the genotypes for abiotic stress in barley (Mansour et al., 2021, Mariey et al., 2022 & 2023b, Habouh, Abo-Sapra, 2025 and Kumar et al., 2025)
Consequently, understanding the phenotypic diversity among genotypes will help to ensure that the breeding program has the genetic diversity to improve biotic and abiotic stresses tolerance by crossing genetically-diverse parents having desirable characters, estimate of genetic diversity using phenotypic diversity is one of the primary and important steps in breeding programs for abiotic stresses tolerance (Mariey et al., 2021 & 2023, Horváth et al., 2024 and Habouh and Abo-Sapra, 2025).
The present study aimed to investigate the phenotypic diversity of ten Egyptian barley genotypes using some relative importance of some agronomical traits and classify them using multivariable analysis in order to offer genetic evidence for the future breeding programs for heat to intensification the production of barley under heat stress
II. MATERIAL AND METHODS
2.1. Barley plant materials
Ten barley genotypes were kindly provided by Barley Dep.,, Field Crops Research Institute, ARC, Egypt, were used in this study their names and pedigree shown in (Table 1).
| No. | Name | Pedigree |
| 1 | Line 1 | Giza 124/6/Alanda//Lignee527/Arar/5/Ager//Api/CM67/3/ Cel/WI2269//Ore/4/ Hamra,01 |
| 2 | Line 2 | BLLU/PETUNIA1//CABUYA/3/Alanda// Lignee527/Arar |
| 3 | Line 3 | Giza 118/3/Alanda/Hamra//Alanda,01 |
| 4 | Line 4 | Rihaneo3/7/Bda/5/Cr.115/Pro/Bc/3/Api/CM67/4/Giza120/6/Dd/4/Rihane,03 |
| 5 | Line 5 | Giza 2000/6/Alanda//Lignee527/Arar/5/Ager//Api/CM67/3/ Cel/WI2269//Ore/4/ Hamra,01 |
| 6 | Line 6 | Giza 119/3/Alanda/Hamra//Alanda,01 |
| 7 | Line 7 | Giza 117/6/Alanda//Lignee527/Arar/5/Ager//Api/CM67/3/ Cel/WI2269//Ore/4/ Hamra,01 |
| 8 | Line 8 | Giza 123/5/Furat 1/4/M,Att,73,337,1/3/Mari/Aths*2//Attiki |
| 9 | Giza 137 | Giza 118 /4/Rhn-03/3/Mr25-//Att//Mari/Aths*3-02 |
| 10 | Giza 138 | Acsad1164/3/Mari/Aths*2//M-Att-73-337-1/5/Aths/ lignee686 /3/Deir Alla 106//Sv.Asa/ Attiki /4/Cen/Bglo."S") |
2.2. Field investigational description
2.2.1. Field experimental Locations
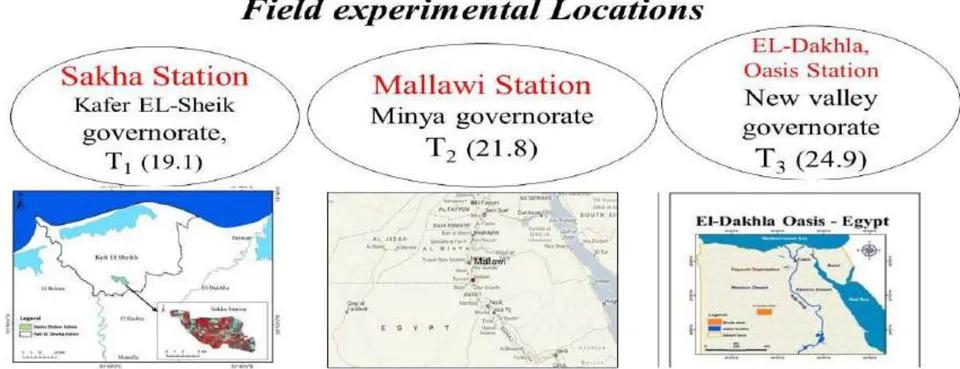
Three field experimentations were achieved in three dissimilar heat stress sites were growing during two winter sowing seasons of 2020/ 2021 and 2021. /2022 to study the effect of heat stress on ten barley genotypes yield production as shown in Fig 1:
Sakha station, locating in the center of the Delta -Kafer EL-Sheik governorate, has an elevation of 8.30 above sea level, with Latitude: N" and Longitude: E".
Malawi station, locating in Minya governorate with Latitude: N Longitude: E
EL-Dakhla, Oasis station, locating in New valley research governorate with Latitude: 25° 30' 59.99" N and Longitude: 29° 09' 60.00" E,.
2.2.2. Field experimental design
The ten genotypes were growing in a randomized complete block design (RCBD) with three replicates using (plot area =3.6 m ) for each plot, to evaluate the related traits to grain yield and heat stress index
2.2.3. Field experimental Soil samples
Soil samples were taken before land preparation in two depths from the soil surface; i.e. 0-15 cm and 15-30 cm. The physical and chemical analysis of different experimental sites were presented (Table 2)
| Soil analysis | Sakha Station | Mallawi Station | New valley Station |
| A: Physical analysis | |||
| Sand (%) | 18.94 | 14.1 | 67.1 |
| Silt (%) | 28.15 | 43.1 | 9.0 |
| Clay (%) | 51.35 | 40.2 | 23.9 |
| Texture | Clayey | Silty caly | Sandy clay loam |
| B: Chemical analysis | |||
| EC(dSm-1) | 2.76 | 1.62 | 5.78 |
| PH | 7.6 | 7.86 | 7.85 |
| K+ meq1001g soil | 0.1 | 0.57 | 0.58 |
| CaCO3- meq1001g soil | 0 | 2.21 | 4.52 |
| So4- meq1001g soil | 4.95 | 0.55 | - |
2.2.4. The Agro- meteorological information
The data of average month maximum and minimum temperatures ( ) and relative humidity (RH.,%), were documented for weather station belonging to the Sakha ( ), Mallawi ( ) and New Valley ( ) Station, Egypt during two growing winter seasons 2020/2021 and 2021/2022 were shown in (Table 3).
| Season | Month | Temperature, | Relative humidity, RH% | ||||||||||
| Sakha ( ) Normal temperature | Mallawi ( ) Medium temperature | New valley ( ) High temperature | |||||||||||
| Max. | Min | Mean | Max. | Min | Mean | Max | Min | Mean | Sakha | Malawi | New valley | ||
| Season 2020/2 021 | Dec. | 21.4 | 13.4 | 17.4 | 20.7 | 9.15 | 14.93 | 21.9 | 9.9 | 15.9 | 86.9 | 64.83 | 54.2 |
| Jan. | 18.4 | 11.8 | 15.1 | 18.7 | 6.13 | 12.42 | 28.0 | 7.6 | 17.8 | 86.7 | 64.83 | 54.5 | |
| Feb. | 20.4 | 12.7 | 16.6 | 22.7 | 9.82 | 16.26 | 25.7 | 9.8 | 17.75 | 84.6 | 61.81 | 41.9 | |
| Marc. | 22.6 | 15.6 | 19.1 | 28.7 | 14.2 | 21.45 | 30.0 | 13.8 | 22.9 | 81.1 | 61.19 | 32.9 | |
| Apr. | 26.0 | 18.9 | 22.5 | 32.53 | 17.1 | 24.82 | 35.5 | 18.2 | 26.85 | 80.0 | 53.46 | 25.2 | |
| season al | 21.71 | 14.4 | 18.4 | 24.6 | 11.8 | 17.9 | 28.2 | 11.8 | 20.4 | 83.6 | 61.2 | 39.9 | |
| Season 2021/2 022 | Dec. | 22.9 | 13.7 | 18.3 | 25.0 | 14.0 | 19.50 | 25.3 | 11.2 | 18.25 | 87.7 | 54.56 | 51.7 |
| Jan. | 21.0 | 13.5 | 17.25 | 24.5 | 12.5 | 18.50 | 23.1 | 6.6 | 14.85 | 86.7 | 54.54 | 44.9 | |
| Feb. | 21.5 | 12.5 | 17.0 | 23.5 | 9.71 | 16.61 | 25.2 | 8.4 | 16.8 | 87.5 | 54.20 | 43.6 | |
| Marc. | 23.8 | 15.2 | 19.5 | 29.3 | 13.9 | 21.60 | 31.6 | 14.6 | 23.1 | 83.8 | 52.35 | 35.2 | |
| Apr. | 27.6 | 19.4 | 23.5 | 31.0 | 14.6 | 22.80 | 31.9 | 15.5 | 23.7 | 74.6 | 45.51 | 27.3 | |
| season al | 23.35 | 14.8 | 19.11 | 26.6 | 12.9 | 19.8 | 27.4 | 11.26 | 19.34 | 84.06 | 52.23 | 40.5 | |
2.2.5. Measured Characteristics:
At the heading stage days to heading were recorded, at maturity stage days to maturity were recorded and at the harvest stage ten guarded plants were randomly taken from each plot to measure plant height cm, number of tillers , number of grains spike , and grain yield was determined using the full plot area (3.6 ).
2.2.6 Multivariable studied analysis
Heat stress index: The relative change due to heat stress was computed for each trait according to (Bouslama and Schapaugh, 1984)
Correlation coefficient: person and matrix were used to study the relationship between each two studied traits were done using Minitab 18.1 statistical software (Minitab Inc., Coventry, UK) and
Principal Component Analysis (PCA): Loading and scattered plot were performed to study the differences and interrelations between genotypes with respect to measured phenotypic traits using Minitab 18.1 statistical software (Minitab Inc., Coventry, UK) and
Heatmaps cluster: ClustVis: is a web tool for visualizing clustering of multivariate data, was used to constructed heatmaps (https://biit.cs.ut.ee/clustvis/) (Metsalu, et al., 2015)
2.7. Data analysis
All the data of the examined traits from the two seasons were homogeneity and statistically analyzed were exposed to ANOVA in a randomized complete block design (RCBD) to conclude the effects of genotypes, salinity levels and their interaction on the studied traits was performed using SAS software ver. 9.1 (SAS 2011). Duncan's test was used to compare mean values at levels of probability (Duncan, 1955).
III. RESULTS
3.1 Effect of different temperatures degrees on studied traits for barley genotypes
The ANOVA analysis of all phenotypic studied traits including days to heading (HD days), days to maturity (DM, days), plant height (PH, cm), number of tillers (TM, tillers /m ), number of grain spike (NGS grain /spike), thoued kernel weight (TKW, g) and grain yield (GY ard/fad) indicated a significant statistical effect (P < 0.01) by different temperatures degrees under three locations Sakha (T ), Malawi (T ) and New Valley (T ), cultivars (C), and years (Y) as shown in (Table 4).
A significant two-way interaction between temperatures degrees and barley genotypes (GXT) were observed for all studied traits. While, the two-way interaction between years x temperatures degrees (YXT) and years x genotypes (YXG) were significant. across all traits expect the, TM were non-significant. Similarly, the combined ANOVA indicated significant effect for three-ways interaction (GXTXY) across all traits, expect for TM, which were non-significant
The results indicate that high temperatures at Malawi and New Valley ( and ) caused a significant decrease in all studied characters, while caused a significant increase in HD and MD as compared with normal temperature at Sakha station ( ). which induced all genotypes to flowering and maturity early in Malawi and New Valley ( and ) more than Sakha station ( ). Correspondingly, the results showed diverse significantly which were found among all the Egyptian barley genotypes according their average of mean performances of all studied traits due to the differ temperature (Table 4), which the results showed that Giza 138, Line 1 line 3, line 5 and Giza 137 high average values for all studied under the high temperatures degrees than other genotypes recognized as greater heat tolerance barley cultivars traits, while Line 2 and Line 8 had low average values which they were more affected by heat stress. For grain yield GY, the results indicated that the heat stress significant reduced GY at Malawi and New Valley ( and ) more than Sakha station ( ) as showed in Fig 2. Giza138 gave the maximum values was (21.11, 19.03 and 17.47 ard/fad) at Sakha, Malawi and New Valley sites respectively with followed by Giza 137, Line 5, Line 3 and line 1, which all get high grain yield at Sakha, Malawi and New Valley sites respectively. However, line 2 had minimum GY values (15.11, 13.33 and 9.47 ard/fad) at Sakha, Malawi and New Valley sites respectively followed by Line 8 get lower GY were (15.89, 13.47 and 10.14 ard/fad) at Sakha, Malawi and New Valley locations respectively as showed in Fig 2. These results were in gooh harmony with (Kaseva et al., 2023, Mariey et al 2023a Kim et al., 2024, Horváth et al., 2024 and Habouh and Abo-Sapra, 2025). They reported that heat stress significantly reduced most of the grain-yield related traits, which they confirm that interaction G × E in grain yield was strong when applied across the years for each barley genotypes under heat stress, and they conveyed that high temperatures also have indirect negative significances on yield by margarine the plant cycle or unsettling optimal development forms.
| Studied traits | Days to heading days | Days to maturity days | Plant height cm | No. of tillers /m2 | No. of grain spike-1 | Thoued kernel weight (g) | Grain Yield ard/fad |
| Years | |||||||
| 2019/20 | 85.18 | 113.37 | 98.07 | 379.48 | 56.72 | 44.91 | 17.81 |
| 2020/21 | 84.77 | 113.26 | 99.33 | 378.36 | 55.73 | 44.36 | 17.50 |
| Temperature Degrees | |||||||
| (Sakha) T1 | 85.67 | 118.02 | 109.05 | 488.83 | 66.77 | 53.24 | 19.78 |
| (Malawi) T1 | 82.15 | 115.81 | 103.13 | 418.01 | 62.08 | 49.85 | 17.59 |
| (New valley) T2 | 79.47 | 108.17 | 86.83 | 289.23 | 44.52 | 34.19 | 14.78 |
| Barley cultivars | |||||||
| line 1 | 80.67 | 114.00 | 101.11 | 396.25 | 56.78 | 48.79 | 19.08 |
| line 2 | 84.44 | 113.72 | 83.67 | 256.19 | 52.11 | 43.21 | 13.53 |
| line 3 | 80.17 | 115.22 | 104.17 | 427.67 | 56.00 | 48.99 | 19.89 |
| line 4 | 83.83 | 113.67 | 96.89 | 359.89 | 61.00 | 44.92 | 18.61 |
| line 5 | 81.11 | 112.67 | 105.61 | 407.89 | 57.33 | 45.66 | 19.70 |
| line 6 | 84.46 | 113.82 | 92.70 | 373.01 | 55.43 | 45.56 | 17.42 |
| line 7 | 83.06 | 112.39 | 95.89 | 373.44 | 53.39 | 44.00 | 18.09 |
| line 8 | 85.78 | 113.44 | 93.56 | 259.17 | 49.44 | 42.78 | 14.86 |
| Giza 137 | 80.72 | 112.06 | 102.61 | 438.78 | 55.00 | 41.98 | 18.96 |
| Giza 138 | 80.22 | 112.72 | 105.22 | 453.44 | 62.33 | 43.18 | 19.54 |
| ANOVA analysis | |||||||
| Years (Y) | * | ** | * | NS | ** | ** | ** |
| Cultivars (C) | ** | ** | ** | ** | ** | ** | ** |
| Temperature (T) | ** | ** | ** | ** | ** | ** | ** |
| LSD (0.05) | |||||||
| Years (Y) | 0.381 | 0.876 | 0.891 | 4.54 | NS | 3.45 | 1.166 |
| Cultivars (C) | 0.808 | 1.123 | 1.79 | 11.15 | 3.34 | 3.54 | 2.18 |
| Temperature (T) | 0.442 | 0.876 | 0.969 | 5.56 | 1.831 | 1.56 | 1.906 |
| Interaction | |||||||
| CXY | ** | ** | ** | NS | NS | NS | ** |
| TX Y | ** | ** | ** | NS | NS | NS | NS |
| CXT | ** | ** | ** | ** | ** | ** | ** |
| CXTXY | ** | ** | ** | NS | NS | ** | ** |
{"image_source":{"path":"images/fc5019f87dfd923217016bd4fc2061bafb49f18f12c4e0972ba12cc2116fe030.jpg"},"content":"","chart_caption":[{"type":"text","content":"Figure 2: Effect of different temperatures degrees on grain yield among ten barley genotypes at Sakha, Malawi and New Valley locations"}],"chart_footnote":[]}
3.2 Multivariable analysis
3.2.1. Heat stress index (HI)
The virtual changes reduction due heat stress (HI) on morphological studied traits, were presented in (Figure 3), the results showed that heat stress activated a reduction in all traits ranged from lowest average reduction in PH by (5.43 and 20.37%) to highest average reduction in TM by (14.49 and 40.83%) under Malawi (T2) and New Valley (T3) locations respectively as camper by Sakha T1. About the heat index due heat stress on grain yield the results showed that there a reduction was happened due heat stress by average values. Nevertheless, heat stress induced all genotypes to flowered and maturity earlier by an average (4.11 and 1.87%) respectively under Malawi (T2) and by an average (7.24 and 8.35%) under New Valley (T3) location respectively as camper by Sakha T1as shown in (Figure 3). On behalf of the relative changes due heat stress on grain yield the results showed that there a reduction was happened due heat stress by average values (8.06 and 29.0%) under Malawi and New Valley location respectively. However, heat stress induced all cultivars to flowered earlier by an average (3.93 and 11.39%) respectively as shown in (Figure 3). This results were agree with (Devi et al 2021, Bhagat et al., 2023, Mariey et al 2023a, Kimet al 2024, Habouh and Abo-Sapra, 2025 and Kumar et al., 2025) whom, found that barley heat tolerant genotypes were significantly less affected by stress factors than heat sensitive genotypes which heat stress index is an inductor for detect the barley heat tolerant genotypes depends on it grain yielded values.
{"image_source":{"path":"images/489550a2e1570c0ffa549942f53daacb149bf2700d66559152dffbef4b6f7092.jpg"},"content":"","chart_caption":[{"type":"text","content":"Figure 3: Heat stress index of studied traits under Malawi T2 and New valley T3 as compere by T1 at Sakha station which days to heading (HD), days to maturity (MD), plant height (PH), number of tillers m2 (TM), number of grain spike-1 (NGS-1), thousands kernel weight (TKW and grain yield (GY), which the green refer to inducing flowering and maturity days."}],"chart_footnote":[]}
3.3.2 Correlation coefficient
Both Pearson and matrix correlation coefficient was done to recognize the relationships among all studied characters across the three different temperature degrees (three locations) (Figure 4 & 5). Results designated clearly that the correlation coefficients among grain yields GY and PH, TM, TKW and NGS traits were highly positive and significantly correlated. Days to heading HD exhibited a strong and negative relationship with all studied traits grain yield, and days to maturity MD showed negative relationship with all studied traits expect NGS. Theses results were in agreements with (Mariey et al 2023a, Kim et al., 2024 and Horváth et al., 2024) whom reported that there was a significant correlation between the heat stress-induced changes in grain-yield related traits. Figure 4: Pearson correlation coefficient heatmap among grain yield (GY) and days to heading (HD), days to maturity (MD), plant height (PH), number of tillers m2 (TM), number of grain spike-1 (NGS-1), thousands kernel weight (TKW) across the three heat stress locations. Correlation key and the scale reads, red box indicted strong negative correlation, green box indicted strong positive correlation, white yellow box mean medium positive correlation, orang box mean medium negative correlation
| HD | MD | PH | TM | TKW | NGS | |
| MD | 0.055 | |||||
| PH | -0.842 | -0.148 | ||||
| TM | -0.878 | -0.174 | 0.872 | |||
| TKW | -0.564 | -0.039 | 0.586 | 0.692 | ||
| NGS | -0.395 | 0.734 | 0.325 | 0.301 | 0.223 | |
| GY | -0.821 | -0.068 | 0.919 | 0.942 | 0.712 | 0.461 |
{"image_source":{"path":"images/c3f4efa846a89968dc54a5b879a18eb48a49f9579c9fb35cc20ad4046bd97f29.jpg"},"content":"","chart_caption":[{"type":"text","content":"Figure 5: matrix plot correlation coefficient heatmap among grain yield (GY) and days to heading (HD), days to maturity (MD), plant height (PH), number of tillers m2 (TM), number of grain spike-1 (NGS-1), thousands kernel weight (TKW) across the three heat stress locations."}],"chart_footnote":[]}
3.2.3. Principal component analysis (PCA)
3.2.3.1. Loading plot PCA
Loading plot was realized using distance matrix available in the horizontal axis chosen the direction of association among all studied characters was showing in (Figure 6). The results presented that principal component analysis PCA accounted 86.1% of the total variability. PCA1 lit 61.9% of total variation partial by PH, MT, NGS, TKW and GY characters were positioned in positive direction (right side) of the horizontal axis according to their positive significant correlations with other characters under study. The second PCA2 clarified 24.2% of the total variability influenced by HD and MD which placed in the left side (negative) of the horizontal axis conferring to its negative significant correlations with other characters under this study.
{"image_source":{"path":"images/4beab6abf0d7e2302c5c2d4a600a754c1f9ef2245335eccc860878dd5dfd8a94.jpg"},"content":"","chart_caption":[{"type":"text","content":"Figure 5: Loading plot graph, showing the first two principal components (PCA) of the correlation matrix among the studied characters which leaf area index (LAI), chlorophyll fluorescence (Fv/Fm), Total chlorophyll content SPAD, days of heading (HD), plant height (PH) numbers of tiller m2 (TM), number of grains spike, 1 (NGS,1), thousand kernel weight (TKW) and grain yield (GY)"}],"chart_footnote":[]}
3.2.3.2. PCA scatter plot
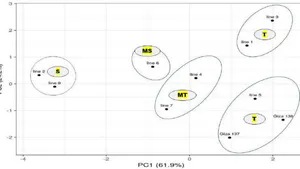
The scatter plot of PCA analysis based on all studied traits categorizing all the barley genotypes in four groups as shown in (Figure 6), which PCA analysis indicated that the Egyptian barley genotypes (Giza 137, Giza 138, line no5) and (line 1 and line 3) were separate from the other genotypes and located in the right side with of PCA1 analysis cluster with a significant distance, which they had achievement high average of all studied traits under study that could be documented them as heat tolerance genotypes. line 4, line 6 and line 7 which were distributed distance from one other in the scatter plot of PCA analysis cluster based in their medium average value of studied traits could be documented them as moderated heat tolerance genotypes. Whereas both of line 2 and 8 genotypes were scattered distance far from the two other groups which located on left side, as selected by cluster analysis of PCA2 affording to their lowest values of all studied traits with high reduction that could be recognized as heat sensitive genotypes. The results agree with (Mariey et al., 2023 and Kumar et al., 2025) they confirmed that principal component analysis PCA was the most impact mathematical devices that could provide a concurrent analysis of multiple variables to improve the position correctness of the genotypes for abiotic stress in barley.
{"image_source":{"path":"images/cd7e2a2d8f4ced705c93f0e67a72e1c844d83633f8c3bd3917eadc665198cbf3.jpg"},"content":"","chart_caption":[{"type":"text","content":"Figure 6: PCA scatter plot of all the ten barley genotypes based on studied traits"}],"chart_footnote":[]}
2.2.4. Heatmap Cluster Analysis
The heatmap cluster analysis were constructed to investigate the effect of different temperatures on morphological traits of ten barley genotypes which use Euclidean distance and average linkage by R software (Figure 7), which confidential all the genotypes and the traits in two chief dendrograms. Column dendrograms drawing all the morpho studied traits. Row dendrogram design the ten barley genotypes which the analysis clustered them into two main clusters, first cluster include the tolerance and moderated heat divided to sub cluster, first sub includes the heat tolerance barley genotypes (Giza 137, Giza 138, line 5, line 1 and line 3), second sub cluster consisted of moderated heat tolerant genotypes line 7. While Second cluster include the sensitive and moderated sensitive heat first cluster divided to sub cluster, first sub includes the heat sensitive barley genotypes (line 1 and line 8) and second sub cluster consisted of moderated heat sensitive genotypes line 4 and line 6. Our results were in good harmony with (Mohamed, et al 2021, Mariey et al 2022 and Mariey et al 2023 a&b) which They reported that heatmap cluster analysis had used positively in sympathetic the information of phenotypic evaluations of the barley genotypes as a significant factor using to helps the breeders to have good plan for their programs for specific environments using targeted traits {"image_source":{"path":"images/1a2e939c5f7e6ddc2ef2fb6f8852977dd28ccd94f365a95efb39a7cf52cddad3.jpg"},"content":"","chart_caption":[{"type":"text","content":"Figure 7: Multivariate heatmap illustrating the phenotypic diversity of ten barley genotypes, based morpho traits using the module of a heatmap of ClustVis, days of heading (HD) days to maturity MD, plant height (PH) numbers of tiller m2 (TM), number of grains spike,1 (NGS,1), thousand kernel weight (TKW) and grain yield (GY)"}],"chart_footnote":[]}
IV. CONCLUSIONS
Ten barley genotypes were grown in three different field screening locations carried out at Sakha, Malawi and New-valley research stations, which studied their response to three different temperatures degrees by using phenotypic diversity and, multivariable analysis, which the resulted indicted that Giza 138, Giza 137. Line 1, Line 3 and Line5 we could consider them as heat tolerance genotypes and both of Line 2 and Line 8 were heat sensitive genotypes, these differences enable the breeders to use the tolerant at cultivars as a good parent in heat stress breeding programmers in Egypt due to increase the farmer's income.
Conflict of Interest
The authors declare no conflict of interest.
Ethical Approval
Not applicable
Data Availability
The datasets used in this study are openly available at [repository link] and the source code is available on GitHub at [GitHub link].
Funding
This work did not receive any external funding.
References
Cite this article
Related Research

Special Issue
Launch a focused special issue to highlight research, emerging trends, and expert insights in your academic field.