



IntelliPaper
Abstract
Recent studies show that inequalities in transport infrastructure negatively impact educational performance. This article presents a model that indicates the factors associated with the adoption of Active School Transportation (AST)for the city of São Paulo. The results of the multinomial logistic regression show how the adoption of active transportation by students is explained by parents’ active commuting, car ownership, distance, and indirect route. They also highlight the school bus distribution policy and its risks, considering the competition between school buses and active commuting modes.
Explore Digital Article Text
I. INTRODUCTION
Recent studies show that inequalities between transport and educational infrastructure are mutually related. School transport options are vital to ensure greater equality in educational opportunities for diverse groups. Education and transportation are essential public services, part of universal and fundamental human rights, and therefore, the analysis of the link between those services must be intensified and deepened (Moreno-Monroy, Lovelace, & Ramos, 2018).
The adoption of active transport modes to school, known as Active School Transportation (AST), is correlated with stronger academic performance, higher levels of attention, and better mental health (Stewart, Moudon, & Claybrooke, 2014; Singh, Uijtdewillingen, Twisk, Mechelen, &
Chinapaw, 2012; Souza et al., 2019; Buttazzoni, Van Kesteren, Shah, & Gilliland, 2018). Furthermore, it is associated with the development of children's ability to move independently in the city, improving spatial notion, resilience, and the use of strategies to deal with risk (Sá, Rezende, Rabacow, & Monteiro, 2016; Babb, Olaru, Curtis, & Robertson, 2017; McDonald, 2008a).
Also, more active children have less propensity to obesity or high body fat. These children usually have lower blood pressure and a higher level of protective heart lipoproteins than those less active. AST Children have also better cardiovascular fitness, lower risks of metabolic syndrome, diabetes, osteoporosis, and cardiovascular disease (Chillón, Evenson, Vaughn, & Ward, 2011; McMillan, Day, Boarnet, Alfonzo, & Anderson, 2006; Souza et al., 2019; Ferrari, Victo, Ferrari, & Solé, 2018; Murtagh, Dempster, & Murphy, 2016). Furthermore, AST increases the possibility of including other moderate or intense physical activities in the routine, reinforcing the benefits of physical activity (Babb, Olaru, Curtis, & Robertson, 2017; McDonald, 2008a; Panter, Jones, & Sluijs, 2008). Researchers suggest that physical activities habits developed in childhood increase individual's chance of being an active adult if continued at school age (Telama et al., 2005; Shaw et al., 2015; Wen et al., 2008; de Rezende et al., 2014).
This article presents a multinominal logit model estimating the association between different classes of variables and the likelihood of AST adoption. Using those results we propose policies to encourage walking and cycling to school commuting. The paper is organized in six sections, including this introduction. The second section presents how scholarship define factors that might explain mode choice to school commuting. The third section explains the model and the data used to analyze São Paulo case. The results of the model are discussed in the fourth section. The fifth section discusses policies implemented, followed by the strengths and weaknesses of the model. Finally, the conclusion summarizes the main contributions of this article.
II. WHAT DO WE KNOW ABOUT ACTIVE COMMUTING TO SCHOOL
Researchers have identified several factors influencing school commuting choice. Before implementing the analysis of determinants for the case of São Paulo, we revise the evidence in other countries/cities and the previous evidence for São Paulo. We divide the analysis into two main categories: i. individual factors and ii. environmental factors. The first category is divided into three attributes: a) caregiver; b) student; and c) household. The second category includes attributes of a) urban form (especially the route); b) destination (in this case, the school); and c) the social environment.
2.1 Individual Factors
2.1.1 Students' Caregivers
Children's caregivers' characteristics, such as place of birth (Lee, Yoon, & Zhu, 2017) and education (Ermagun & Samimi, 2015; McMillan, 2003; Yang, Abbott, & Schlossberg, 2012; Ramírez-Vélez, et al., 2016), especially from the mother (Santos et al., 2010; DeWeese, Yedidia, Tulloch, & Ohri-Vachaspati, 2013), interfere with the mode choice. Liu, Ji, Shi, He, & Liu (2018) shows that in China parents with graduation or higher levels of education are more likely to walk to take their children to school rather than biking. Caregivers' transportation mode is highly correlated with children's mode choice in the United States (McMillan, Day, Boarnet, Alfonzo, & Anderson, 2006) and Australia (Wen et al., 2008). Mother working out of home reduces the odds of active mode choice to school commuting, while father working out of home increases it in the United States (McDonald, 2008b) and China (Liu, Ji, Liu, He, & Ma, 2017). McDonald, Brown, Marchetti, and Pedroso (2011) and Mitra and Buliung (2014) suggest that having an adult who stays at home increases the odds of commuting to school using active transportation modes, as opposed to homes where all adults work, study, or are looking for a job. Jobless parents reduce the odds of walking (Ermagun, & Samimi, 2018), or biking to school (Larouche, Stone, Buliung, & Faulkner, 2016).
Parents' perception of safety can inhibit the adoption of active modes (Kerr et al., 2006; Ferrari, Victo, Ferrari, & Solé, 2018; Rothman, Macpherson, Ross, & Buliung, 2018; Wilson, Clark, & Gilliland, 2018; Royne, Ivey, Levy, Fox, & Roakes, 2016), mainly for girls (McDonald, 2008a). Kerr et al. (2006) found that teenagers with parents with lower concerns about safety, crime, convenience, traffic, quality of sidewalks, commuting time, and distance regarding their child's commuting pattern presented a level of walking or cycling to school 5.2 times higher than parents with medium or higher levels of concern with these issues.
2.1.2 Students
McMillan, Day, Boarnet, Alfonzo, and Anderson (2006) use a survey of children from ten communities in California (USA) to assess differences in the adoption of active modes between genders. The results suggest that boys are more likely to active commuting than girls, in line with other research (McDonald, 2007; Evenson, Huston, McMillen, & Ward, 2003; Silva et al., 2011). However, controlling students' caregivers' mode choice, girls increased the likelihood of adopting active modes (McMillan, Day, Boarnet, Alfonzo, & Anderson, 2006). A study in Espírito Santo State (Brazil) shows that girls walk more to school while boys cycle more (Neto, Eto, Pereira, Carletti, & Molina, 2014).
The scholarship is not conclusive regarding the influence of age on commuting decision. Some studies find a positive relationship when controlling for age: the higher the age, the greater the likelihood of students using active modes (Pereira, Moreno, & Louzada, 2014; Ito et al., 2017); while others find a negative relationship (de Rezende et al., 2014; Silva, Vasques, Martins, Williams, & Lopes, 2011).
Students spending more time on computer (Dumith et al., 2010) or television (Silva, Vasques, Martins, Williams, & Lopes, 2011), reduces the odds of adopting active modes. Some studies also positively correlate the perception of students' safety with active mode choice (Napier, Brown, Werner, & Gallimore, 2011; Dias et al., 2019; Mendonça et al., 2018).
2.1.3 Households Attributes
Household features such as income (Braza, Shoemaker, & Seeley, 2004; Sener, Lee, & Sidharthan, 2019; Larsen, Gilliland, & Hess, 2012) and vehicle ownership (Rothman et al., 2015; Moran, Plaut, & Baron-Epel, 2016; Woldeamanuel, 2016) negatively influence the adoption of active modes. Bicycle ownership (Liu, Ji, Shi, He, & Liu, 2018); family size (Wilson, Marshall, Wilson, & Krizek, 2010; Woldeamanuel, 2016); and the presence of older people (Liu, Ji, Liu, He, & Ma, 2017) positive impact active mode choice.
The number of children in the family reduces the odds of bicycle adoption and has a positive impact on car adoption; the greater the number of children in the household, it is more likely that the child will commute to school by car since it is more difficult to accommodate them on a bicycle (Hasnine, Lin, Weiss, & Habib, 2018).
The difference between child's and adult's schedules, with different departure times, positively influences the adoption of active modes for school transportation (Liu, Ji, Liu, He, & Ma, 2017), as suggested by Mitra (2013).
2.2 Environmental Factors
2.2.1 Built environment
City attributes are also included in some models. Population density (Ewing, Schroer, & Greene, 2004; Sener, Lee, & Sidharthan, 2019); and mixed land use (McMillan, 2007; Larsen, Gilliland, &
Hess, 2012; Dias et al., 2019) have a positive impact on the likelihood of active mode choice in commuting to school. Several studies find a negative relationship between rural areas and the adoption of active modes in comparison with urban areas (Murtagh, Dempster, & Murphy, 2016; Pabayo, Gauvin, & Barnett, 2011; Jones & Sliwa, 2016).
Ewing, Schroer, and Greene (2004) define the concept of a "poor walking environment": characterized by low density, little mixed land use, long blocks, incomplete sidewalks, and other obstacles of uncontrolled urban expansion, favoring the use of the car and discouraging walking and cycling. Some of these characteristics were analyzed individually by other articles such as:
-
Sidewalk connectivity (Timperio et al., 2006; Rothman, To, Buliung, Macarthur, & Howard, 2014);
-
Availability of bicycle infrastructure (Gao, Chen, Shan, & Fu, 2018; Kerr et al., 2006; Lee, Yoon, & Zhu, 2017; Dias et al., 2019), including bicycle racks at the destination (Jones & Sliwa, 2016; Kamargianni, Dubey, Polydoropoulou, & Bhat, 2015); and
-
Street connectivity (Schlossberg, Greene, Phillips, & Johnson, 2006; Hume, et al., 2009).
All these characteristics positively impact the adoption of active modes. Only Lee, Yoon, and Zhu (2017) find a negative impact of the availability of bicycle infrastructure on active modes adoption, justifying that most students who used active modes walked, reducing the relevance of bicycle infrastructure.
The presence of paid or voluntary transit agents to help crossings near the school favors active modes (Jones & Sliwa, 2016). Wilson, Marshall, Wilson, and Krizek (2010), find that children in regions with a higher proportion of local streets (excluding highways and interstates) per square kilometer, adopted walking more frequently as their commuting mode. Timperio et al. (2006), Mitra and Buliung (2014), and Ito et al. (2017) show that the presence of highways or crowded roads in the child's route inhibited active modes. Larsen, Gilliland, and Hess (2012) and Dias et al. (2019), following the suggestion of Panter, Jones, and Sluijs (2008), find a positive impact the proportion of trees in the child's route on the adoption of active mode in school commuting. In addition to the shade benefits provided by the trees, the authors suggest that this result can be explained by an improvement in the neighborhood's aesthetics, influencing the positive perception of the walking environment and the social environment.
Studies carried out in Brazil (Becker et al., 2017; Silva et al., 2011), United States (Dellinger & Staunton, 2002; Napier, Brown, Werner, & Gallimore, 2011), Canada (Buttazzoni, Clark, Seabrook, & Gilliland, 2019; Larouche, Stone, Buliung, & Faulkner, 2016), England (DiGuiseppi, Roberts, Li, & Allen, 1998; Chillón, Panter, Corder, Jones, & Van Sluijs, 2015), Ireland (Murtagh, Dempster, & Murphy, 2016), Austria (Stark, Frühwirth, & Aschauer, 2018), Israel (Moran, Plaut, & Baron-Epel, 2016), China (Liu, Ji, Liu, He, & Ma, 2017), Australia (Wen et al., 2008; Timperio et al., 2006) and New Zealand (Ikeda, Hinckson, Witten, & Smith, 2019) found a negative relationship between distance to school and active commuting. Liu, Ji, Liu, He, and Ma (2017) also validated that the greater the distance between the caregiver's work and child's school, the greater the child's odds of adopting AST.
Direction also matters on mode choice. The chance of adopting active modes from school was greater than to school (Marshal et al., 2010; Sirard, Ainsworth, McIver, & Pate, 2005; Herrador-Colmenero et al., 2018). Schlossberg, Phillips, Johnson, and Parker (2005) state that parents reported that they take their children to school by car for convenience and comfort, despite the short distance. However, the way back has an increase in the number of children who adopt active modes, probably due to conflicting with parents' working hours.
Timperio et al. (2006) and Mitra and Buliung (2014) found that more direct routes (measured by the route distance on the road divided by the Euclidean distance) decrease the likelihood of active mode choice for children, in the opposite direction of the scholarship evidence for adults. However, the authors are cautious, highlighting the need for further study, which can indicate a difference between young people and adults (Timperio et al., 2006). Mitra and Buliung (2014) suggest that greater importance is given to route safety or quieter routes, with less weight for connectivity. Ito et al. (2017) calculate such a category as the relationship between the distance of the walking route and the car route, also finding a positive relationship and indicating the possibility of adults and children looking for a less busy route to walk.
2.2.2 School Environment
Some studies sought to understand how school attributes influence the pattern of school mobility. The existence of "magnet school" (outstanding schools) often increase distances from home to school and consequently the mode choice, with the opposite occurring with "neighborhood schools" – confined to a maximum distance from students' home in district's more densely populated (Wilson, Wilson, & Krizek, 2007; Wilson, Marshall, Wilson, & Krizek, 2010; Yang, Abbott, & Schlossberg, 2012).
Braza, Shoemaker, and Seeley (2004) and Kouri (1999) found a negative relationship between the number of students and walking; in contrast, Ito et al. (2017) found a positive relationship. AST is positively correlated with public school students compared to private school students (Silva & Lopes, 2008; Sener, Lee, & Sidharthan, 2019; Woldeamanuel, 2016). Pereira, Moreno, and Louzada (2014) found a higher prevalence of active modes in schools located in the suburbs studying in the morning or at night (as opposed to studying in the afternoon). The provision of materials promoting AST (Jones & Sliwa, 2016; Lee, Yoon, & Zhu, 2017) or maps with routes for students and guardians was positively associated with the use of active modes (Royne, Ivey, Levy, Fox, & Roakes, 2016).
2.2.3 Social Environment
The scholarship documents a positive association between social interaction and active mode choice. Ikeda, Hinckson, Witten, & Smith (2019), McMillan, (2007) and Hume et al. (2009) find this association using as the independent variable the likelihood of interaction with other children. Timperio et al., 2006 and Moran, Plaut, & Baron-Epel, (2016) confirm this association using a quantitative measurement of children in the neighborhood who could play with each other.
Other external environmental factors like climatic conditions such as rain, winds, and very high or very low temperatures also have relevance in active mode choice (Herrador-Colmenero et al., 2018; Kamargianni, Dubey, Polydoropoulou, &
Bhat, 2015; Larouche, Stone, Buliung, & Faulkner, 2016). For children aged 5-6 years, as the route gets steep, the odds of adopting the active mode decreases (Timperio et al., 2006).
III. MATERIALS AND METHODS
3.1 Empirical Strategy
The model estimates the probability of a student choosing the active mode (Pa), conditional on factors discussed in the last section. The model can be specified as:
Where Ua is the utility derived by the user from using an active mode defined as:
where is a constant; PARh the caregivers' attributes; STUh the attributes from the student who resides in the household h; HOUh the housing's attributes; ENVaij the built environment, in this case, characteristics of the route from i to j; COSTa the monetary mode cost
(2) variable; and a mode-specific error vector. Each characteristic has variables for its composition, as explained in Table 1. The table also shows the expected signal for the coefficient concerning active transport., and represent vectors with the coefficients for each respective variable.
Table 1: Composition of variables with expected associations for AST
| Characteristics | Variables | Description | Expected association |
| Individual factors | |||
| $PAR^h$ | Active Transport Adoption | Not adopted | 0 |
| Caregiver or spouse adopted active mode at least once | + | ||
| Spouse | No spouse | 0 | |
| With spouse | - | ||
| Education | Caregiver and spouse without a university degree | 0 | |
| Caregiver or spouse with a university degree | - | ||
| Caregiver and spouse with a university degree | - | ||
| Employment status | Caregiver and spouse jobless | 0 | |
| Caregiver and/or spouse with employment at home | - | ||
| Caregiver or spouse with a job outside the home | - | ||
| Caregiver and spouse with a job outside the home | - | ||
| $STU^h$ | Sex | Female | 0 |
| Male | + | ||
| Age | Increasing value | + | |
| $HOU^h$ | Log(income) | Increasing value for family income log | - |
| Dummy for car or motorcycle ownership | Without possession | 0 | |
| Possession of one or more car(s) or motorcycle(s) | - | ||
| Dummy for bicycle ownership | Without possession | 0 | |
| Possession of one or more bicycles | + | ||
| Brothers | No brothers | 0 | |
| Presence of brothers | + | ||
| Environmental factors | |||
| $ENV_{a}^{ij}$ | Distance | Increasing value | - |
| Direction | To school | 0 | |
| From school | + | ||
| Indirect route | Route distance divided by Euclidean distance | - | |
| $COST_a$ | Cost | Estimated cost for different modes | + |
Some assumptions about errors must be included to compose the model. First, errors are independent: the error terms follow a univariate distribution, allowing the calculation of a one-dimensional integral to compute the probabilities. This means that the usefulness of an alternative's unobserved component is not related to the same as another alternative (Train, 2002). Second, the errors follow a Gumbel distribution (Croissant, 2012). Finally, the errors are homoscedastic, i.e., identically distributed (Croissant, 2012). From these hypotheses, it is possible to obtain the usual logit model, as shown by Croissant (2012) and Train (2002).
The estimates were made with the R-Studio program, using the Apollo package developed by Hess and Palma(2019a). Three types of variables are specified:
-
xij: specific alternative variables with a generic coefficient;
-
zi: specific individual variables with specific coefficients for alternatives; and
-
wij: specific alternative variables with specific coefficients for alternatives.
From this definition, the deterministic component of the utility for an alternative will be estimated by:
The focus of the analysis will be to model the difference between alternatives, for example, between the walking alternative (a) and the car alternative (c), which will be given by:
and therefore, the coefficients of the specific individual variables, including the intercept, must be specific for alternatives. Otherwise, they would disappear in the differentiation.
Coefficients and significance levels do not provide information for policies to indicate which factor is most influential; they only highlight the association between variables. The percentage of change in odds, on the other hand, expresses the magnitude of the effect of each model variable on modal choice, with everything else held constant (McMillan, Day, Boarnet, Alfonzo, & Anderson, 2006). An essential part of the analysis will be, therefore, to calculate the chance of the active mode being chosen over the car, according to a particular variable, obtained directly from the exponentiation of the coefficients found (Fávero, 2015).
3.2 Empirical analysis in a South-hemisphere city: São Paulo
Despite the almost universalization of primary education – in 2016, 96% of adequate age children were properly enrolled in Brazil – many problems persist. For example, this figure does not consider the high rates of age-grade distortion and dropout levels. In high school, only 82.6% of students are adequately enrolled (Pepe, 2017).
The lack of income, the unavailability of schools close to the student's home, and the transportation service's inefficiency correspond to of the reasons for school dropout (Pepe, 2017). In an attempt of avoiding this issue, two main programs were created, willing to provide conditions for children to get to schools without facing difficulties related to distance or costs: the Free of Charge School Bus (TEG in Portuguese) and the Student Free-Pass (PLE in Portuguese), that will be better discussed in the policies section (6).
Brazilian education is divided into basic and higher education. Basic education, in turn, is divided into three categories (Table 2):
Source: adapted from Ministry of Education (2006), Federal Senate (2005). Note: the dataset included one year for each stage Table 2: Division of basic education in Brazil
| School stage | Expected age range | Minimum duration |
| 1) Kindergarten | Up to 5 years old | |
| 1.1) Daycare | Up to 3 years old | |
| 1.2) Preschool | 4 and 5 years old | |
| 2) Elementary and middle $^{1}$ | Up to 14 years old | 9 years |
| 2.1) Elementary | From 6 to 10 years old | 5 years |
| 2.2) Middle | From 11 to 14 years old | 4 years |
| 3) High | From 15 to 17 years | 3 years |
According to the School Census of 2010, there were 10,251 schools in the Metropolitan Region of São Paulo, 54% public (22% in state schools and 32% in municipal schools) and 46% studying in private schools. Students from public schools are usually assigned to schools closest to their home or their caregivers' work, and high school students can apply for a place in another school with a valid justification and subject to availability (Moreno-Monroy, Lovelace, & Ramos, 2018).
The variables of mode choice and socioeconomic characteristics were based on the household survey carried out by Metrô called OD Survey (Origin and Destination). Households are randomly selected in the Metropolitan Region of São Paulo. Each household resident is asked about the trips made on the previous day (indicating duration, point of origin and destination, and the reason for the trip) and their characteristics (such as age, gender, income, educational level, and occupation, among others). We work just with São Paulo City, that is the main subject of our analysis since the transport policies (such as TEG and PLE) analyzed in this paper are restricted to the central municipality.
Only Elementary and Middle School students from public schools were selected for this analysis. For each educational category, students within the age group were selected according to Table 2, adding one year at the end of each category, avoiding the exclusion of students who entered the correct age but had a birthday throughout the year.
Only origin or destination trips whose motivation was related to education were used in the analysis, as the objective of the work is to formulate policies that encourage the adoption of AST. All sample adjustment are detailed on Figure 1.
The OD survey does not allow to verify if all the modes are available for a given individual; it only identifies which one was chosen, classifying the model specification as revealed preference. For this reason, an assumption that all modes are available at the moment of choice was made, simplifying the counter-factual elements necessary to carry out the analysis, which is plausible considering the aggregation of modes of transport carried out. It was also considered that the choices are mutually exclusive: when choosing a transport mode, the traveler could not choose another. Consequently, it was used the variable obtained directly from OD Survey, the main mode, that defines a hierarchy according to the carrying capacity, given in descending order: 1) metro, 2) train, 3) bus, 4) chartered transport, 5) school transport, 6) taxi, 7) driving a car, 8) car passenger, 9) motorcycle, 10) bicycle, 11) others, and 12) on foot (Metro São Paulo, n.d.; Metropolitan Transportation Planning and Expansion Board, 2008). For example, if someone uses both the taxi and the subway, the subway will be considered the main mode.
The package Stplanr from R-Studio was used to calculate the distance between the origin and destination of each trip. The package calculates the shortest car route using the OpenStreetMap base. Only trips that allowed the route calculation and that contained the main mode remained in the base, totaling 23 missings in 2007 (from 10,330) and 22 in 2017 (from 8,420). All can be seen in Figure 1.
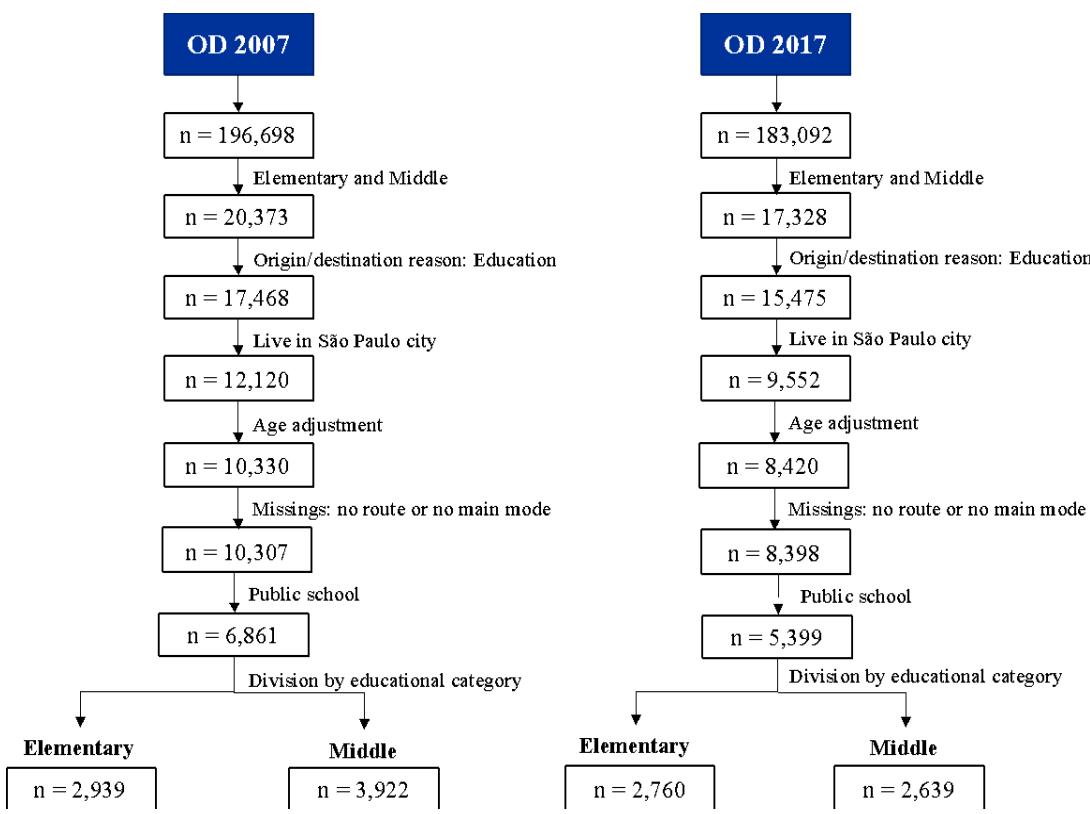 Figure 1: Adjustments to the OD survey bases (2007 and 2017)
IV. RESULTS
39,4% in 2007 and 41,1% in 2017 of the students' caregivers cycled or walked the day before the survey. In general, the highest educational degree was Elementary in the survey sample of 2007 and High School in 2017's survey, for both parents. Usually, one caregiver work predominantly out of the home – the one who is the financial responsible – while the other do not have a job, for the two years analyzed. In 2007, 26.9% of families did not report the presence of spouses, a figure that grew to 28.8% in 2017.
Most students were in Elementary school in 2007 (56.1%), while in 2017, the distribution started to be equal between the two levels of education. The average age was ten years in both periods in the survey sample. Despite the differences showing a non-linear behavior (Figure 2), it was impossible to model distance categories, using the continuous variable instead.
{"image_source":{"path":"images/c2ebb3ace35005b816afdb3cf38afbb6a4b7f559a86de5c4df48bd31516f47de.jpg"},"content":"","chart_caption":[{"type":"text","content":"Figure 2: Distribution of trips between active and motorized by distance"}],"chart_footnote":[]}
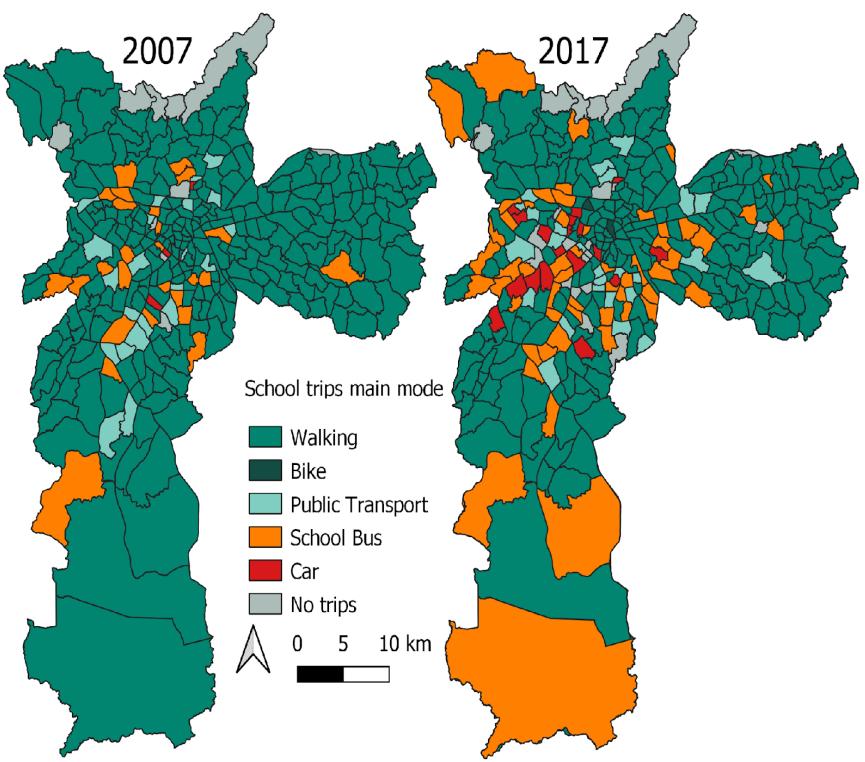 Figure 3: Distribution of school trips by main mode
Figure 3 presents the main school trip mode by zone OD (classification used by Metrô). The increase in car and school bus use between 2007 and 2017 is noteworthy.
Most students are male, but the difference is timid (50.3% in 2007 and 52.3% in 2017). The family's average income in 2007 and 2017 was BRL 1,677.83 and BRL 2,891.57, respectively, nominal terms. Car ownership increased 13.5% in the period, while bicycle ownership fell 18.4%. Most families have more than one child, although there was a 10.0% drop in the proportion of families with more than one child between the two years analyzed.
The average travel distance decreased between 2007 and 2017, from 3.1 kilometers to 1.9 kilometers, and the distance between home and school dropped from 2.9 km to 1.9 km. Figure 4a presents the results of the logistic regression for Elementary Schools while Figure 4b presents the results for Middle School.
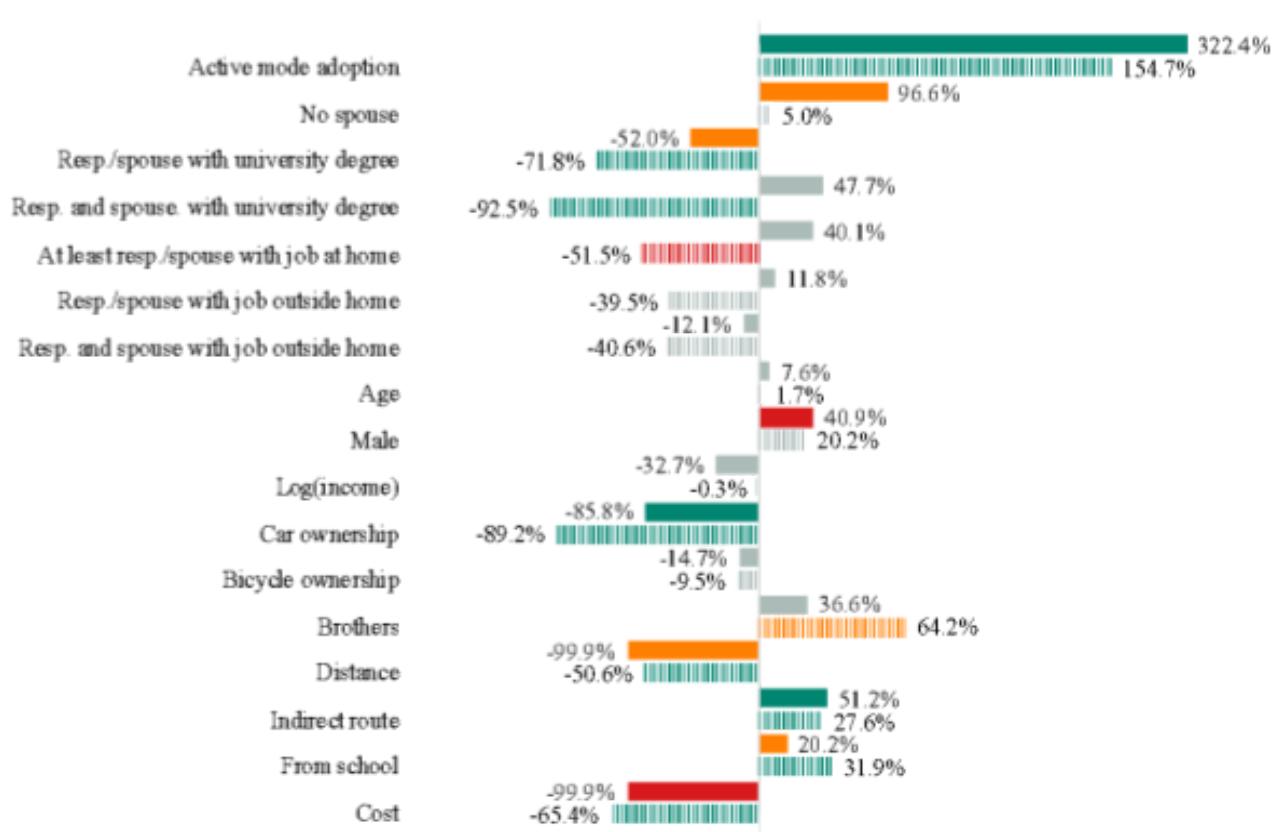 Figure 4: Odds for use of active mode for school trips
The Table in the Supplementary Material presents the coefficients, standard deviation, and p-value for each education category in 2007 and 2017. Coefficients and significance levels only highlight the association between variables, not representing which factor is most influential. So, the analysis focus on analyzing the percentage of change in the chance of adopting the active mode for each variable, all else being constant (McMillan, Day, Boarnet, Alfonzo, & Anderson, 2006), as shown in Figure 4. All results are evaluated according to the motorized private transportation, i.e., if there is a variation in the age of students, ceteris paribus, the mode's probability of choosing active transportation in comparison with the motorized private transportation varies towards the coefficient sign.
4.1 Individual Factors
4.1.1 Students' Caregivers
For all groups, the adoption of active transport by those caregivers positively impacts the choice of walking and cycling (not significant only for Middle School in 2007).
The likelihood to walk or bike to school increases in families without spouses, a result also found by Pabayo, Gauvin, and Barnett (2011), but only significant for Elementary School in 2017. For Middle School in 2007, the likelihood of using active modes to commute to school decreases for families with no spouse.
Having one of the caregiver with a university degree reduces the chance of adopting walking or cycling for all models. Liu, Ji, Shi, He, and Liu (2018) also found this effect for adopting the bicycle as a commuting mode to school, but not for walking. With the caregiver and spouse with a university degree, the probability of walking and cycling to school also decreases, except for Elementary School in 2017, whose effect is positive but not significant. This effect is probably related to other variables not included in the analysis but is showing that walking and biking to school in São Paulo is more prevalent in low income families.
For families whose caregiver and/or spouse has a job at home, the chance of adopting active modes to school decreases for Elementary School in 2007 and Middle School in 2007, with no significant effects for other groups. Having at least one caregiver with job outside the home, does not affect the chances of adopting the active modes significantly. This finding is in line with the literature that are inconclusive for the topic. For example, for McDonald (2008b) and Liu, Ji, Liu, He, and Ma (2017), the mother working outside the home negatively impacts the adoption of active transportation to school, while the father working outside the home positively impacts the likelihood of adopting active modes to commute to school. Additionally, some studies suggest that having an adult who stays at home, compared to homes where all adults work, study, or are looking for a job, increases the chance of walking to school (Mitra & Buliung, 2014; McDonald, Brown, Marchetti, & Pedroso, 2011), while others show that parents without a job encourage less use of walking (Ermagun & Samimi, 2018; Larouche,
Stone, Buliung, & Faulkner, 2016). We found no significance in this variable.
4.1.1 Students
A one-year increase in age significantly impacts the likelihood of walking and cycling to school only for Middle School in 2007, increasing by 25.6%. Previous analyses have not reached a consensus on the subject as well, but the result of the present study follows the trend of most studies (Wilson, Clark, & Gilliland, 2018; Pereira, Moreno, & Louzada, 2014; Ito et al., 2017).
In agreement with other studies (McDonald, 2012; McMillan, Day, Boarnet, Alfonzo, & Anderson, 2006; Sener, Lee, & Sidharthan, 2019), the present work found that male students are more likely to adopt active modes to commute to Elementary School in 2017 and to Middle School in 2007.
4.1.2 Students' Household
For Elementary School in 2017, an increase in the percentage of income negatively impacts the probability of adopting active modes in commuting to school. This result may indicate that one of the reasons that lead to active transport is insufficient income to bear the monetary cost of a motorized commuting. This is a problem: active modes in commuting to school is not a choice but a "lack of choice".
In all regressions, car ownership decreases the likelihood of commuting to school using active modes, in agreement with the literature (Rothman et al., 2015; Moran, Plaut, & Baron-Epel, 2016; Woldeamanuel, 2016).
Bike ownership did not show significant results in any studied groups. For Elementary School in 2007, the presence of siblings increases the chance of adopting active modes by 64.2%.
4.2 Environmental Factors
4.2.1 Built Environment
In 2007, a one-kilometer increase in the route had negatively impacted the chance of adopting the active mode by 50.6% and 84.5% for Elementary and Middle School, respectively. In 2017, the magnitude was 99.9% for Elementary School and is not significant for Middle School.
The increase in the indirect route index shows positive results for all groups in the adoption of the active mode, not significant only for Middle School in 2017.
In consensus with several studies (Marshal et al., 2010; Wilson, Marshall, Wilson, & Krizek, 2010; Sirard, Ainsworth, McIver, & Pate, 2005; Herrador-Colmenero et al., 2018), trip from school, rather than to school, are more likely to be by walking or cycling.
4.2.2 External Factors
One of the main differentials of the current study was to add the cost of travel as an explanatory variable, as suggested by Panter, Jones, and Sluijs (2008), but not included in any study according to the best of our knowledge. The increase in the cost of travel decreases the adoption of all modes compared to the car for all groups, being not significant only for Middle School in 2017.
V. STRENGTHS AND LIMITATIONS
This is the first work with data from the municipality of São Paulo, specifically for Students in Elementary and Middle School, to assess factors associated with active transport choice to commute to school. Despite this advance, several variables were not included due to the lack of disaggregated data, mainly on environmental factors, such as density of green space, quality of sidewalks, and quality of intersections. The environment's characteristic included – distance – is noisy, as it is calculated by the shortest car route, which may not represent the route used by the student.
VI. TRANSPORT POLICIES FOCUSED ON EDUCATION PURPOSE
In an attempt to reduce school dropout, two main programs were created in São Paulo city: the TEG and the PLE. The TEG, on December 22, 2003, through Law 13,697, was created to facilitate public-school students' access to public schools.
Children, who live up to 2 km far from school or have some handicaps are offered a free service of school bus to go and return to school or from after school programs. Drivers may be individuals, legal entities, or linked to cooperatives. Besides the drivers, the kids are also accompanied by a monitor. The supervision of contracts and documentation for drivers, monitors, and vehicles are managed by the Department of Public Transport (DTP, in Portuguese), while the requests made by students and schools are managed by the Municipal Secretary of Education (SME, in Portuguese), together with the Regional Education Boards (DRE, in Portuguese) (São Paulo City Hall, 2018; São Paulo (City), 2003).
For students who do not fit TEG conditions, the PLE program, established in February 2015, provides a total exemption of public transit fares for students in the public school, according to general requirements (Pepe, 2017). The students receive quotas that are provided in the format of a Single Daily Ticket, limited to two blocks of four trips (in up to three hours) per day and vary according to the frequency required by the institution: from five quotas per month (courses with one attendance per week) up to 24 quotas (courses with five attendances per week) (SPTrans, 2015; Legislative Assembly of São Paulo State, 2015). There is a low entry criterion in the PLE, which establishes that students who live only 1 km far from school are eligible.
For Pepe (2017), TEG and PLE are the two most costly programs for the municipal education budget. In addition to the high cost of transportation, there is also the incompatibility problem between the address provided by the family to the Secretary of Education and SPTrans and the real address of the student. To assure enrollment in one of the central schools, the student may provide a "fake" address, attesting that she lives close to the school and thus, is not eligible for the PLE. Later, however, they apply to the PLE program, providing the actual address to SPTrans. Hence, part of the resources must be allocated to check the data provided by students each organization.
Despite these initiatives, further studies should seek to understand the distribution of school transport policy and its risks, considering the competition between mothorized and active modes for this purpose. Policies such as TEG and PLE must be analyzed in depth to assess whether the solution to one problem has not created another problem increasing the use of motorized trips do school.
The present study takes one first step in this direction, seeking to understand which factors explain the adoption of AST in São Paulo city, which could be the target of policies to stimulate it.
The adoption of active transport by student's caregivers has a positive impact on the choice of walking and cycling mode, in line with the hypothesis that active adults induce active young people, posed by literature, but not always proven in studies (McMillan, Day, Boarnet, Alfonzo, & Anderson, 2006).
A topic widely discussed in the literature is the gender gap in modal adoption (McDonald, 2012; McMillan, Day, Boarnet, Alfonzo, & Anderson, 2006; Sener, Lee, & Sidharthan, 2019). These studies and the present one found that being male increases the chance of adopting active transport. This gender bias is a common problem with active transportation in several countries and should be addressed with policies.
An increase in the percentage of income negatively impacts the probability of adopting active modes for Elementary School in 2017. This may mean that one of the reasons that lead to active transport is the insufficient income to bear the monetary cost of a motorized trip. This should be considered carefully, as it could imply that these families can switch to motorized transport as soon as they have enough income (or as soon as the motorized trip is cheaper). As a result, public policy needs to act quickly to seize the opportunity for these families to use active modes not encouraging mode change. Another possibility is that, given an increase in income, families may decide to place their child in a private school, which may increase the commuting distance.
Further studies for more detailed conclusions are essential to understand this crucial factor.
Car ownership decreases the chance of taking the active mode to school, in São Paulo and in many cities. Thus, policies that discourage the purchase and use of cars are always welcome. Increasing taxes on private cars (especially for purchasing a second car), on oil consumption and parking fees in places with more concentrated educational resources and public transit (Liu, Ji, Shi, He, & Liu, 2018) have been suggested as resorts. Although this result seems evident, it cannot be guaranteed a priori that the ownership of a vehicle implies less use of active modes. In principle, people who do not own a vehicle could always opt for motorized modes (for example, buses). Hence, the results reinforce the hypothesis that policies that inhibit car use are welcome.
The higher the indirect route index more likely is the adoption of the active modes. Mitra and Buliung (2014) stated that although a negative relationship between indirect route index and adoption of active modes for adults is expected, children can show different behavior. The authors state that the traffic risks may overlap with the positive perception of connectivity, leading children to adopt more indirect routes, a result also found by Timperio et al. (2006). Nonetheless, more in-depth studies, with more spatially disaggregated data, should better investigate this hypothesis to indicate priority routes to public policies.
The literature review brought a shred of evidence to affirm that a policy for active school transportation must consider the caregivers' standards and perceptions of safety to be effective. However, just changing the parents' perceptions is not enough; policies that improve the safety of the surroundings must also be implemented. Parents interviewed point to the possibility of children going on active transport if trips are made in a group and improving infrastructure for this mean (Schlossberg, Phillips, Johnson & Parker, 2005). Organizing groups to school could be an exciting alternative to be explored in the cases of TEG and PLE for students living less than 2 km far from school, together with other policies that consider the factors that influence the AST.
VII. CONCLUSIONS
The developed multinomial logistic regression model for the city of São Paulo, using data from 2007 and 2017 OD Survey, enabled the estimation of the factors associated with the adoption of active modes to commute to school. The results reinforce the results found in the literature for other cities. Based on these determinants, policies and programs that consider the regional characteristics for adopting active transport can be considered (Ferrari, Victo, Ferrari, & Solé, 2018).
The analysis of data for São Paulo indicates the importance of influencing parents' attitudes towards their children. If those caregivers adopt active modes, the chance of their children also adopting increases. This is a critical factor that can be the target of policies: increasing the likelihood of children and adolescents commuting by active modes to school involves changing parents' perception on the subject and their attitude, which may have an impact on the general obesity levels of the population among other health benefits (McMillan, Day, Boarnet, Alfonzo, & Anderson, 2006).
The results also highlight the possibility of conflict between the school transport policy offered by the government and the adoption of the active mode.
ACKNOWLEDGMENTS
We want to acknowledge the support we had from Rodrigo Moita. Many thanks to Stephane Hess and David Palma for access to and instructions on using the Apollo package.
Funding
This study was partially funded by the Coordenação de Aperfeiçoamento de Pessoal de Nível Superior – Brasil (CAPES) – Finance Code 001.
Conflict of Interest
The authors declare no conflict of interest.
Ethical Approval
Not applicable
Data Availability
The datasets used in this study are openly available at [repository link] and the source code is available on GitHub at [GitHub link].
Funding
This work did not receive any external funding.
References
Cite this article
Related Research



Special Issue
Launch a focused special issue to highlight research, emerging trends, and expert insights in your academic field.
