Abstract
The aim of this article is to develop a method to find the importance of web pages without using web browser data or invading the privacy of users. Rather, it works on the structure of a website. To achieve this goal, we propose a novel method that can take webpage content as input and produce a score for each page automatically. Initially, we extract content from a web page in real-time. Subsequently, we consider two important factors based on the website structure: (1) “What is the minimum number of clicks needed to access web pages in a website?” and (2) “How a web page is linked with other web pages in a website?” We use a learning method to train our model by using the “web page views” results generated by “Google Analytics” and “Similar Web”. Experiments and Case studies on the world’s most popular websites show that our method can produce very effective results in real-time.
Explore Digital Article Text
I. INTRODUCTION
The most noticeable developments in the Twenty-First century are the innovations that led to the Information Age. The Twenty-First century has all the characteristics of an Information Age as e-commerce takes center stage in our modern life. This is evident in the different enterprises that heavily depend on websites such as banking, shopping, education, hotelier services, and transport. Online shopping is probably one of the most successful innovations in e-commerce.
Through online shopping, many startups have developed different franchises which depend on users' past buying history. This includes advertising, accessing additional customers through social media and marketing in general. Therefore, the primary target is to make a website more intuitive.
One of the most popular applications in this category is "Google Analytics" (www.analytics.google.com) In this case, the developer will review the most viewed web pages, a user's interest in a specific web page and the time spent on that specific web page. This process has been automated by "Google Analytics", perhaps the premier website analyzer in the marketplace. For "Google Analytics" to be practical, code has to be facilitated for the webserver, which the admin uses to manage the analytics. Figure 1 shows the "Google Analytics" code segment that an admin has to set on their server to retrieve results.
"Similarweb" (https://similarweb.com), a web mining application on website traffic, also analyzes the audience behavior of a website. However, it also uses the user's personal information.
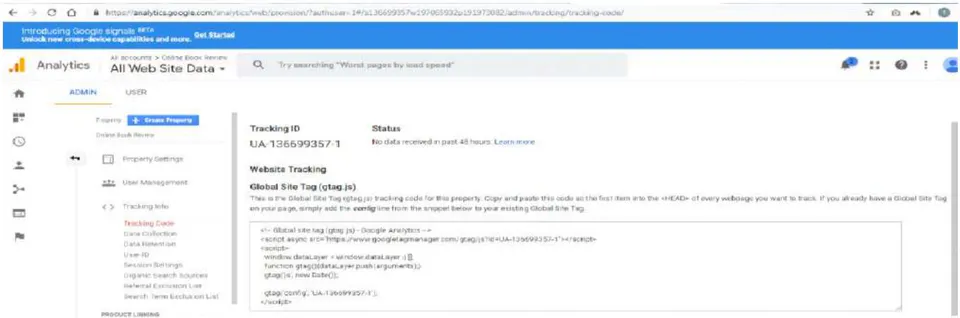
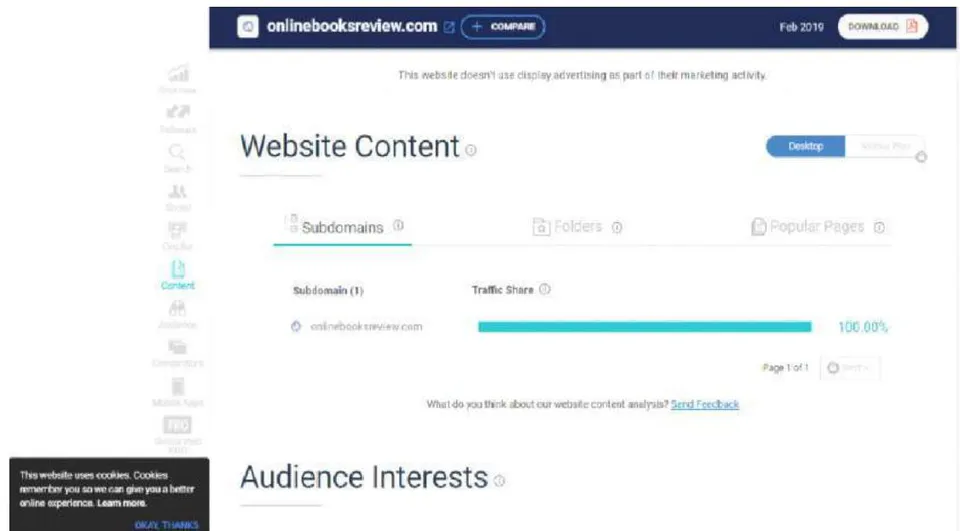
Figure 2 shows that there is a message about using cookies displayed on their application. Therefore, the majority of the tools are using the user's personal information to determine the user's browsing behaviors. However, it is difficult to find the user's personal information or personal choices on websites. So a plausible, less intrusive, solution to this challenge is the use of a website's structure. Hence, we propose a system that tracks web pages in real-time and determines their importance by analyzing the structure of their website.
To analyze the structure of web pages, we reviewed one hundred web pages. We selected these pages from the top twenty websites ranked by Alexa. By analyzing the structure, we find five important factors;
i) The accessibility of the web pages, ii) The influence of a web page on a website, iii) The content of a web page, iv) Interacting web pages and v) Sharable web pages. The case study on the factors that influence the web pages' importance is represented in section 2. This work aims to provide a solution for online advertisements agencies, by providing an insight into the most viewed pages and providing suggestions to the web developer. This paper makes the following contributions;
We develop an automated system that suggests areas that require improvement to make a particular web page more important. This is based on the structure of the website, and therefore no user data is required.
By considering five different factors from the results of a Google Analytics case study on different websites, we propose a numeric measurement of the importance of web pages on a specific website and also represent the rank (Best, Good, Average and Poor) of the web page.
We successfully conduct two case studies, by observing and analyzing the web pages of an "Online Book Review" website for twelve weeks, and conducting analysis on five hundred different websites from Alexa using the "Similar Web" tool, since we don't have server access to these sites.
We conduct an additional case study on the web page "Contact Us" of the website "Online Book Review". We make four versions of it and show how this page can achieve more views by adopting our proposed system's suggestions.
To validate our work, we use two types of validity – internal and external.
For internal validity, we represent the results in a confusion matrix. We automatically generate the features for the web pages using our extension that can extract the number of images, videos, links etc. Then we check the page manually and analyze the content of a web page. After that, we compare the results with manual results and produce a further confusion matrix.
For external validity, we also use both cases. We generate the features for both cases using our extension. Then we apply "CatBoost" to produce the importance value and rank. In the case of the "Online Book Review" website, we use our generated features as input and the important value produced by "Google Analytics" as output. On the other hand, for websites ranked by Alexa, we also use the automatically generated features as input and the importance value generated by the "SimilarWeb" as output. Finally, in both cases, we use the "Pearson Correlation Coefficient" and "Spearman Correlation Coefficient" results to show the effectiveness of our work.
- Finally, we show four case studies on four types of rankings generated by our system with automatic suggestions. We manually check the effectiveness of our suggestions.
The rest of this chapter is organized as follows: in section 2.2 we represent our case studies for finding the important factors. Then in section 2.3, we review recent research on the topics of web mining. Section 2.4 describes the architecture of the proposed system for finding the importance of web pages. The experimental results are presented; and a discussion about the evaluation of these results, case studies, and validations are presented in Section 2.5. Finally, Section 2.6 summarizes the chapter and forms some conclusions.
II. FACTORS BEHIND THE WEB PAGES IMPORTANCE: CASE STUDIES
A case study is conducted to ascertain the factors behind the importance of a web page. The most popular websites from "Alexa" are selected for this study. Alexa describes each of the websites on their list based on the user's interest. Twenty websites are selected among the top list of websites for the case study. Some criteria are taken into consideration before choosing the websites for the study. Below we discuss which websites are excluded:
"Google.com" is excluded because it is comprised of a search page where users need to type in their keywords. So, other website web pages depend on the user's keyword search. This made us exclude "Google.com" from our case study as we choose websites that are not dependent on any specific web page.
Websites such as "Yahoo", "Facebook", and "Twitter" which require user accounts to access them are also excluded. The reason for its exclusion in our case study is that these sites can't be accessed as a guest.
We ensure that all websites we work with have all the essential features such as images, texts, videos, and user interactions. So, YouTube is also excluded as most of its features include videos and hence this concentration is a single media type is considered problematic.
We also ensure that a website written in English is selected for the case study. This is important as we feel that the website text is an important feature. So, we exclude websites that don't use the English language such as "baidu.com", "sohu.com", "Qq.com", and "Tmail.com". In reality, this rationale is simply to accommodate the limitations of the researchers.
Pornographic websites are avoided because of their adult content.
We also excluded one-page websites such as "thestartmagazine". The rationale behind this is that we feel that it's important to take into account the minimum number of clicks which won't be possible with a single-page website. Hence, the work presented in this paper only considers multiple-page websites as its domain of research.
Websites like Wikipedia are also avoided because it is essentially a one-page website whereby any information clicked on appears on another Wikipedia web page which makes it difficult to measure web page hierarchy.
Hence, it is important to understand that our domain of application is limited to those websites which are not examples of our exclusion rules. We believe that the included sites are still the majority of websites (we use 500 websites from the first 656 websites from Alexa in this research). After developing the selection criteria, we spent a period of three months September 2021 to November 2021 monitoring suitable sites.
Table 1 shows the name and rank of the website that is selected from the "included list" for the case studies. The rank is recorded on a monthly basis (September 2021, October 2021 and November 2021) and changes over time; however, the rank is selected for the maximum number of days within the month. For example, if "amazon.com" was ranked 10 for 25 days in September, we choose that; a significant number of the websites are related to "e-commerce" in our case study.
| Name of the Website | Ranking of the website according to "Alexa" | ||
| September 2021 | October 2021 | November 2021 | |
| Amazon.com | 10 | 10 | 8 |
| Blogspost.com | 23 | 21 | 27 |
| Microsoftonline.com | 33 | 28 | 28 |
| Ebay.com | 41 | 45 | 37 |
| Github.com | 47 | 47 | 47 |
| Imdb.com | 48 | 48 | 48 |
| office.com | 50 | 52 | 55 |
| stackoverflow.com | 51 | 49 | 49 |
| Fandom.com | 55 | 57 | 59 |
| wordpress.com | 57 | 56 | 52 |
| imgur.com | 58 | 60 | 60 |
| Apple.com | 61 | 61 | 61 |
| Adobe.com | 62 | 67 | 67 |
| Amazon.in | 65 | 65 | 69 |
| Quora.com | 79 | 81 | 78 |
| Bbc.com | 85 | 82 | 85 |
| Roblox.com | 90 | 95 | 96 |
| Popads.com | 91 | 93 | 93 |
| Cnn.com | 102 | 99 | 100 |
| Spotify | 107 | 120 | 120 |
Therefore, twenty websites are chosen from the "Alexa" top list for our case study. The selected websites were observed for three months. We chose 10 web pages all from a website for the case study. 5 out of these 10 pages are most visited while the other 5 represent the less visited pages. These data are collated from the "Similar Web" web application. Below are the steps we used for this study:
The top 5 most visited and 5 less visited webpages names along with their number of views were extracted from the "Similar Web" app using an automated API (https://github.com/druidoff/similar-web-api/blob/master/SimilarWeb.php). The name of these web pages was collected for 3 months, between September and November 2021. There were variations to the most visited and less-visited pages daily. Based on our case study on 20 websites and 10 web pages each from selected websites, it implies that we collate data from 20 "Alexa" websites daily. This means within three months, we collected data from 18,200 web pages. After data collection from "Alexa", we proceeded to collect data for our case study from web pages we have earlier identified. We focus on the following critical features such as i) Web page contents, ii) Web page influence on a website, iii) Web page accessibility iv) web page interactions and v) sharable web pages.
To collect web page accessibility data, a site map is created automatically. The technique used will be discussed in detail in section 4. An extension is created to generate the site map. We use this extension to all the 20 Websites manually and an XML sitemap (XML sitemap is a simple list of all the website pages) was produced. Since we cannot define the hierarchical structure in an XML sitemap, therefore, after we have generated the sitemap we will then use it to find the names of all websites' webpages. Also, several duplicate entries were observed in the sitemap, so after we have generated it automatically we then presented it manually in a hierarchical tree structure. We took the names of the web pages from the sitemap and searched for them manually on the websites. After we have found out the webpage name through our search, we then put down the current web page name as "child" and "parent" for where the webpages were found. For example, if we found the "profile" page on the "Home" page that implies that we note the "profile" page as a child while the "home" page will be denoted as a parent. After we completed this pairing process, we were able to easily generate the website's tree structure. We were then able to discover the web page accessibility for all 18,200 web pages automatically for our case study. Table 2 shows the 3 monthly results of the accessibility of the web pages.
After we found the tree structure of the websites, we then used the tree structure to generate a similarity graph of the websites. However, the graph is not sufficient enough to represent a website because of the high amount of edges appearing on the actual graph representation. For instance, let us assume we can access "Profile" web page from 3 separate web pages of the websites. On the tree structure, we set the "Profile" as a child of the "Home" page. So when a similarity graph is generated, only one edge will be shown while on the actual graph, 3 more edges are shown. To solve this issue, after we generated the similarity graph, we then automatically extracted the web pages' name that can be visited through the current web page. After that, we then deleted the links that are not presented on the same websites (Suppose a link for sharing Facebook, a different website is found). We find these links manually also. Then, edges were set for all the web pages from the current in the similarity graph (Nodes represent web pages' names in the similarity graph). We then find the web page's influence from that graph. We gave in-depth details in section 4. Table 3 shows the 3 months results of the accessibility of the web pages.
We then collected the web page contents data (number of images, words, videos, weblinks), web page interactions (login, signup, checkout etc.), and shareable web pages (web pages capable of being shared to other social media websites) automatically. All these data were collected within 3 months.
| Name of the Website | Accessibility of web pages | |||||
| Category 1 | Category 2 | |||||
| Max | Min | Median | Max | Min | Median | |
| Amazon.com | 3 | 2 | 2 | 1 | 0 | 1 |
| Blogspost.com | 2 | 1 | 2 | 1 | 0 | 1 |
| Microsoftonline.com | 3 | 2 | 2 | 2 | 0 | 1 |
| Ebay.com | 3 | 2 | 2 | 1 | 0 | 1 |
| Github.com | 2 | 1 | 1 | 1 | 0 | 1 |
| Imdb.com | 4 | 2 | 2 | 2 | 0 | 0 |
| office.com | 3 | 2 | 2 | 1 | 0 | 0 |
| stackoverflow.com | 4 | 2 | 2 | 2 | 0 | 0 |
| Fandom.com | 2 | 1 | 1 | 1 | 1 | 0 |
| wordpress.com | 3 | 2 | 2 | 2 | 1 | 0 |
| imgur.com | 2 | 1 | 2 | 1 | 0 | 0 |
| Apple.com | 3 | 2 | 1 | 1 | 0 | 0 |
| Adobe.com | 2 | 1 | 2 | 1 | 1 | 0 |
| Amazon.in | 3 | 1 | 1 | 2 | 0 | 1 |
| Quora.com | 3 | 2 | 2 | 1 | 0 | 1 |
| Bbc.com | 4 | 2 | 3 | 1 | 0 | 1 |
| Roblox.com | 3 | 1 | 2 | 2 | 1 | 0 |
| Popads.com | 4 | 2 | 1 | 1 | 0 | 0 |
| Cnn.com | 3 | 1 | 2 | 1 | 1 | 0 |
| Name of the Website | Influence of a web page on a website | |||||
| Category 1 | Category 2 | |||||
| Max | Min | Median | Max | Min | Median | |
| Amazon.com | 1.818 | 0.672 | 1.221 | 1.818 | 0.672 | 1.221 |
| Blogspost.com | 1.234 | 0.427 | 0.872 | 1.234 | 0.427 | 0.872 |
| Microsoftonline.com | 1.126 | 0.482 | 0.756 | 1.126 | 0.482 | 0.756 |
| Ebay.com | 1.112 | 0.426 | 0.728 | 1.112 | 0.426 | 0.728 |
| Github.com | 1.781 | 0.657 | 1.025 | 1.781 | 0.657 | 1.025 |
| Imdb.com | 1.289 | 0.429 | 0.821 | 1.289 | 0.429 | 0.821 |
| office.com | 2.114 | 0.782 | 1.412 | 2.114 | 0.782 | 1.412 |
| stackoverflow.com | 1.782 | 0.678 | 1.129 | 1.782 | 0.678 | 1.129 |
| Fandom.com | 1.987 | 0.698 | 1.231 | 1.987 | 0.698 | 1.231 |
| wordpress.com | 2.112 | 0.772 | 1.467 | 2.112 | 0.772 | 1.467 |
| imgur.com | 1.123 | 0.419 | 0.758 | 1.123 | 0.419 | 0.758 |
| Apple.com | 1.256 | 0.425 | 0.857 | 1.256 | 0.425 | 0.857 |
| Adobe.com | 1.984 | 0.678 | 1.241 | 1.984 | 0.678 | 1.241 |
| Amazon.in | 2.123 | 0.782 | 1.435 | 2.123 | 0.782 | 1.435 |
| Quora.com | 1.678 | 0.578 | 1.098 | 1.678 | 0.578 | 1.098 |
| Bbc.com | 1.876 | 0.612 | 1.287 | 1.876 | 0.612 | 1.287 |
| Roblox.com | 1.987 | 0.682 | 1.257 | 1.987 | 0.682 | 1.257 |
| Popads.com | 1.876 | 0.662 | 1.298 | 1.876 | 0.662 | 1.298 |
| Cnn.com | 1.276 | 0.452 | 0.872 | 1.276 | 0.452 | 0.872 |
| Name of the Website | Images on a webpage | |||||
| Category 1 | Category 2 | |||||
| Max | Min | Median | Max | Min | Median | |
| Amazon.com | 39 | 7 | 17 | 13 | 2 | 6 |
| Blogspost.com | 10 | 2 | 7 | 5 | 0 | 4 |
| Microsoftonline.com | 11 | 3 | 6 | 4 | 1 | 2 |
| Ebay.com | 32 | 6 | 11 | 16 | 2 | 6 |
| Github.com | 4 | 0 | 2 | 2 | 0 | 1 |
| Imdb.com | 12 | 3 | 6 | 6 | 2 | 2 |
| office.com | 15 | 3 | 5 | 5 | 3 | 1 |
| stackoverflow.com | 6 | 1 | 3 | 3 | 2 | 1 |
| Fandom.com | 11 | 2 | 5 | 4 | 2 | 2 |
| wordpress.com | 10 | 2 | 4 | 5 | 2 | 1 |
| imgur.com | 13 | 1 | 9 | 5 | 0 | 3 |
| Apple.com | 21 | 3 | 17 | 11 | 1 | 9 |
| Adobe.com | 12 | 2 | 10 | 4 | 1 | 4 |
| Amazon.in | 32 | 5 | 24 | 16 | 2 | 12 |
| Quora.com | 8 | 1 | 6 | 3 | 1 | 2 |
| Bbc.com | 12 | 2 | 5 | 6 | 1 | 2 |
| Roblox.com | 17 | 2 | 9 | 6 | 1 | 3 |
| Popads.com | 12 | 1 | 7 | 6 | 1 | 4 |
| Cnn.com | 31 | 3 | 17 | 11 | 2 | 1 |
| Name of the Website | Number of words in a web page | |||||
| Category 1 | Category 2 | |||||
| Max | Min | Median | Max | Min | Median | |
| Amazon.com | 265 | 102 | 221 | 67 | 17 | 51 |
| Blogspost.com | 900 | 321 | 567 | 78 | 21 | 55 |
| Microsoftonline.com | 121 | 81 | 109 | 189 | 101 | 156 |
| Ebay.com | 123 | 89 | 98 | 23 | 19 | 20 |
| Github.com | 289 | 218 | 265 | 28 | 12 | 22 |
| Imdb.com | 247 | 127 | 187 | 34 | 14 | 29 |
| office.com | 265 | 123 | 210 | 93 | 29 | 56 |
| stackoverflow.com | 1081 | 657 | 891 | 244 | 128 | 182 |
| Fandom.com | 230 | 124 | 189 | 332 | 159 | 218 |
| wordpress.com | 429 | 128 | 321 | 134 | 29 | 98 |
| imgur.com | 129 | 98 | 121 | 321 | 129 | 228 |
| Apple.com | 287 | 129 | 189 | 453 | 239 | 329 |
| Adobe.com | 127 | 80 | 102 | 32 | 12 | 21 |
| Amazon.in | 328 | 213 | 289 | 24 | 15 | 18 |
| Quora.com | 821 | 578 | 682 | 87 | 12 | 56 |
| Bbc.com | 928 | 456 | 781 | 33 | 18 | 25 |
| Roblox.com | 278 | 189 | 221 | 29 | 21 | 27 |
| Popads.com | 210 | 178 | 192 | 21 | 11 | 18 |
| Cnn.com | 316 | 135 | 219 | 87 | 28 | 67 |
| Name of the Website | Number of words in a web page | |||||
| Category 1 | Category 2 | |||||
| Max | Min | Median | Max | Min | Median | |
| Amazon.com | 265 | 102 | 221 | 67 | 17 | 51 |
| Blogspost.com | 900 | 321 | 567 | 78 | 21 | 55 |
| Microsoftonline.com | 121 | 81 | 109 | 189 | 101 | 156 |
| Ebay.com | 123 | 89 | 98 | 23 | 19 | 20 |
| Github.com | 289 | 218 | 265 | 28 | 12 | 22 |
| Imdb.com | 247 | 127 | 187 | 34 | 14 | 29 |
| office.com | 265 | 123 | 210 | 93 | 29 | 56 |
| stackoverflow.com | 1081 | 657 | 891 | 244 | 128 | 182 |
| Fandom.com | 230 | 124 | 189 | 332 | 159 | 218 |
| wordpress.com | 429 | 128 | 321 | 134 | 29 | 98 |
| imgur.com | 129 | 98 | 121 | 321 | 129 | 228 |
| Apple.com | 287 | 129 | 189 | 453 | 239 | 329 |
| Adobe.com | 127 | 80 | 102 | 32 | 12 | 21 |
| Amazon.in | 328 | 213 | 289 | 24 | 15 | 18 |
| Quora.com | 821 | 578 | 682 | 87 | 12 | 56 |
| Bbc.com | 928 | 456 | 781 | 33 | 18 | 25 |
| Roblox.com | 278 | 189 | 221 | 29 | 21 | 27 |
| Popads.com | 210 | 178 | 192 | 21 | 11 | 18 |
| Cnn.com | 316 | 135 | 219 | 87 | 28 | 67 |
| Name of the Website | Sharable web pages | |||||
| Category 1 | Category 2 | |||||
| Max | Min | Median | Max | Min | Median | |
| Amazon.com | 6 | 4 | 4 | 2 | 0 | 2 |
| Blogspost.com | 4 | 2 | 4 | 2 | 0 | 2 |
| Microsoftonline.com | 6 | 4 | 4 | 4 | 0 | 2 |
| Ebay.com | 6 | 4 | 4 | 2 | 0 | 2 |
| Github.com | 4 | 2 | 2 | 2 | 0 | 2 |
| Imdb.com | 8 | 4 | 4 | 4 | 0 | 0 |
| office.com | 6 | 4 | 4 | 2 | 0 | 0 |
| stackoverflow.com | 8 | 4 | 4 | 4 | 0 | 0 |
| Fandom.com | 4 | 2 | 2 | 2 | 2 | 2 |
| wordpress.com | 6 | 4 | 4 | 4 | 2 | 2 |
| imgur.com | 4 | 2 | 4 | 2 | 1 | 1 |
| Apple.com | 6 | 4 | 2 | 2 | 0 | 0 |
| Adobe.com | 4 | 2 | 4 | 2 | 2 | 2 |
| Amazon.in | 6 | 2 | 2 | 4 | 0 | 2 |
| Quora.com | 6 | 4 | 4 | 2 | 0 | 2 |
| Bbc.com | 8 | 4 | 6 | 2 | 0 | 2 |
| Roblox.com | 6 | 2 | 4 | 4 | 1 | 2 |
| Popads.com | 8 | 4 | 2 | 2 | 1 | 1 |
| Cnn.com | 6 | 2 | 4 | 2 | 1 | 1 |
The overall result is represented in Tables 8 – Table 10. We show a total of the six features here while we further show the number of times category 1 (5 most visited pages) exceeds category 2 (5 less visited pages) for the twenty websites and six features. The results are shown for three months. We can see that category 1 leads over category 2 in all features.
| Feature | The maximum value of both categories in three months | |||||
| Sep 2021 | Oct 2021 | Nov 2021 | ||||
| Category 1 | Category 2 | Category 1 | Category 2 | Category 1 | Category 2 | |
| Accessibility of the web pages | 20 | 0 | 20 | 0 | 20 | 0 |
| Influence of a web page in a web site | 19 | 1 | 20 | 0 | 20 | 0 |
| Images of the webpage | 15 | 5 | 16 | 4 | 18 | 2 |
| Texts of the webpage | 16 | 4 | 16 | 4 | 17 | 3 |
| User interactions of the web pages | 18 | 2 | 17 | 3 | 17 | 3 |
| Sharable web pages | 19 | 1 | 17 | 3 | 19 | 1 |
| Feature | The minimum value of both categories in three months period | |||||
| Sep 2021 | Oct 2021 | Nov 2021 | ||||
| Category 1 | Category 2 | Category 1 | Category 2 | Category 1 | Category 2 | |
| Accessibility of the web pages | 20 | 0 | 20 | 0 | 20 | 0 |
| Influence of a web page in a web site | 19 | 1 | 20 | 0 | 20 | 0 |
| Images of the webpage | 15 | 5 | 16 | 4 | 18 | 2 |
| Texts of the webpage | 16 | 4 | 16 | 4 | 17 | 3 |
| User interactions of the web pages | 18 | 2 | 17 | 3 | 17 | 3 |
| Sharable web pages | 19 | 1 | 17 | 3 | 19 | 1 |
| Feature | The median value of both categories in three months period | |||||
| Sep 2021 | Oct 2021 | Nov 2021 | ||||
| Category 1 | Category 2 | Category 1 | Category 2 | Category 1 | Category 2 | |
| Accessibility of the web pages | 20 | 0 | 20 | 0 | 20 | 0 |
| Influence of a web page in a web site | 19 | 1 | 20 | 0 | 20 | 0 |
| Images of the webpage | 15 | 5 | 16 | 4 | 18 | 2 |
| Texts of the webpage | 16 | 4 | 16 | 4 | 17 | 3 |
| User interactions of the web pages | 18 | 2 | 17 | 3 | 17 | 3 |
| Sharable web pages | 19 | 1 | 17 | 3 | 19 | 1 |
After the case study and analysis of the results, we find the proposed factors can influence the web pages' importance value:
Accessibility of the web pages: This is based on the landing page of the website and the tabs available on the site. The landing page is technically the home page. Accessibility in this case, therefore, means that all the web pages that are accessible by one click from the landing page or the home page are more accessible than the pages that are accessible by two or more clicks from the home page.
Influence of a web page on a website: Besides the accessibility of the web pages, we also observe that the web page that has more links and that can be accessed from more web pages has more influence on web users. Because the user comes to that page to visit the related web pages. In that case, the page views will be increased.
Content of the Web pages: Text or information, images, and videos are referred to as content of the web pages. The page that contains more of this is considered more important.
Interacting Web pages: Interactive web pages which require user input and show different outputs for different users by utilizing their inputs are as well considered to be more important.
Shareable Web pages: This is in association with social media platforms, where some web pages contain links to social media platforms and their usability is clearly stated.
III. RELATED WORK
We examine the research work related to our study in this section; our work is related to web mining, which can be categorized into three active research areas depending on what components of web data are mined. The first one is Content Mining which is the process of extracting relevant information from the content of websites. The next one is Structure Mining which uses links and references within web pages. After analyzing that, It can obtain the underlying topology of the interconnections between web objects. The final one is usage mining which studies user access information from log server data. Our paper is based on website structure mining. However, our research uses structure mining to predict user behaviors. Hence, we include research work related to both mining topics.
Multazim et al. [2015] analyze whether classified ads can increase search engine rankings and increase the number of visitors to a website. They note that "Firefox" and "Google Chrome" are the most popular search engines. Hence, their study is based on ad's data generated by those search engines. They point out that posting and advertising are carried out by various auto-submit programs. They concluded that the installation of classified ad with 'Auto submit' increases the number of visitors.
Verma et al. [2015] make it clear that it is prudent for every organization to have a good website. Nonetheless, e-commerce is still in the developing stages in some countries such as India. They postulate that the challenging and dynamic needs of consumers are not satisfied in such countries where e-commerce is not well established. They make arguments based on research work that focuses on the design of a page ranking algorithm (SNEC). They explain that SNEC aids customers to search and compare products before purchasing. Finally, they recommend that business organizations need to structure their e-commerce websites to be more effective and usable.
Gleich et al. [2015] describe Google's PageRank method which evaluates the importance of web pages through their link structure.. They explain the process involved in determining the importance of web pages through various illustrations and mathematical formulae.
Khan et al. [2017] propose a new model, the popularity and productivity model (PPM). The model is based on a modular approach to finding the most influential bloggers. They describe in-depth the roles of the model's existing features and evaluate the proposed model by using data from real-world blogs., they validate that PMM identifies influential bloggers. They make use of performance evaluation measures for the comparative analysis.
Tamimi et al. [2015] present the results of an experiment in which participants view fictitious web pages. They postulate various conceptual methods that are involved. Their study indicates that star reviews and familiarity with e-tailor (e-Bay or Amazon) are the main attributes that influence an individual's likelihood of purchasing products online. They further claim that their results are consistent with findings of previous research (Kim et al. [2010], Stocks et al. [2011]).
They point out that while they encountered various limitations, their research can help to provide a more realistic task for a better comprehension of the attributes that have implications on consumers' decisions concerning the purchase of products online.
Zhen et al. [2016] combine the h-index and the PageRank algorithm. Their main aim is to find out the impact value of a publication. They construct the resulting PR-index for any publication by evaluating the popularity of the source as well as the source publication authority. Therefore they propose their method should be added to technical indices.
Fatehu et al. [2016] propose a two-stage supervised approach to suggest news articles to users for a given state of Wikipedia. Initially, they suggest news articles to Wikipedia entities (article-entity suggestions) relying on a rich set of features. Then they determine the exact section in the entity page for the input article (article-section placement) guided by class-based section templates. They perform an evaluation of their approach based on ground-truth data that is extracted from external references in Wikipedia.
Zhen et al. [2017] observe that while there are many hypertext links on the web, only a few are clicked regularly. Based on this observation, they make use of mixed-effects hurdle models supplemented with descriptive insights and find out user preferences involved in clicking links on the web. They adopt the PageRank algorithm in their study. They utilize o large-scale data sets from Wikipedia (English version only) for their experiment. They conclude that Wikipedia users have a preference for navigating to articles that are in the periphery of the Wikipedia link network, compared to semantically similar articles, and to articles that are linked at the top of the left-hand side of the source article.
Thomas et al. [2019] research work is highly related to our research work. A research model was created with the use of a stimulus-organism-response (S-O-R) model (S.W. Khun et al. [2018]) to explicate how the social commerce features affect the website attention (stickiness) through ideas about cognitive and emotional factors. The meaning of the word "Website stickiness" entails the amount of attention received by a website from its users.
E-commerce websites will find this very useful to their operations. Originating from environmental psychology, the S-O-R model postulates that certain stimulus affects the cognitive and emotional states of an individual; this then informs the individual's response or behavior.
Based on the S-O-R model, the cognitive and emotional states of the individuals facilitate a stimulus and response relationship. In the field of e-commerce, the S-O-R model has been widely tested by several studies to note how particular web features like stimuli (e.g., pictures, product descriptions, navigation aids) can influence consumers' responses like buying behavior. Their research model is assessed in a controlled online experiment with 164 participants using e-commerce website variants with different social commerce feature richness levels. It was indicated in their results that cognitive and affective dynamics affect feature richness positively, thereby increasing a website's stickiness. The result further concludes that e-commerce websites can be enhanced with a combination of functionally varied social commerce features.
Unfortunately, they only work with high-level (abstract) issues of the website such as; user satisfaction, the usefulness of the websites, how users trust to share their data on websites etc. For validating this they design four versions of a website and take user responses on these issues.
The high-level issues are varied from user to user. They take responses from a total of 212 participants and use the responses of 164 participants in their work (as 164 participants give an acceptable response) but it is still a very low number of users. Ultimately, this work fails to produce any guidance which would be meaningful to web designers or programmers. This is a key objective of our work.
To review the above-related work, we observe that, for finding the importance of web pages the previous research works on user navigation patterns, cookie information or other private data. Therefore, there are two significant problems with the previous research in this field. The first one is to collect user data. The second one is the use of previous data to find the solutions based on past user behaviors. So, most of the previous research work considers an old dataset of the website. For instance, suppose a new web page called "Donate Now" is included in a website for any incident. At that time that web page may attract more visitors but as the model learns from the previous dataset where the "Donate Now" link is not available, it would not be shown as the most visited page. So the previous works fail to decide in real-time and algorithms cannot quickly adapt to maintenance changes on an ongoing basis. In our work, we design a model according to the website structure. So, our work can give real-time predictions without using any private data of users and automatically adapts to maintenance changes. To our best knowledge, this is the first-ever work that can analyze the effectiveness of a web page by only analyzing the structure of the web pages.
IV. METHODOLOGY
We have constructed an extension for web browsers. For this, we access the web pages' content and find the features by analyzing that content and page URL. These features are the input of our proposed system. Then for each web page, we find the importance value by using the page view results that were generated by "Google Analytics" and "SimilarWeb". We use this page view results to train our model and use the CatBoost Machine Learning (Liudmila et. al. [2010]) system to produce the final importance metric. Finally, based on the metric, we rank the web pages on the scale of "Best," "Good," "Average" and "Poor." It is hoped that this procedure is straightforward enough, to make it accessible to most web site designers without requiring them to learn additional technology.
4.1 Feature Extraction
The information extracted from web pages and used as features are: i) what is the minimum number of clicks to visit those pages from the Homepage? ii) What is the number of images, texts, videos, links and scripts of the web pages? iii) How is a web page connected with other web pages on the website? iv) Are there any interactions with the users on the web pages? The establishment of these features is based upon the case study presented in Section 2. In this section, we discuss our methodology to extract these features from the web pages.
4.1.1 What Is the Minimum Number of Clicks to Visit a Web Page
For finding the minimum number of clicks, we first extract the site map of the website using the method used by Brawer et al. [2017]. Starting with the "home" page, we get the all links that can be accessible and save them on the site map. Then we prune all the duplicate entries and increase the value of a minimum number of clicks. After that, we repeat these steps until there is no child found in the DOM Tree. Finally, when there is no child in the DOM tree, we find the site map of the websites with the minimum number of clicks. In our proposed method we use the ease of web pages' accessibility from a website. Therefore, after finding the minimum number of clicks, we find the easiness of the accessibility value of web pages (E) using; E = D - C, Where D is the Maximum depth of a Tree and C is the minimum number of clicks.
4.1.2 What Is the Number of Images, Texts, Videos, Links and Scripts on the Web Pages
We extract the DOM structure of a page and identify a summary of the content: (1) the number of images, (2) the number of videos, (3) the number of links on the web page, (4) the amount of text (in words) and (5) the number of scripts on that page.
4.1.3 How Is a Web Page Connected With Other Web Pages on the Website
We produce an undirected graph for the web pages which represents the connectivity of all the pages on a website. Using this graph, we calculate the Eigen vector centrality for each of the nodes. (Here nodes mean the URLs of the website.) We use the adjacency matrix to find the Eigen vector centrality. For any vertex, v the relative Eigen Vector Centrality x can be defined as:
Where, is the adjacency matrix ( , if there is an edge between the vertex v and t), M(v) is the set of neighbors of vertex, v and is a constant.
4.1.4 Are there any interactions with the users on the web pages
", "", "" elements of the page. Before that, we collect keywords that are used for "Login," Signup," "Share on Facebook," Share onTweeter," "Share on Google Plus," "Checkout". We collect these keywords by analyzing the Alexa top 400 websites. For this analysis, we only consider the home page of each website (Table 11). If we find these keywords within the tag elements, we infer that there is an interaction with the users.
| Keyword | Frequency | Keyword | Frequency | Keyword | Frequency |
| Log In | 82 | submit | 24 | Share on Facebook | 15 |
| Logon | 17 | Login | 102 | Share on Tweeter | 12 |
| Log | 11 | tweet | 18 | Share | 45 |
| Sign In | 82 | 28 | Login Scope | 18 | |
| Signin | 27 | googleplus | 15 | Share on Google | 14 |
| Signup | 9 | checkout | 6 | join | 32 |
| Sign up | 31 | check out | 17 | register | 56 |
4.2 CatBoost Learning to Rank the Web Pages
Dealing with categorical features efficiently is one of the biggest challenges in machine learning. The most widely used technique to deal with categorical predictors is one-hot-encoding. The original feature is removed and a new binary variable is added for each category. Another way of dealing with categorical features is to use the so-called label-encoding technique that converts discrete categories into numerical features.
Beyond these approaches, CatBoost (Liudmila et. al. [2010]) is a specialized version of Gradient Boosting Decision Trees (GBDT), which solves problems with ordered features while also supporting categorical features. It uses a technique where the trees included in the model are not independent but sequential. In other words, each predictor learns and improves from the mistakes and errors of the previous tree. In the end, all of the trees or predictors are combined to form the model but with non-uniform weights. Each tree is constructed by the following steps: 1) splitting calculations, ii) transformation of categorical data to numerical data, iii) construction of the tree, and, iv) computation of the values in the leaf nodes.
After the first split is selected on the tree, the same step is repeated for the next split only with a condition of 'given the first split'. The same step is repeated with a similar condition until the whole tree is constructed. The model constructed includes a tree whose leaf values provide a score which is our output — importance values. The score is further taken as input to classify itself as a rank. To categorize these values as one of the ranks, we break the range (output range from importance value) into four subranges (to decide what category a specific result falls under). (Using the ElbowMethod (Trupti et al. [2013]) estimates that k = 4 is the optimal partitioning). Further, to explain the subranges and the categories, the range in which the page is most likely to attract an audience and publicize or perform best is categorized as BEST, the one that draws a little less attention is named GOOD, the one that occasionally gets views is AVERAGE and the one that get rare or no audience at all is categorized as POOR.
V. RESULTS & EVALUATION
For evaluating our results, we generate two sorts of datasets. The first one has been generated from the "Google Analytics" results for the "Online Book Review" website (https://www.Onlinebook sreview.com/). we obtain server access to this website, for twelve weeks. The study follows best practices in maintaining users' anonymity and privacy, hence no unique information can be reported, we obtained access between July 2019 and September 2019. We used the first eight weeks' data as the training set; and the last four weeks' data as live data. Besides this, we also generate a second dataset using "SimilarWeb." We choose Five Hundred websites from "Alexa" and generate datasets using the "SimilarWeb." We use the first four hundred websites as the training dataset and the rest One Hundred as the live dataset. Then we show the results, and the importance values generated by our system. After that, we represent three case studies; at first one we represent how our system can extract the features from the web page, we represent four different pages for which our system generates the four different scores; "Poor", "Average", "Good" and "Best" according to their value and importance, in last one we show a case study on the web page "Contact Us" (https://www.onlinebooksreview.com/contact) of the web site "Online Book Review". We make four versions of it and show how this page can achieve more views by adopting our proposed system's suggestions. Finally, we represent two types of validity experiments to prove the effectiveness of our system; Internal and external.
5.1 Dataset Visualization
We use a total of 8 datasets in our research. We define the datasets as "Dataset 1" to "Dataset 8". The first 3 datasets (Datasets 1 to 3) are based on the web pages of the website "Online Book Review". Dataset 1 contains the data for September 2021; Dataset 2 contains the data for October 2021, and Dataset 3 contains the data for November 2021. There are a total of 239 web pages on the "Online Book Review" website; however, we select 100 web pages from them. We discard pages that are similar (such as "Articles on Programming"). In that case, we select one web page from each group. The combination of Datasets 1 and 2 is used as the training set, and Dataset 3 is used as testing. Figure 3 shows the "Number of views" results from the "Google Analytics" for each Dataset.
{"image_source":{"path":"images/46650e3e39c587c5adcc3240b51fa7c477ffe5459a246596c0645967cd9be2a2.jpg"},"content":"","chart_caption":[{"type":"text","content":"Dataset 1"}],"chart_footnote":[]} {"image_source":{"path":"images/d4f59558f576c24e5aa49658f6cb02e61980d941a508d642186032076e5899b1.jpg"},"content":"","chart_caption":[],"chart_footnote":[{"type":"text","content":"Dataset 2"}]}
{"image_source":{"path":"images/eeec25be9e6b3828f6699f59a0f94aefe8e2a119454fd285bd155d5b660c171f.jpg"},"content":"","chart_caption":[],"chart_footnote":[{"type":"text","content":"Dataset 3"}]}
Figure 3: Dataset Produced from "Online Books Review" Website
We also evaluate our work on the 500 popular websites ranked by "Alexa." We take the top 656 websites and remove 156 websites from the list.
There are two reasons behind that. The first one is some of the websites do not meet the criteria defined in the case study section (We delete 97 websites from the list for this reason). As an example, "Google.ca" is very different from the other websites. We consider websites with more user interaction. The second reason behind that is, that we need the number of views of any specific web pages to train our model. We use "SimilarWeb" to collect these "page views" as we don't have server access to the websites.
Therefore, we select web pages for which "SimilarWeb" can generate these results. For 59 websites from the top 656 websites of Alexa, "SimilarWeb" fails to produce results; therefore, we discard them from the list. So after cleaning the websites dataset, we include 5 datasets; naming them "Dataset 4" to "Dataset 8", where Dataset 4 to Dataset 7 are used for training and Dataset 8 is used for testing. We have 489 web pages in Dataset 4, 540 in Dataset 5, 639 on Dataset 6, 659 on Dataset 7, and 611 in Dataset 8.
Therefore, we have a total of 2,938 web pages in the dataset where 2327 web pages are used as training for our model and 611 web pages are used as testing. In figure 4 we represent for each site the number of pages we consider in our system.
{"image_source":{"path":"images/3bbd05e3d9b899f6b303079dd52a8735570ac3de6818633b442abff12437cc23.jpg"},"content":"","chart_caption":[],"chart_footnote":[]} {"image_source":{"path":"images/8b8c7d1e9bbd4078d81c8bc6ff1a3075d1ebb323054dd948e86129a47a009f78.jpg"},"content":"","chart_caption":[{"type":"text","content":"Dataset 4"}],"chart_footnote":[]}
{"image_source":{"path":"images/33c86bff0a0b1d4dc969c2bacac53929d1b5387875953d60e30bb99c4ae91f30.jpg"},"content":"","chart_caption":[{"type":"text","content":"Dataset 5"}],"chart_footnote":[{"type":"text","content":"Dataset 6"}]} {"image_source":{"path":"images/319dec61cad6f60dbd516c3039c3e2df7d3e4f36644b8e1b698f4638672788a3.jpg"},"content":"","chart_caption":[],"chart_footnote":[]}
{"image_source":{"path":"images/7312e870072dce4a3941121828a1b1615bfbf16a3596d67b2ddcfeb5d32f498a.jpg"},"content":"","chart_caption":[{"type":"text","content":"Dataset 7"}],"chart_footnote":[{"type":"text","content":"Dataset 8"}]}
Figure 4: Datasets Produced from Alexa Top 500 w=Web Sites
5.2 Experimental Results
Figure 5 shows the page views from "Google Analytics" versus the Importance Value produced by our system (Note that page views from "Google Analytics" are represented as values.). The data shows potential clustering of the pages, "Terms of Services" had no Importance, while, as expected, "Home" page was mostly visited, and hence the most important. It is observable that different types of Posts, Articles and Categories pages possessed higher Importance Values (I.V.).
The values of I.V. correlate significantly with the page views from "Google Analytics" (r=0.79;
). Applying a ranking of the page's procedure for both the page views from "Google Analytics" and Importance Value demonstrates a significant rank correlation . This provides important evidence that the Importance Value is performing similar to other analytic tools.
{"image_source":{"path":"images/617044a932f3b40f483069274d5ede5b915ab249af6f61a749e3ab9bb85facdd.jpg"},"content":"","chart_caption":[{"type":"text","content":"Figure 5: Page Views from "Google Analytics" Versus the Importance Value Produced by Our System"}],"chart_footnote":[]}
5.3 Case Study
In this section, our proposed work focuses on three case studies. We also use another different website (University of Alberta) for this purpose rather than "Online Book Review" website. The reason for selecting this website is because of the vast amount of work that can be carried out here which gives us sufficient data to analyze.
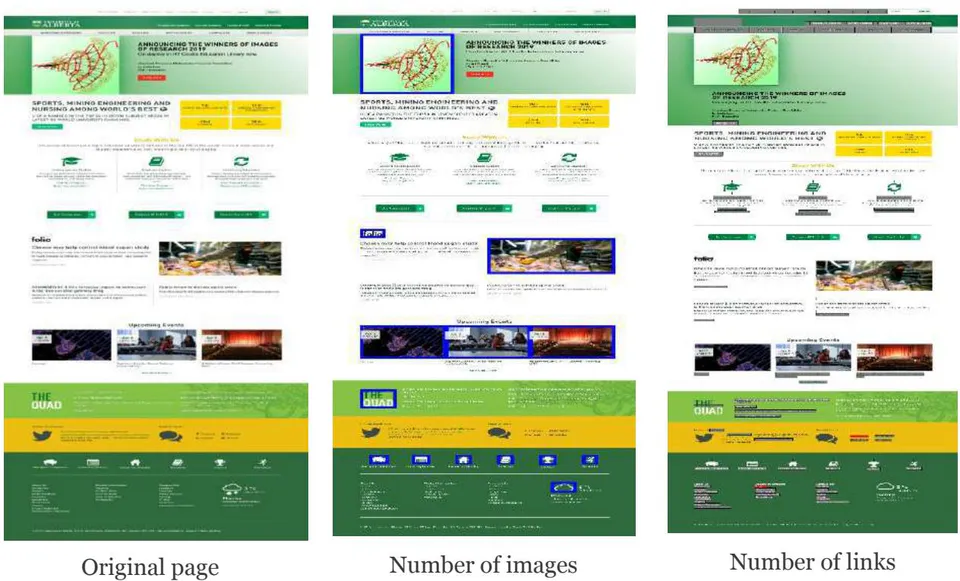
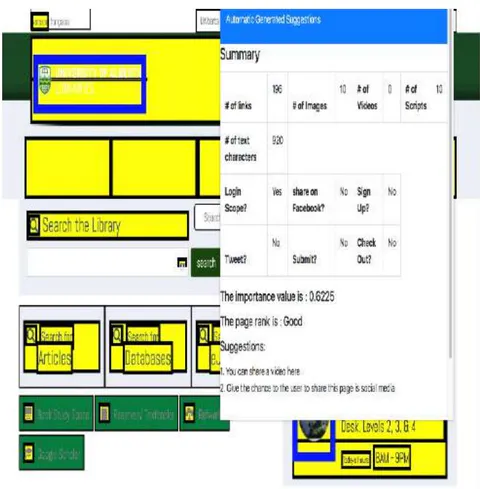
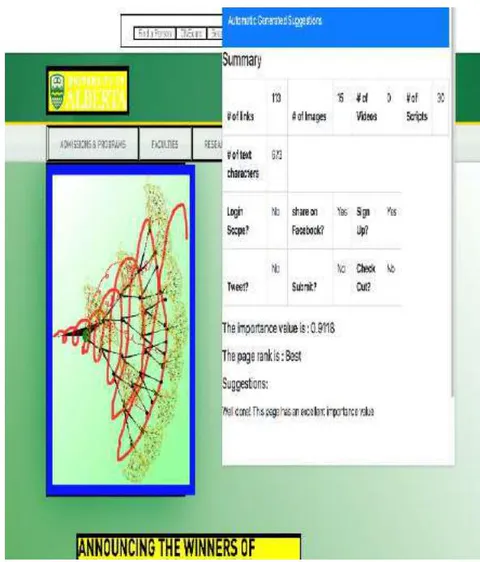
Case Study-I: In Case-I, we show how our proposed system can extract the website contents.
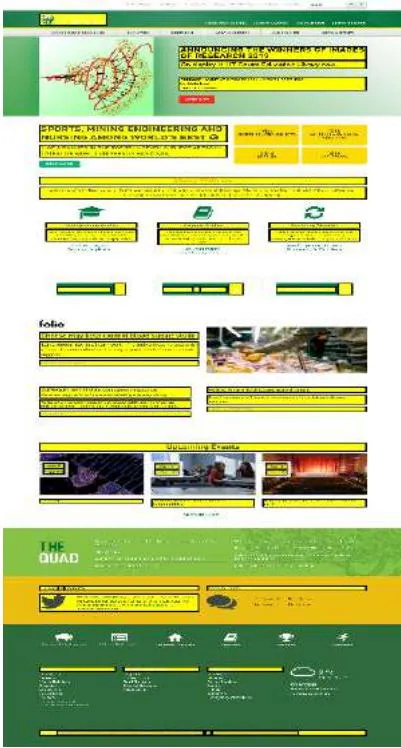
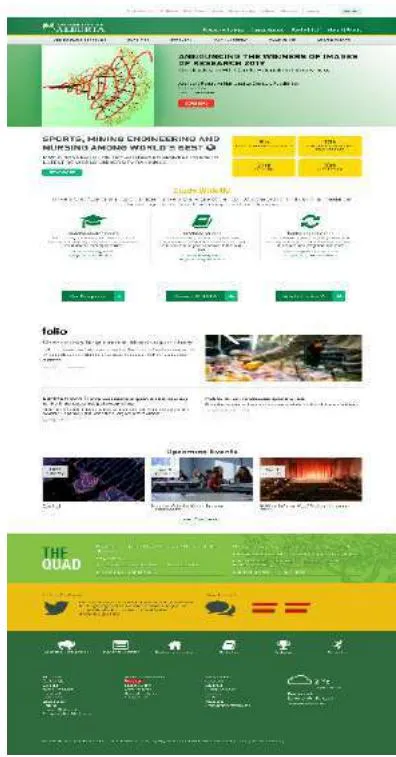
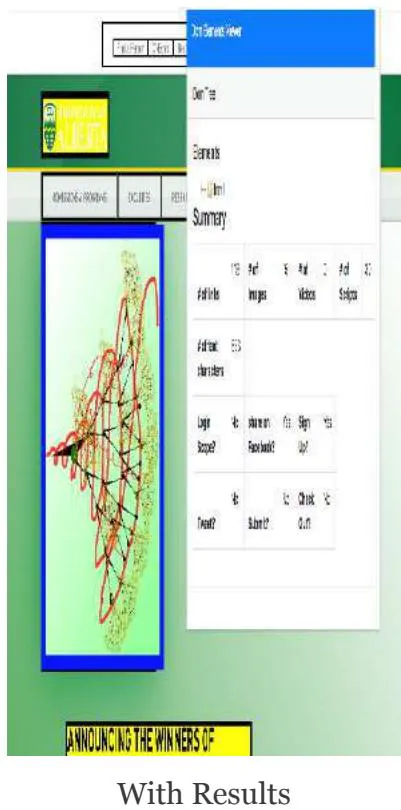
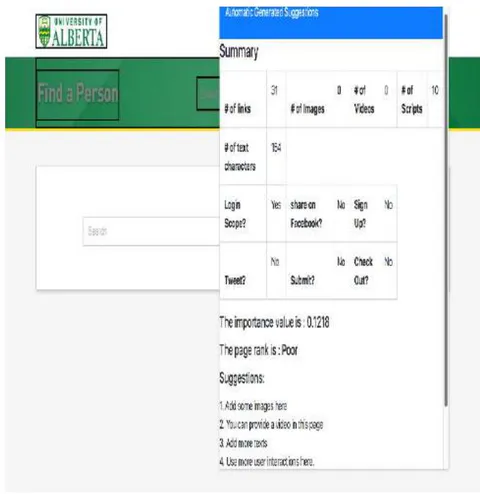
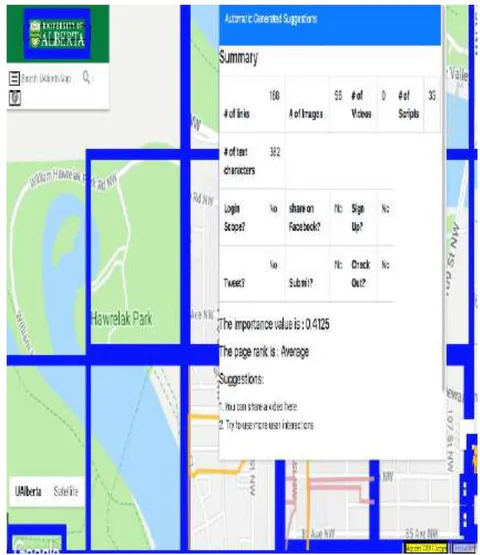
In figure 6(a) we represent the screenshot of the home pages of the Alberta website. In Figures 6(b) to 6(f) we represent the results. We represent images in 6(b), links in 6(c), and texts in 6(d). In figure 6(e) we show the integrations. From the figure, we see that this page has a scope of registrations, sharable on "Facebook", "LinkedIn", and "YouTube". Finally, in figure 6(f) we represent the total results in the extension window.
Case Study-III: A case study is also conducted on Online Book Review website. "Contact us" page(https://www.onlinebooksreview.com/contact) is chosen for this case study. 4 web pages version are made. The webpages are then updated in these four versions. Figure 8 denotes the four versions.
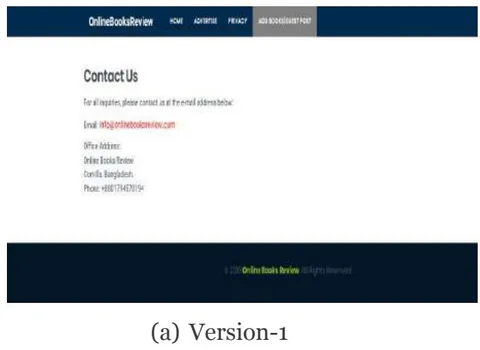
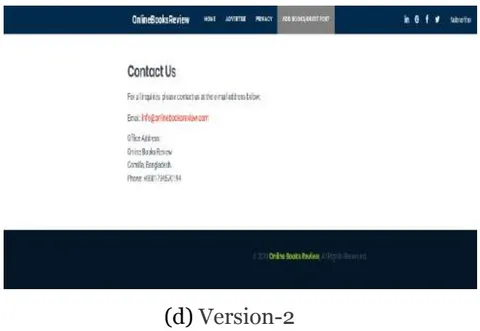
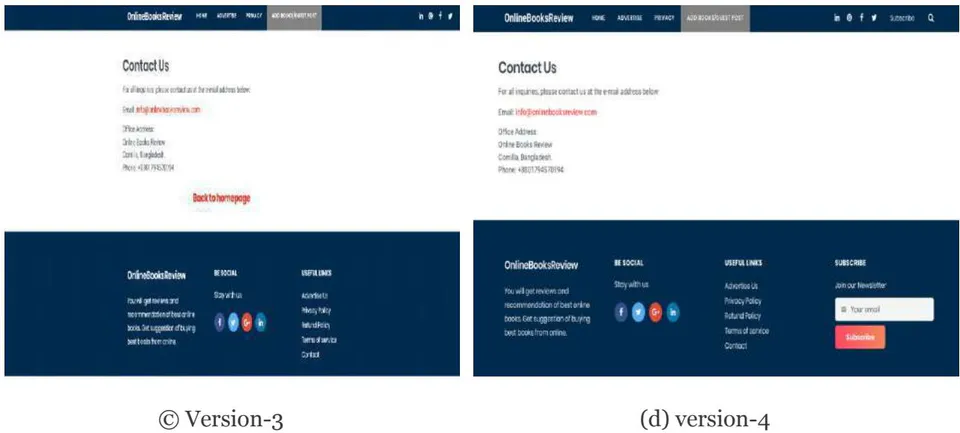
The case study result is shown in Table 12. We can view the four versions of the features. Also, when we made the "contact us" page more interactive, there is an increase in the page views. So, this case study shows the effectiveness of our work.
| Features | Version number | |||
| 1 | 2 | 3 | 4 | |
| Header with basic information only | yes | Yes | Yes | Yes |
| Header with a sharable link in social media | No | Yes | Yes | Yes |
| Header with subscribe option | No | Yes | No | Yes |
| Body with basic information only | Yes | Yes | Yes | Yes |
| Body with a back link to home page | No | No | Yes | No |
| Footer with more links only | No | No | Yes | Yes |
| Footer with a subscribe option with a mail address | No | No | No | Yes |
| Number of page views (according to "Google Analytics") | 5 | 9 | 22 | 25 |
5.4 Validation of Results
For validation of our work, we use two types of validity; internal and external. In internal validity, we use the confusion matrix to represent the results, and for external validity, we use the correlation matrices; Pearson and Spearman.
5.4.1 Internal Validity
For internal validity, we represent our results in a confusion matrix. To find the internal validity we checked through all 2,938 web pages manually for their features. We extract the source code of all the 2,938 web pages and then check manually all the features and compare them with the automated generated results. We discovered how our system can find out the images, texts, videos, links, and user interactions efficiently. There are two basic measures used in evaluating the performance of these strategies. They are Precision and Recall. The recall is the ratio of the number of relevant records retrieved to the total number of relevant records in the database. It is usually expressed as a percentage. On the other hand, Precision is the ratio of the number of relevant records retrieved to the total number of irrelevant and relevant records retrieved. We also made use of four other parameters for more accurate analysis and to determine Accuracy, Detection and False Alarm for the extracted content. The parameters are:
True Positive (TP): The number of pages in which our system discovers where login scope truly exists.
True Negative (TN): The number of pages in which our system does not find the login scope where login scope truly exists.
False Positive (FP): The number of pages in which our system finds the login scope where login scope does not exist.
False Negative (FN): The number of pages in which our system does not find the login scope where login scope does not exist.
Here we give the example on the basis of finding the login scopes in a web page. We follow the same parameters for finding the images, videos, links etc. Then measure the Accuracy, Precision and Recall based on this result. We represent the results for both cases in table 13 to table 17. In the evaluation process at first, we go through each page manually at their source code and see how many images, texts, links, etc. are there. Then we compare these results with our automated generated system. In Dataset 1 to Dataset 3, we use the same web pages. So in each table, we represent the results of the 3 Datasets together.
There are 100 pages in the 3 Datasets, and their design is not changed in the 3 months. So we represent the results together. For Dataset 4 to Dataset 8 we also represent the results in a confusion matrix. From the tables, we observe that our system can successfully extract the web pages' contents.
| TP | FP | TN | FN | Accuracy | Precision | Recall | ||
| Online Book review | Dataset 1- Dataset 3 | 248 | 6 | 4 | 3 | 96.55% | 0.9763 | 0.9841 |
| Websites from Alexa | Dataset 4 | 1613 | 21 | 32 | 1 | 0.9682 | 0.9805 | 0.9871 |
| Dataset 5 | 2808 | 23 | 18 | 1 | 0.9933 | 0.9936 | 0.9918 | |
| Dataset 6 | 1342 | 11 | 16 | 2 | 0.9868 | 0.9882 | 0.9918 | |
| Dataset 7 | 3493 | 21 | 29 | 4 | 0.9906 | 0.9917 | 0.9940 | |
| Dataset 8 | 1833 | 12 | 31 | 0 | 0.9834 | 0.9833 | 0.9934 |
| TP | FP | TN | FN | Accuracy | Precision | Recall | ||
| Online Book review | Dataset 1- Dataset 3 | 8 | 0 | 1 | 96 | 99.04% | 0.8889 | 1 |
| Websites from Alexa | Dataset 4 | 13 | 0 | 0 | 481 | 100% | 1 | 1 |
| Dataset 5 | 16 | 0 | 1 | 530 | 99.81% | 0.9411 | 1 | |
| Dataset 6 | 18 | 0 | 0 | 633 | 100% | 1 | 1 | |
| Dataset 7 | 16 | 0 | 0 | 648 | 100% | 1 | 1 | |
| Dataset 8 | 12 | 0 | 1 | 589 | 99.04% | 0.8889 | 1 |
| TP | FP | TN | FN | Accuracy | Precision | Recall | ||
| Online Book review | Dataset 1- Dataset 3 | 422 | 11 | 5 | 9 | 96.42% | 0.9882 | 0.9745 |
| Websites from Alexa | Dataset 4 | 3182 | 54 | 24 | 44 | 97.63% | 0.9925 | 0.9833 |
| Dataset 5 | 3672 | 402 | 27 | 49 | 89.66% | 0.9927 | 0.9013 | |
| Dataset 6 | 4473 | 490 | 32 | 56 | 89.66% | 0.9928 | 0.9012 | |
| Dataset 7 | 3823 | 417 | 34 | 62 | 89.59% | 0.9911 | 0.9016 | |
| Dataset 8 | 3178 | 348 | 22 | 55 | 96.42% | 0.9882 | 0.9745 |
| TP | FP | TN | FN | Accuracy | Precision | Recall | ||
| Online Book review | Dataset 1- Dataset 3 | 8665 | 256 | 11 | 9 | 97.01% | 0.9987 | 0.9713 |
| Websites from Alexa | Dataset 4 | 42380 | 1220 | 42 | 51 | 97.11% | 0.9990 | 0.9720 |
| Dataset 5 | 46990 | 1311 | 49 | 62 | 97.19% | 0.9989 | 0.9728 | |
| Dataset 6 | 55602 | 1492 | 58 | 58 | 97.29% | 0.9989 | 0.9738 | |
| Dataset 7 | 57419 | 1598 | 61 | 65 | 97.19% | 0.9989 | 0.9729 | |
| Dataset 8 | 54235 | 1482 | 51 | 56 | 97.01% | 0.9987 | 0.9713 |
| TP | FP | TN | FN | Accuracy | Precision | Recall | ||
| Online Book review | Dataset 1- Dataset 3 | 398 | 5 | 2 | 0 | 98.27% | 0.995 | 0.9875 |
| Websites from Alexa | Dataset 4 | 1908 | 28 | 482 | 11 | 79% | 0.7983 | 0.9855 |
| Dataset 5 | 2112 | 45 | 392 | 17 | 82.96% | 0.8434 | 0.9791 | |
| Dataset 6 | 2710 | 62 | 401 | 29 | 85.54% | 0.8711 | 0.9776 | |
| Dataset 7 | 2882 | 82 | 445 | 21 | 84.63% | 0.8662 | 0.9723 | |
| Dataset 8 | 2502 | 39 | 312 | 31 | 87.82% | 0.8891 | 0.9846 |
4.2 External Validity
For representing the external validity, we use the two types of the correlation coefficient: Pearson and Spearman. We find the correlation among pairs of variables; the first one is the importance score produced automatically by our proposed system and the second variable is the "page views" results collected from the "Google Analytics" and "SimilarWeb." We use the Dataset 3 and Dataset 8 results to represent the correlation as they are used in our proposed system as testing. Pearson Correlation Coefficient is represented by r, which originally stood for regression. It is a parametric statistical measure of the strength of a linear relationship between two continuous variables. A relationship is linear when a change in one variable is associated with a proportional change in the other variable. Pearson Correlation Coefficient examines the variables concerning their deviations from the mean. On the other hand, Spearman's rank correlation coefficient is a nonparametric rank statistic proposed as a measure of the strength of the association between two variables. It is a measure of a monotone association that is used when the distribution of data makes Pearson's correlation coefficient undesirable or misleading. It assesses how well an arbitrary monotonic function can describe the relationship between two variables, without making any assumptions about the frequency distribution of the variables. Unlike the Pearson correlation coefficient, the Spearman correlation coefficient does not require the assumption that the relationship between the variables is linear, nor does it require the variables to be measured on interval scales; it can be used for variables measured at the ordinal level. However, the sign of the correlation tells something about the behavior of the two variables; the absolute value of the correlation indicates how strong the relationship is between these variables. A correlation of 1.0 is a perfect positive correlation, meaning that the two variables move upward or downward together. A correlation of -1.0 is a perfect negative correlation, meaning that the two variables move in opposite directions. The closer the correlation is to 1.0 or -1.0, the stronger the relationship between the two variables. The sign only determines the direction, positive or negative, and it does not influence the strength of the correlation. When there is no linear correlation between the variables, the value of the correlation coefficient would be 0.
{"image_source":{"path":"images/4db5460c7766d0ee9d1b1bcf270126b9990fbdd642e0890c282eea17d4052c00.jpg"},"content":"","chart_caption":[{"type":"text","content":"a) The Pearson Correlation"}],"chart_footnote":[]} {"image_source":{"path":"images/68b293c416432d0071f850b327bc6802ef490d91eb078167e215fc5ca3cbed06.jpg"},"content":"","chart_caption":[{"type":"text","content":"b) The Spearman Correlation"}],"chart_footnote":[]}
{"image_source":{"path":"images/b28665260e22fefdcddbb9dba05658b269f63a2a2c1091f536793df90d4c2674.jpg"},"content":"","chart_caption":[{"type":"text","content":"Figure 9: the Correlation Among Pairs of Variables in Our Proposed System's Score and "Google Analytics" Page View"},{"type":"text","content":"London Journal of Engineering Research"},{"type":"text","content":"a) The Pearson Correlation"}],"chart_footnote":[]} {"image_source":{"path":"images/1f7979302b7eb3017007560cce1d4db5897b8893717b40670dbc2a7967742120.jpg"},"content":"","chart_caption":[{"type":"text","content":"b) The Spearman Correlation"},{"type":"text","content":"Figure 10: The Correlation Among Pairs of Variables in Our Proposed System's Score and "Similarweb" Page View"}],"chart_footnote":[]}
We use both cases (The website of "Online Book Review" and the Top websites from "Alexa") for finding external validity. In the case of "Online Book Review" website, we consider the "page view data from the "Google Analytics" for four weeks of December 2021. Suppose for the first web page, we first produce the importance value automatically. According to our system, the importance value will not change in four weeks as the website design is not changed. So we select four different values of page views collected from "Google Analytics" and four unchanged values automatically generated from our proposed system. After that, we use this data to find the Spearman and Pearson Correlation coefficient. In this way, we go through the remaining 99 web pages and generate the correlation values. Figure 9(a) represents the Pearson Correlation coefficient, and Figure 9(b) represents the Spearman Correlation coefficients for the "Online Book Review" websites. Estimation of Pearson correlation coefficients denoted strong correspondence between variables. The values varied between 0.78 and 0.92, with a mean of 0.85. On the other hand, estimation done applying Spearman correlation evidenced a strong correlation between variables. This statistical parameter varied from 0.81 to 0.9. On average its value was 0.85. So our system can find the importance value of "Online Book Review" website successfully. In the case of top websites from "Alexa" we use Dataset 8 where we also find 100 websites. For each website, we generate the importance value of the web pages automatically and then use the results of "SimilarWeb" to compare. In this way, we generate for 100 websites and represent the Pearson Correlation in Figure 10(a) and Spearman in Figure 10(b). In the case of Person Correlation, the correspondence between variables is calculated between 0.62 and 0.75. Association between the variables, expressed by average correlation was 0.67. Spearman coefficients values are estimated as not less than 0.65. The average correspondence between analyzed variables is 0.74. The maximal correlation identified is 0.82. So we can conclude that our system can generate similar results to that of "Google Analytics" and "SimilarWeb."
5.5 State-of-the-art
The research carried out by Thomas et al. [2019] is similar to our research. An experimental study was carried out to assess social commerce's impact on website features in their research. Four versions of a website were created and they use for testing purposes. The feature of the fourth version is richer than the other three versions tested. Below are a few comparative studies between our work and that of Thomas et al. [2019].
- The website's high-level issue was worked on by Thomas et. al. [2019]. This issue varies for different users. Some of the issues considered include:
1. Perceived satisfaction
2. Perceived usefulness
3. Trust
4. Operation checks items.
These issues are varied on the website to view users' responses to increasing or reduction. The responses are recorded with a "Yes", "No" or "Unsure". The numbers of clicks, page views per user and time spent were also recorded. However, our model focuses more on the website's low-level features to observe the responses of users to changes in features. Therefore, our research encompasses almost all website features.
In Thomas et. Al. [2019] experiments, 4 website version was used namely "zero", "low", "medium" and "high" versions. The richness of each feature was in ascending order from zero level to high version. In our work, we chose the selected Alexa top 500 websites from the top 656 websites while the "Online Book Review" website was also considered since we have access to its server.
They receive 212 participants' feedback with a significant number of them 164 were used and some were discarded. Likewise, we also keep track of web page users' responses through data generated from "SimilarWeb" and "Alexa". For instance, "SimilarWeb" was able to track about 1 Million Amazon website users. This gives us a robust amount of real-time participants.
VI. SUMMARY & CONCLUSION
Web applications have infiltrated almost every aspect of our daily life. Research shows that 93% of online shopping starts from websites search. Therefore, to capture the online marketplace places the advertisement provider needs to know the right place to set up their ad so that most of the website users can see their ad. There are lots of web applications available capable of fulfilling this purpose but most of them use web users' private data. So, when users close their browser cookies information the web applications won't be able to get accurate results. The main highlight and fascinating aspect of our work are that it works on the website structure to predict the importance of the web page. It consists of two very helpful features for both web developers and advertisement providers.
In the case of an Advertisement provider, our proposed system can show the importance score alongside the web pages' rank so that they can take a quick decision to include their advertisement in real-time. No user private data is needed.
In the case of web developers that sometimes publish their trial version and later use feedback gotten from the users to update their web application. Our system can give them real-time suggestions with the importance score so they can design a better website in the development period.
For solving the problem, we extract the features from web pages in real-time and use CatBoost Machine learning to create the rank. We do not only use the web pages' contents (such as the number of images, number of videos, number of links, number of texts, etc.) but we also use the web page accessibility and connectivity with other web pages. To validate our work, we use two types of datasets; one is collected from the server of the "Online Book Review" website and another we prepare from the most popular 500 websites from Alexa. We represent our effectiveness in the format of case studies, confusion matrix and correlation coefficient. In all formats, our good results prove the effectiveness of our proposed system.
Conflict of Interest
The authors declare no conflict of interest.
Ethical Approval
Not applicable
Data Availability
The datasets used in this study are openly available at [repository link] and the source code is available on GitHub at [GitHub link].
Funding
This work did not receive any external funding.
References
Cite this article
Related Research


Special Issue
Launch a focused special issue to highlight research, emerging trends, and expert insights in your academic field.