



IntelliPaper
Abstract
Paraffin scale deposition poses a significant challenge in various industries, including oil and gas production, where it leads to reduced operational efficiency and increased maintenance costs. This study focuses on the utilization of off-the-shelf household candle wax to simulate typical oilfield paraffin scale deposits and, simultaneously, to characterize them in order to gain deeper insights into their chemical, and compositional properties in relation to typical oilfield paraffin scale deposits. Controlled laboratory experiments were conducted to mimic paraffin scale deposition under conditions resembling those encountered in production systems. The deposition process was monitored and chemically characterized using advanced analytical techniques, such as Fourier-transform infrared spectroscopy (FTIR) and nuclear magnetic resonance (NMR) spectroscopy. This analysis provided valuable information about the molecular composition of the deposits, including the types of paraffin involved and the presence of other organic and inorganic compounds. In conclusion, mimicking and characterizing the simulated paraffin scale deposits provide valuable insights into their behaviour and composition, shedding light on factors influencing paraffin deposition preservation. This knowledge is critical for the development of tailored solutions to mitigate or remove paraffin scale-related challenges, ultimately leading to improved operational efficiency and reduced economic impact across various industries.
Explore Digital Article Text
I. INTRODUCTION
Paraffin scale deposition is a pervasive and persistent challenge across various industries, with a particularly pronounced impact on the oil and gas sector. The accumulation of paraffin wax deposits in production systems poses a significant threat to operational efficiency and cost-effectiveness. These deposits, often resembling the stubborn build-up of candle wax on a holder, can lead to reduced flow rates, increased energy consumption, and elevated maintenance .
Consequently, Scale deposition (paraffin scale deposits) remain the biggest stumbling block for both flow assurance and energy security till date ([1], [2], [3]). In spite of significant investments in terms of both financial resources and time dedicated to addressing the issue of scale deposits, no single solution has proven universally effective for all types of scale deposits [23]. Additionally, these solutions have not consistently met the criteria of being economically viable, time-efficient, user-friendly, and safe for both rig completion and personnel, as well as environmentally friendly [24]. Accordingly, treatment options have often been limited to aggressive chemical solutions, such as the use of acids as inhibitors and dissolver ([8], [13], [22]), as well as destructive mechanical techniques like explosives, cutters, and mills [4].
In some cases, complete rig workovers have been necessary, including tubing replacement, or production has been deferred . These challenges are primarily attributed to inadequate planning and the failure to incorporate effective scale management strategies (prevention) into the asset life cycle management of a field during the capital expenditure (capex) phase . This lack of proactive planning has led to increased removal and inhibition costs during the operational expenditure (Opex) phase of field development . Notwithstanding, scale deposition can occur either before the deployment of inhibition measures or at the end of the inhibition treatment life . This often leaves operating companies with no choice but to react with emergency removal responses, resulting in confrontational approaches to scale management.
In an attempt to unravel this enigma, this paper embarks on a journey to mimic and characterize typical oilfield paraffin scale deposits using a novel approach - the utilization of off-the-shelf household candle wax. Through controlled laboratory experiments, we endeavour to simulate the conditions and processes leading to paraffin scale deposition, closely mirroring the challenges faced in real-world oil and gas production environments [25]. The choice of household candle wax as a surrogate material for mimicking oilfield paraffin scale deposits is an intriguing one. While seemingly mundane, [26] believes candle wax shares fundamental compositional similarities with the paraffin wax compounds found in crude oil. Both consist primarily of long-chain saturated hydrocarbons, with the former representing a simplified model system for the latter.
This innovative approach offers several research advantages like the accessibility of household candle wax been readily available and affordable, making it a cost-effective alternative to using authentic oilfield paraffin wax for experimental purposes. This accessibility as mentioned by facilitates wider and more diverse research efforts. In addition to controlled experiments advantages of candle wax enables precise control over the experimental parameters, allowing researchers to isolate and manipulate specific variables to gain deeper insights into paraffin deposition mechanisms . So also, safety in terms of candle wax been non-toxic and poses minimal environmental hazards, making it a safer option for laboratory studies compared to working with authentic oilfield paraffin wax.
In addition to the aforementioned advantages, the intricate interplay of factors influencing real oil field paraffin deposition preservation (sample extraction, transportation, etc.) presents a complex puzzle [6] that has long confounded researchers and engineers alike: Thereby, significantly reducing impact and equity of the experimental outcomes and results as a result of factor such as: First and famous temperature fluctuations due to atmospheric conditions that can cause wax to change states, transitioning between solid and liquid phases as scholarly particularized by [21] that Paraffin deposits typically form at lower temperatures, and abrupt increases in temperature during an experiment can lead to the dissolution of wax, affecting the reproducibility and accuracy of results. Secondly, is oxidation as a result of exposure to oxygen in the atmosphere that can trigger the oxidation of both the oil and the wax. This chemical reaction can alter the properties of the wax and make it more resistant to deposition [28]. Thus researchers must carefully consider the potential effects of oxidation on the wax's behaviour and characteristics. Thirdly, is contaminants challenge as a result of atmospheric conditions that expose the wax to various contaminants such as dust, particulate matter, and other airborne impurities [17]. These contaminants can interact with the wax, affecting its properties and potentially accelerating or altering deposition processes.
Fourthly, is the challenges of moisture introduced by atmospheric conditions that can interact with both the wax and the oil . Water can change the physical and chemical properties of both substances, leading to unintended outcomes in the experiment. Fifthly, is UV exposure If the experiments are conducted outdoors or under natural light, exposure to ultraviolet (UV) radiation can impact the wax's stability and properties . UV exposure can cause photo degradation, which can result in alterations to the wax's molecular structure, further complicating the mimicking process. The sixth challenge as itemised in is related to wind and airflow that can significantly influence the distribution of wax deposits during experiments. These factors may cause uneven deposition and affect the repeatability and consistency of results, necessitating careful consideration and control.
The seventh challenge includes collecting and analysing samples under atmospheric conditions that can introduce errors and inaccuracies . Researchers must meticulously plan their sampling and analysis procedures to minimize such issues and ensure data reliability. Finally, is the duration of experiments knowing that in real oilfields, wax deposition occurs over extended periods, often years . Hence experiments conducted in atmospheric conditions may not fully replicate the long-term deposition processes.
Researchers must consider the duration of their experiments and potential deviations from real-world scenarios.
Therefore, by acknowledging and addressing these challenges, we can better navigate the intricate path towards understanding paraffin scale deposits. The utilization of off-the-shelf household candle wax as a proxy material represents a creative and pragmatic approach to conducting controlled experiments that closely mirror the conditions encountered in the oil and gas industry . Through this innovative research endeavour, we aim to shed light on the behaviour, composition, and preservation factors influencing paraffin deposition, ultimately paving the way for the development of tailored solutions to mitigate or remove paraffin scale-related challenges. These solutions hold the promise of improved operational efficiency and reduced economic impact across various industries, from oil and gas production to beyond.
II. METHODOLOGY
The methodology for this technical paper is structured into two phases: Phase one, which focuses on Paraffin Scale Deposit Mimicking, and Phase two, titled "Characterization of the produced paraffin scale replica. Each phase consists of specific stages to systematically replicate and characterize paraffin scale deposits for research and analysis. This comprehensive methodology ensures that the paraffin scale deposits produced and characterized using household candle wax are systematically replicated and thoroughly analysed, providing valuable insights into their properties and behaviour for research and practical applications in the oil and gas industry.
2.1 Phase 1: Paraffin Scale Deposit Mimicking
This phase concentrate on mimicking to simulates the oil type paraffin deposit using house hold candles in stage two after designing and construction of the scale fabrication moulder in stage one for the replication.
2.1.1 Stage 1: Wax Moulder Design
Solid Works software was utilized to craft a multi-purpose holder capable of transforming between a hollow and a solid form, specifically designed for the preparation of wax scale samples. The design was first developed in separate components and subsequently assembled. The choice of material for the mould was made with the consideration of its ability to endure the wax's melting temperature. You can refer to : Appendix A:15 and A:16 for comprehensive 2D and 3D design drawings created using SolidWorks, along with images depicting the individual components of the mould and the fully assembled mould for both solid and hollow shapes, as illustrated in Figure 2.1
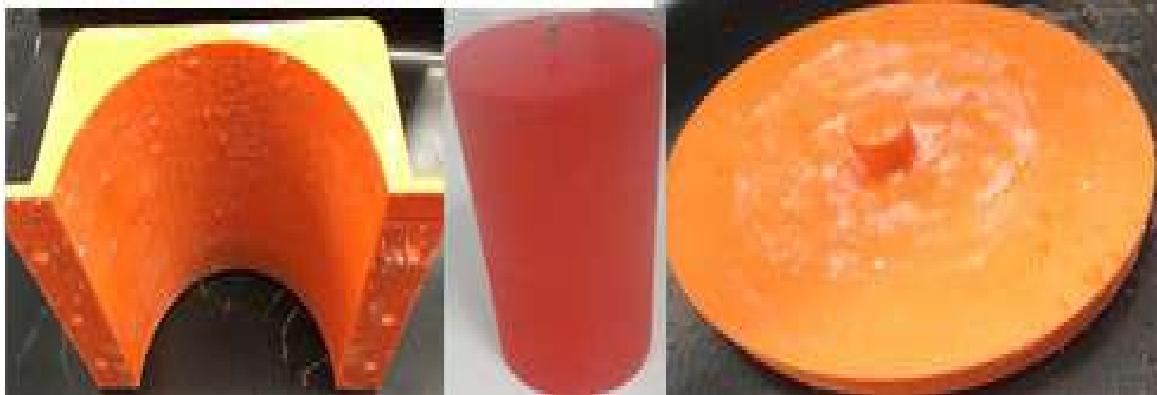
(a): Wax Moulder Components
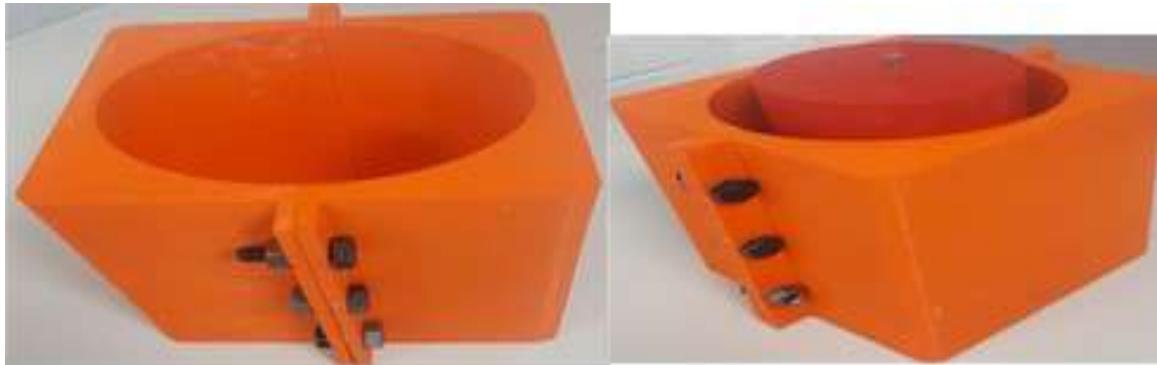
(b): Assembled Wax Moulders Figure 2.1: Pictures of Wax Molder (a) Component and (b) Assembled[23]
2.1.2 Stage 2: Wax Scale Preparation
To prepare the wax scale sample, household candles, with a similar low API gravity to paraffin, were utilized. The candles were cut into pieces and melted, then carefully embedded into the appropriately designed moulder to achieve the desired shapes. The fully assembled moulder produces a 150mm outside diameter and a 110mm inner diameter (20mm thickness) hollow wax sample, simulating the early-stage growth of scale in production tubing before complete blockage. Removing the centre component of the moulder results in a 150mm diameter solid sample with a 40mm thickness, simulating complete tubing blockage. The production process is as follows as it schematically shown in Figure 2.2
-
Household candles were cut into smaller pieces and placed in a metal baking pan.
-
The pan was put in an oven and set to C.
-
The melted wax was carefully removed from the oven and allowed to cool and solidify slightly to reduce the risk of slippage when poured into the moulder.
-
The melted wax was poured from the metal baking pan into the desired scale moulder.
-
The wax was allowed to cool and solidify in the desired shape before removal from the mould.
-
Each sample was marked with a reference number on both sides and weighed.
-
Individual sample details were recorded in the scale identification register.
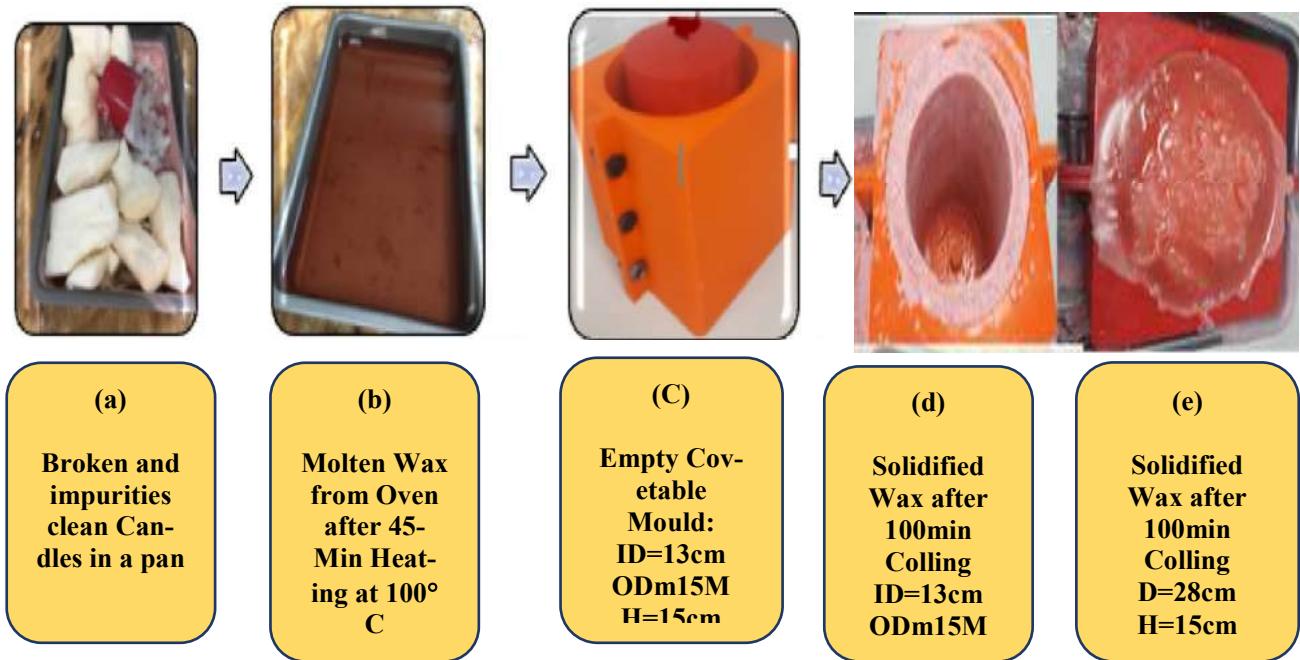
Figure 2.2: Constructed wax scale samples preparation Procedure
2.1.3 Stage: 3 Colling Curve Taste
To ensure that the fabricated scale samples were representative of typical oil field paraffin scales, a cooling curve matching test was performed on the molten waxes. The testing materials and apparatus were molten wax and long probe waterproof digital thermometer, respectively. The validation test involved obtaining the cooling curve for the wax samples and matching it with established cooling curves of typical oil field paraffin waxes. Consistency of the freezing points of the samples versus typical oilfield paraffin waxes was used as the quality indicator. Key steps of the validation test included the following.
a) More than 75% of the thermometer probe was inserted into the molten wax, and the device was switched on.
b) The thermometer was held steady in the above position until temperature readings stabilized.
c) The temperature at that stage was taken and recorded.
d) The above three steps were repeated at two minutes' intervals until the wax solidified.
2.2 Phase 2: Characterization of Produced Paraffin Scale Deposit
The manufactured soft scale samples of various dimensions and configurations, as described in
Section 2.1.1, under went through NMR and FTIR analyses. These analyses aimed to ascertain whether they exhibited chemical properties consistent with the paraffin scale deposits typically encountered in petroleum production tubing. Figure 3.1 illustrates the fabricated soft scale samples, displaying (a) solid shapes and (b) hollow, respectively.
2.2.1 Stage 2: Chemical and Compositional Analysis
To determine the molecular composition of the deposits, the following techniques were employed:
2.2.2 Fourier-Transform Infrared Spectroscopy (FTIR)
A Thermo Scientific Nicolet iS10 Fourier-transform infrared spectroscopy (FTIR) was utilized in analysing and identifying the chemical substance, functional group in the compound of the constructed wax samples as per the working mechanism and experimental set-up in Figure 4.17 [23] using the following procedures.
-
Started by logging in to the OMNIC software windows in the FTIR analyzer dedicated computer system and select the smart FITR Diamond ATR accessory
-
The system drop window was properly clean with propanol and a lab tissue paper.
-
Then the ATR was screwed against the sample holder until a click sound is heard.
-
The 'Col BKg 'was clicked on the software menu for sample background 'run' and generate background spectrum at the completion of 36 scans while monitoring the status bar
-
A small piece of the wax deposit (as in Figure 3.1) was please on the sample holder and the ATR is screwed against the sample until a click sound is heard.
-
The sample spectra were then obtained by clicking the 'Col Smp' button with 36 scan background collection as required.
-
The Selection of the peak of interest was done by putting ON the 'Analze' menu and changing the axis absorbance to transmittance and the general spectra were replaced with the new specific spectra.
-
The paraffin spectra were selected from the national institute of standard and technology (NIST) through the FTIR data base and superimposed against the wax scale spectra for comparison.
-
Step 6 to 7 were repeated for liquid paraffin analysis after pouring small quantity on the sample drop and properly screwing the ATR screw.
-
The liquid paraffin spectra generated results were superimposed with the generated wax sample spectra for comparison.
2.2.3 Nuclear Magnetic Resonance (NMR) Spectroscopy:
NMR spectroscopy was employed to provide insights into the molecular structure and composition (both aliphatic and aromatic) of the constructed wax deposits as per elaborated in the Figure 4.18 of [23] including set-up, working mechanism and procedure.
1. 10mg of starting material was used to clean the tube
-
The crushed wax sample was dissolved in 0.7Ml of deuterated solvent (CDCL in this case) as 4.5-5 cm is recommended as a suitable high of solvent for good spectrums
-
The NMR tube is carefully cap and the sample name is written on it.
-
The sample was gently shaken to ensure effective dissolving of the sample and precaution were taken to avoid contaminating the sample due to solvent cap contact.
-
The spinner and the NMR tube were clean with 2 propanol and lab tissue to wipe out all dirt and fingerprints
-
The NMR tube was gently inserted into the spinner and the spinner automatically rotate into the magnet to ensure the whole sample experience a homogenous magnetic field. The spinner is placed in a sample gauge to prevent the bottom of the NMR tube from sitting far into the NMR probe to reduce the risk of damaging the spectrometer as each probe has its own sample depth.
-
The sample was placed into the NMR spectrometer and a Varian 400 MHz spectrometer equipped with an auto-sampler was utilized
-
The spectrums were processed, and peak were assigned in the spectrum.
III. RESULT AND DISCUSSIONS
Findings from the chemical and compositional analysis of the constructed wax scale samples using NMR and FTIR techniques as elaborated in Section 2.2.3 & 2.2.4 are detailed in the two coming Sections (3.3.1 and 3.3.2) respectively
3.1 Fabrication of Paraffin Wax Deposit
The constructed soft scale samples of different sizes and shapes from Section 4.3.2 of and 4.3.2 of [23] that were subjected to, NMR and FTIR analysis determine their true representation of typical oilfield paraffin deposit are showcase in Figure 3.1 Were (a) solid shape represent complete tubing blockage scenario and (b) hollow shapes represent early paraffin deposition stage respectively.
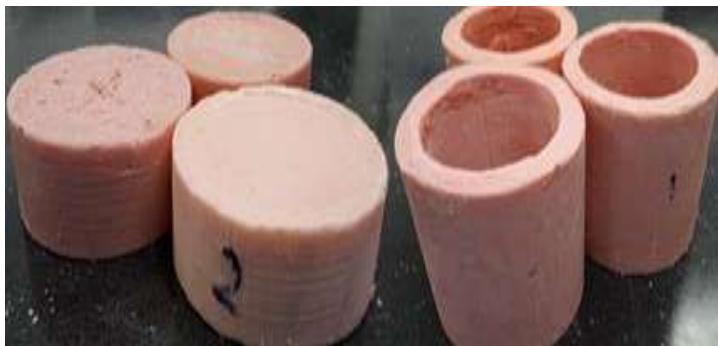 Figure 3: SEQ Figure:_3. * ARABIC 1 Constructed Soft Scale (a) Solid Shaped, (b) Hollow Shape Samples [23]
3.2 Colling Curve Result
A temperature-versus-time graph was created from to represent the cooling process. The cooling pattern and freezing point of the wax sample we made were assessed in comparison to published paraffin cooling curves using both qualitative and quantitative methods. Samples that did not meet these established criteria were not accepted.
{"image_source":{"path":"images/e454fd9374d63352a9d63100d830668fe3a71541340112c15906f817da5b851f.jpg"},"content":"","chart_caption":[{"type":"text","content":"Figure 3.2: Comparison of Cooling Curves of the Scale Samples Against Those of Known Paraffin Waxes [24]"}],"chart_footnote":[]}
3.3 Chemical/compositional Analysis
The outcome and findings of the experiment from the chemical and compositional analysis of the constructed soft scale samples using NMR and FTIR techniques are as follows:
3.3.1 NMR Analysis of Soft Scale Sample
As in Section 2.2.3, we explain how nuclear magnetic resonance spectroscopy was employed to examine the chemical properties of typical oil field scale deposits (paraffin) within the created soft scale samples. The 1H NMR spectra in Figure 3.3 demonstrate the existence of olefinic protons within the range of ppm to ppm, which are characteristic of hydrogens found in CH, CH2, and CH3 groups. This particular peak range aligns with what has been reported in the literature [19]. The singlet at ppm is designated for TMS (tetramethylsilane) and primarily serves as a calibration point. The singlet peak at the far end ( ppm) is attributed to the deuterated chloroform (CDCl3) solvent utilized for dissolving the sample. The distinct signals in the spectra validate the presence of saturated hydrocarbons (peaks in the upfield), and no peaks were observed in the aromatic region of the spectra within the range of ppm to ppm.
{"image_source":{"path":"images/ea5850491d96916c95d225eb65d93fc91a14896a40ba424aa006df9cf47deac7.jpg"},"content":"","chart_caption":[{"type":"text","content":"Figure 3.3: NMR Result of Constructed Wax Scale Sample [23]"}],"chart_footnote":[]}
3.3.2 Infrared Analysis of Soft Scale Sample
The synthesized wax scale deposit underwent additional analysis using Infrared spectroscopy to validate the NMR findings and ensure its chemical representation of the oil field scale deposit (paraffin). As described in Section 2.2.4 of the methodology chapter, the results obtained from the Thermo Scientific Nicolet iS10 for the prepared wax sample were confirmed. These results were compared to archived database in the system, which included paraffin flakes, and they appeared to share similar functional groups, as depicted in Figure 3.4. Both spectra aligned by exhibiting analogous fingerprint patterns and bands characteristic of paraffin's functional groups.
Moreover, in Figure 3.4 of the FT-IR analysis, the absorption peaks observed between 2900 cm-1 and 2800 cm-1 were attributed to the stretching and vibrations of CH2 and CH3 groups, affirming the presence of aliphatic paraffin in the sample, consistent with findings by [16]. These absorption peaks also corresponded with those found in the National Institute of Standards and Technology (NIST) database of FT-IR spectra.
{"image_source":{"path":"images/20c3bb185b1825c867b142cbbbb1320025a9b4043227dcdd45c6812f0ca9fc07.jpg"},"content":"","chart_caption":[{"type":"text","content":"Figure 3.4: Infrared Analysis Result Compared to Paraffin Flakes From NIST Data Base [23]"}],"chart_footnote":[]}
Likewise, to ensure additional validation and confirmation, the spectra of the soft wax sample were overlaid and contrasted with the outcomes of the liquid paraffin confirmatory test, elaborated upon in Section 2.2.4 and displayed in Figure 3.5 In this comparison, it was evident that both the spectrum of the soft wax and the liquid paraffin exhibited identical peaks and bands characteristic of the same paraffin functional groups.
{"image_source":{"path":"images/fa438eb5ce9608c0d0343fd86bb74758ec622593a9d23ad5cddef3eff369bdad.jpg"},"content":"","chart_caption":[{"type":"text","content":"Figure 3.5: Infrared Analysis Result Compared to Liquid Paraffin [23]"}],"chart_footnote":[]}
VI. CONCLUSION
Taken in to consideration the aforementioned preservative and atmospheric challenges that might affect the accuracy and relevance of the experimental results. The constructed wax deposit as shown in Figure 3.1 proven to have striking some meaningful balance between the utilised controlled laboratory conditions and real- oilfield scenario from the series of compositional and chemical analysis outcomes established in Figure 3.2, 3.3, 3.4. and 3.5 respectively.
ACKNOWLEDGEMENTS
This research would not have been possible with out the support of the Sparay Research group of the University of Salford. Also, more importantly Petroleum Trust Development Fund (PTDF) Nigeria for financing the research.
Conflict of Interest
The authors declare no conflict of interest.
Ethical Approval
Not applicable
Data Availability
The datasets used in this study are openly available at [repository link] and the source code is available on GitHub at [GitHub link].
Funding
This work did not receive any external funding.
References
Cite this article
Related Research


Special Issue
Launch a focused special issue to highlight research, emerging trends, and expert insights in your academic field.
