





IntelliPaper
Abstract
An abnormal groundwater level in the slope was observed in 2016. This abnormal level was caused by the leakage and rupture of water pipelines connecting pressurized concrete towers. Electronic wells can be used for water level observation. In the present study, three locations were selected for the new installation of such wells. Big data analysis revealed that the rate at which the groundwater level decreases has a stratified nature. Even if it is not possible to verify whether the saturation state. Generally, the relationship between rainfall and groundwater level can be used to select the linear segment of the groundwater level decline rate close to the saturation state, with a similar rate range observed across an entire given layer. Changes in the displacement of the WS-066 slope soil layer accumulate toward the surface with rate stratification, with additional slope stratification related to rock fall, rock quality designation, and suspected oblique slopes. In addition, rate stratification is related to the engineering factors of the location.
Explore Digital Article Text
Preface
Research Background and Development Review
This study focuses on the survey and observation of a dip slope in Wenshan District, Taipei City. The WS-066 dip slope, originally a hillside, was developed. Geological profiles after development show a maximum soil layer thickness of approximately . Following a shallow erosion and landslide caused by heavy rainfall on June 18, 2012, electronic water level gauges and rain gauges were installed along the slope's mid-section. The electronic water level measurement recorded one reading per hour. Due to anomalies detected during groundwater level monitoring, slope reinforcement and the construction of two dewater catch sumps were carried out. The groundwater levels observed at the manual observation wells WS-002-S01 and WS-002-S05 remained high (Figure 1, sections and III). It was not until the pressurization pipeline incident on October 5, 2016, that an abnormal change was detected by the electronic water level gauge WS-066-EOW3 (Figure 1, section II), revealing the abnormal groundwater level on slope WS-066. The main cause was the leakage and rupture of the pressurization pipeline (Figure 2 shows the abnormal groundwater level observed when the water pipeline leaked and ruptured).
After the construction of the drainage well (Figure 1, IV), it can be observed that both artificial and electronic groundwater levels show a downward trend, and the leakage water from the underground pipeline gradually decreases from the high water level. The distance between the surface water seepage point of the 2016/10/5 pressurization pipeline and the downhill direction WS-066-EOW3 is about . On the day of the observation, the groundwater head difference changed from the highest GL-1.0 m to the lowest GL-6.0 m, a change of about . Since the construction of the drainage well (May 2014 to January 2015) was completed, the leakage water from the pressurization pipeline has been gradually and significantly discharged, without causing any slope instability. The relevant observation results were published in Wang R.Q. et al. (2021), “Water Quality Management and Disaster Prevention of Slope Inspection and Observation in Taipei City,” and Gao C.Z. et al. (2021), “Groundwater Monitoring Case of a Slope in Taipei City,” establishing groundwater level observation trends, judgment, and comparative feedback of precipitation function before and after drainage well treatment.
Continuous data from hourly electronic water level observations played a crucial role. Therefore, this study re-evaluated the installation effectiveness of electronic water level observation wells across three additional slopes. This study compiled electronic water level observation data from four slopes, summarized and discussed the stratification of groundwater level decline rate, and explored the geological potential and subsequent applications of the slopes.
Related Literature
Hsieh, P.C., and Wang, H.W. (2004) combined the results of soil slope permeability and rainfall. (1) For low-permeability soil slopes , rainwater infiltration is extremely slow, and rainfall has little impact on slope stability. (2) For medium-permeability soil slopes , due to rainfall exceeding permeability, the safety factor decreases after the simulation period ends. (3) For high-permeability soil slopes , the safety factor decreases rapidly. The paper also mentions that slope failure due to rainfall infiltration is divided into two stages: the first stage results in shear residual strength, and the second stage involves an increase in pore water pressure over a short simulation time.
Xu, S. M. et al. (2009), in their integration of different underground detection technologies in slope hydrogeological surveys using permeability tests, classifying them from the surface down as follows: colluvial layers , fractured rock masses , and fresh rock masses . The paper also pointed out that fractured rock masses are highly permeable due to fracture networks, indicating that the permeability coefficient is related to the geological characteristics of interconnected fractures.
The Geological Survey and Mining Management Agency, Ministry of Economic Affairs and the Water Resources Agency, MOEA have conducted hydrogeological surveys in the plains and hillsides of Taiwan for many years. The Geological Survey and Mining Management Agency’s website, “Taiwan Hydrogeological Information System,” provides numerous numerical results from in-situ permeability tests, with the aquifer permeability coefficient (K) generally ranging from .
Research Motivation and Purpose
The permeability coefficient or seepage is related to slope stability. The permeability coefficient in a slope is a three-dimensional seepage effect over time. The rate of change is related to hydrological and geological factors. After short-duration rainfall, the underground fissures in the drop section may not be saturated and are not collected. To account for the time range of change, the rate of groundwater level decline at saturation is more representative of permeability away from near-saturation. Although this state is not explicitly verified, the observed groundwater level change trend based on the cumulative hourly rainfall (over time) of a rainfall event at WS-094-EOW1 shows a near-horizontal line segment between the groundwater level rise phase I and the fall phase II. This suggests that the inflow and outflow of underground seepage are in equilibrium, and the underground fissures or pores may be approaching saturation equilibrium at this point. The similar groundwater level decline rates obtained from each stratum might indicate that the system is close to saturation. Nonetheless, this assumption requires further verification, such as drilling new holes next to the water level observation well to conduct on-site permeability tests, borehole photography, and downhole logging (geophysical) to find more direct geological evidence. The rate stratification remains related to hydrological and geological characteristics and has reference value. For example, the displacement observation trend of the WS-066 soil layer slope profile is related to the stratification.
Referring to the permeability coefficients from on-site hydraulic tests by Xu, S. M. et al. (2009) and the results from the Geological Survey and Mining Management Agency, this study compiled the groundwater level drop rates at four slope locations into strata. The first stratum has a drop rate of approximately or higher, while the second to fourth strata have drop rates of approximately . The rate of groundwater level decline is related to the permeability coefficient and can exhibit underground seepage characteristics.
Figure 3 shows the slope profiles of WS-066. Initial values for WS-002-S05 were established in January 2017, and initial values for WS-066-S04 were established in January 2021. As of July 2025, the maximum cumulative surface displacement was approximately . The observation results show that the cumulative soil displacement decreases with depth, and permeability gradually decreases. The displacement convergence depth is near the boundary between the second and third strata at a low drop rate .
The first layer of groundwater level decline rate in slopes WS-071 and WS-094 is highly permeable. Based on observation, rate stratification, topography, and hydrology, the first layer of WS-071 is also within a low RQD (Rock Quality Designation) rock cutting range, which should be more correlated with external forces of earthquake intensity level 4 or above (Taiwan). The first layer of WS-094 is at the same depth as the weathered rock cuttings and rock blocks in its borehole, suggesting it has the potential to cause rockfalls. In addition, the rate stratification may also indicate a relatively reduced planar sliding potential of the oblique slope, which deserves further investigation.
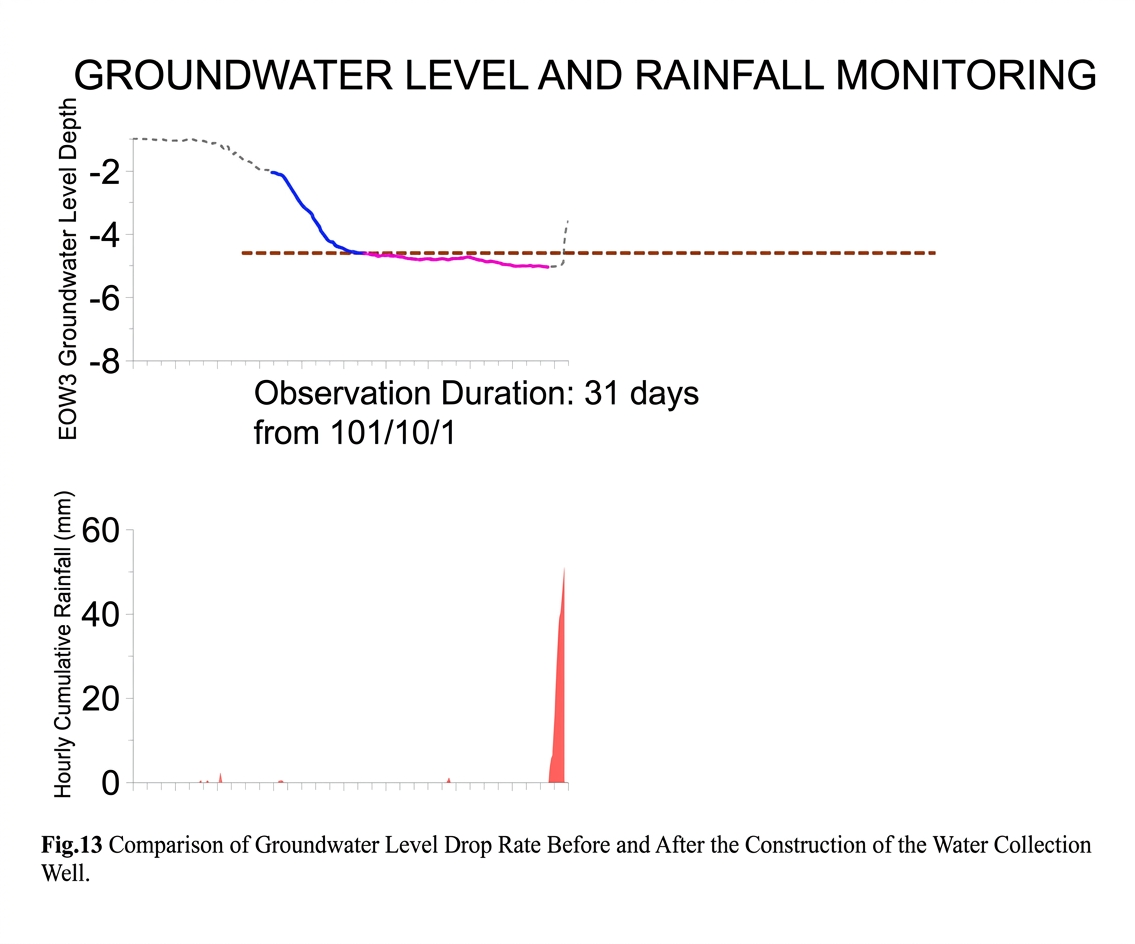
In the WS-066 case, the EOW3 drainage rate was significantly different before and after the construction of the drainage well, indicating that the drainage well performed its dewatering function. Before the construction of the drainage well, the groundwater level dropped at a rate of approximately (depth GL-2.2 to GL-4.8 m), and there was a high water level retention for more than 6 days before the drop. The shallow collapse on 2012/6/18 is speculated to be caused by the retention of a highly elevated water level and heavy rainfall. Eight years after completion, the rate at the same depth was approximately , but there was no significant high water level retention. The drop rate was significantly increased, and the drop rate also increased below depth GL-4.8 m, indicating that the drainage well performed its function of horizontal drainage.
The groundwater level drop rate and stratification of the three boreholes in the overlying soil profile of WS-066 slope showed differences. Among them, EOW2 and EOW3 were likely affected by subsequent on-site engineering activities (EOW2 was affected by incomplete soil compaction due to disturbance from nearby pipeline construction, and EOW3 was affected by the dewatering effect of the drainage well and horizontal drains).
This study yielded preliminary results for the stratified groundwater level decline rate at four slopes, which can be applied to assess potential geological hazards such as planar sliding or other collapses in the future, in order to prevent disasters from occurring.
Research Methods
In intact rock cores without joints or fissures, the permeability coefficient is very low. However, joints and fissures in the underground strata of slopes allow rainwater to seep into the rock mass. Each layer below the slope has a different lateral permeability. Thus, electronic water level observation at the slope is collected over one year. The correlation between groundwater levels was compared with local or nearby rainfall gauges. Stratification was performed based on a regular rate of decline, and layers with similar slopes were grouped together. The stratification result shows that the rate of groundwater level decline generally decreases with depth. The correlation between stratification and hydrology and geology was explored to understand the potential geological hazard. Note that the groundwater level in this study must be in a free aquifer; a mixed layer containing confined strata will affect stratification or is unsuitable.
Connect the vibrating wire electronic water pressure gauge to the #4 core wire. The total length, excluding the probe, leads to the recording box (VW-dot). The recording box contains a SIM and SD card device for easy communication setup and recording frequency adjustment. The power supply system uses a lithium battery (Model 18650). In this study, the groundwater level observation frequency is once per hour. The observation data from the recording box can be viewed or downloaded via the Internet of Things. The installation diagram of the VW-dot and electronic water pressure gauge is shown in Figure 4.
Taking “suspected oblique slope A (WS-032)” as an example, the changes in groundwater level after short-delay rainfall in electronic water level monitoring wells WS-032-EOW1 and WS-032-EOW2 are shown in Figure 5. The rapid rise in water level of WS-032-EOW1 and WS-032-EOW2 was and respectively, with slopes of and respectively. The pores in the rising stage are not yet saturated and are not suitable for stratification.
The slopes of WS-032-EOW1 are not significantly different in stages I-1 and II-2. In the descending stage III, the slope values (purple line) for WS-032-EOW1 and WS-032-EOW2 are and respectively. The groundwater seepage between the I and II boundaries is not yet at equilibrium and is not suitable for stratification. Although the rate differences can distinguish sections of the slope, it is not always meaningful. Figure 6 shows the preliminary stratification results of the drop rate at several selected locations in WS-032. It is also recommended to shorten the sampling frequency, for example to every 10 to 20 minutes.
Although the dip angle of the boundary between the first and second layers of WS-032 is not parallel to the apparent dip angle of the geological profile, the difference is not significant. However, the second layer of WS-032-EOW2 contains a thin layer with an even lower velocity. The boundary between the layers and the inclusion of the thin layer with an even lower velocity are suspected to be related to the characteristics of the oblique slope, which will be explained in detail later.
Stratification Results and Discussion of Groundwater Level Decline Rate
The four slopes in this study are numbered WS-032, WS-094, WS-071, and WS-066. Each slope analysis profile has two electronic water level monitoring wells. The stratification results and discussion are detailed below.
Suspected Oblique Slope A (WS-032)
This slope is located near Wansheng Street in Wenshan District. The strata are Taliao Formation sandstone and shale. Most of the outcrops are covered by vegetation. Two outcrops have been found so far. It is speculated that it may be an oblique slope. The apparent dip angle of the geological profile is about .
Stratification of Groundwater Level Decline Rate
Suspected Oblique Slope A (WS-032)
This slope has two electronic water level observation wells, each drilled to a depth of (see Figure 7). To avoid the influence of the free water layer on the possible confined sandstone and shale layers, WS-032-EOW1 is buried at a depth of and WS-032-EOW2 at a depth of . The area within the depth range of the two observation wells is mainly composed of Taliao formation sandstone. Based on the historical changes in groundwater level, the groundwater level with a regular rate of decline was selected, and the layers with similar slopes were divided into the same layer. The layers are summarized in Tables 1 and 2 and Figure 8.
Table 1: WS-032-EOW1 Groundwater level decline rate stratification
| Level | Sub-level | Depth range (m) | Decline rate (m/sec) |
|---|---|---|---|
| Layer 1 | EOW1 | GL-0.0 m – GL-3.68 m | |
| EOW1 | GL-3.68 m – GL-5.86 m | ||
| Layer 2 | EOW1 | GL-5.86 m – GL-8.5 m | |
| Layer 3 | EOW1 | GL-8.5 m |
Table 2: WS-032-EOW2 Groundwater level decline rate stratification
| Level | Sub-level | Depth range (m) | Decline rate (m/sec) |
|---|---|---|---|
| Layer 1 | EOW2 | GL-0.0 m – GL-1.35 m | |
| EOW2 | GL-1.35 m – GL-2.68 m | ||
| Layer 2 | EOW2 | GL-2.68 m – GL-5.37 m | |
| Low-permeability thin film | GL-4.4 m – GL-4.6 m | ||
| Layer 3 | EOW2 | GL-5.37 m |
Discussion of Stratified Results
The difference in the rate of descent between the two electronic water level observation wells in this slope is not significant. Therefore, connecting the boundaries of each layer yields the layered profile shown in Figure 8. The total thickness of the first and second layers of EOW1 is slightly higher than that of EOW2. The difference between the inclination angle of the layer boundary and the apparent inclination angle of the layer is not significant, which seems to be related to the characteristics of the oblique slope. In addition, a low-rate layer is sandwiched between the depths of GL-4.4 m to GL-4.6 m in the second layer of WS-032-EOW2, which may also be due to the oblique slope factor. Whether this slope is an oblique slope requires further confirmation with more information.
The permeability coefficient of the yellowish-brown sandstone core of WS-032-EOW2 at a depth of GL-4.55 m to GL-4.75 m, obtained from the laboratory, was approximately . According to laboratory analysis, the core is dense and without fractures, resulting in a low permeability coefficient. The groundwater level shows a regular rate of decline, decreasing from approximately to from the surface downwards. The rate of decline is stratified and related to the structural and weathering characteristics of the specific formations (Taliao and Nankang/Nangang). Weathering varies significantly in the same strata at different locations in Taiwan. For example, in a large-scale dihedral landslide near the northernmost highway of Taiwan, the sandstone within these formations was found to be loosely weathered and highly permeable, whereas dense layers exhibit much lower seepage rates. Due to the small sample size of borehole cores for each stratum in this study, quantitative comparisons of shale-to-sandstone ratios or fracture densities were not used. Nonetheless, the decline rate stratification is driven by the rock mass fracture factors; the highest rate occurs near the surface within well-connected fractures and weathered zones, and decreases with depth as joints become tighter and the rock matrix dominates, as verified by the dense, fracture-free core sample from GL-4.55 to GL-4.75 m.
Preliminary Exploration of Environmental Geological Potential
Residents near this slope have mentioned shallow erosion and landslides during Typhoon Nari’s devastation of Taipei. Old aerial photographs also show erosion and exposed soil. Currently, the highest groundwater level observed is approximately GL-3.68 m below the surface at WS-032-EOW1 and approximately GL-1.35 m below the surface at WS-032-EOW2. Initial values for the two inclined boreholes on this slope were established in September 2023, and no displacement trend was detected as of March 2026, suggesting a low potential for shallow soil and rock landslides. Most of the outcrops within the WS-032 area are covered by vegetation or soil, and only two nearby outcrops exhibiting oblique slope characteristics were identified. The stratification boundary estimated from the groundwater level drop rate has a slightly consistent trend with the apparent tilt angle of the suspected oblique slope. However, because the small number of outcrops limits direct confirmation, this interpretation remains speculative. To rigorously confirm the oblique shearing hypothesis and move beyond a suspected case, a higher evidentiary threshold is required, such as conducting detailed subsurface geophysical profiling, trenching, or drilling additional closely-spaced boreholes to map bedding planes and joint patterns. If these studies confirm oblique shearing and the rate stratification consistently aligns with these slope characteristics, the potential for planar sliding along the slope will be significantly reduced.
Dip Slope B (WS-094)
This slope is located at the mountainous area near Section 2 of Xiuming Road, Wenshan District. The lithology is mainly Nankang Formation sandstone. The borehole records show that within below the surface, there is weathered soil and broken rock blocks. From 1.8 to , there is yellowish-brown sandstone, and from 3.7 to , there is bluish-gray sandstone. There are two RQDs of about , and the rest are about to . The borehole core description is detailed in Figure 9. The WS-094-EOW1 electronic water level observation well is deep. There is no daylight within the geological profile.
Stratification of Groundwater Level Decline Rate
The layered cross-section of WS-094-EOW1 is shown in Table 3 and Figure 9.
Table 3: WS-094-EOW1 Groundwater level decline rate stratification
| Level | Sub-level | Depth range (m) | Decline rate (m/sec) |
|---|---|---|---|
| Layer 1 | EOW1 | GL-0.0 m – GL-3.7 m | |
| Layer 2 | EOW1 | GL-3.7 m – GL-5.35 m | |
| Layer 3 | EOW1 | GL-5.35 m – GL-6.3 m | |
| Layer 4 | EOW1 | GL-6.3 m |
Discussion of Stratified Results
Due to the steep terrain on the upper slope, only one inclined pipe (15 m deep) was drilled at the gentler part of the lower slope to serve as a water level observation well. As shown in Figure 9, the borehole log indicates that the sandstone lies below the very shallow weathered clastic layer. The geological profile shows no daylight. The inclined pipe observation is stable and within the instrument error range . In 2025, the Geological Survey and Mining Management Agency announced that this location was removed from the list of geologically dip slope areas. Since there is only one borehole, drawing the stratification boundary on the gentler slope parallel to the slope surface and converging it at the steeper section is empirical. To represent this spatial uncertainty and avoid assuming homogeneous lithology, the confirmed boundaries of the rate stratification sections have been narrowed to a small range, and dashed lines with question marks are used in the cross-sectional diagram (Figure 9) to denote the extended geological boundaries. The stratification results yield a total of four layers. The groundwater drawdown is faster in the depth range of the first layer, and the hourly observation frequency is insufficient to obtain a precise decline rate, meaning the rate value of serves as a placeholder representing the lower limit of this layer. To address this temporal aliasing, we adjusted the observation recording frequency of WS-094-EOW1 to once every 10 minutes on July 3, 2025. Since this adjustment, no water depths above the first layer's lower limit have been recorded, as no heavy rainfalls or typhoons occurred. Future investigations, including permeability tests, borehole photography, and downhole geophysical logging within this shallow depth range, are planned to better define the characteristics of the first layer.
Preliminary Exploration of Environmental Geological Potential
The boundary of the first layer’s rate stratification coincides with the boundary of the strata where infiltration is rapid, indicating good permeability. The drilled strata consist of rock blocks interbedded with fine-grained matrix. There are occasional instances of scouring and rockfalls (rock blocks approximately in length) near the inclined pipe-water level observation well (WS-094-EOW1). The slope above the WS-094-EOW1 location is relatively steep, and there is also a tendency for erosion variability under heavy rainfall with large accumulated rainfall. Based on current observations, rate stratification, slope, hydrology, and strata characteristics, it is inferred that the slope depth GL-3.7 m is mainly characterized by rockfall potential.
In the case of no daylight in the slope profile, the rate of descent below the second layer gradually transitions toward the characteristic of softening when soaked in water. Therefore, the potential for planar sliding should not be high. Currently, the highest water level observed by WS-094-EOW1 is about GL-2.5 m below the surface. The inclined tube observation shows no displacement tendency and the measured value is within the instrument error range.
Dip Slope C (WS-071)
The lithology of this slope is mainly Shihti formation sandstone. The reference slope borehole depth is about GL-9.6 m with RQD = 0 (see Figure 10). The observation instruments are equipped with one deep water level observation well and two inclined pipes. No displacement tendency has been found in the inclined pipes since observation began in 2018.
Stratification of Groundwater Level Decline Rate
The groundwater level in this borehole only shows slight consistency with short-duration heavy rainfall. The rise in groundwater levels in other areas is mostly delayed after rainfall, possibly related to the approximately thick low-RQD rock layer beneath the surface. Although the slope-top platform can be a groundwater recharge area, the rapid infiltration and exudation of precipitation from the rock debris layer in this area results in a consistently low groundwater level. Based on historical groundwater level observation data, the highest level is approximately GL-5.7 m. The groundwater level trend shows two distinct linear segments with different rates of decline, which can be preliminarily divided into three layers based on their depth: (i) The first layer, , approximately GL-0.0 to GL-5.7 m below the surface, should have the highest permeability. Currently, hourly observation data has not captured groundwater level fluctuations, suggesting it may be significantly higher than , and groundwater seeping into the slope also seeps out rapidly from this layer. In the future, it is planned to increase the observation frequency to determine if its rate of decline can be estimated. (ii) The second layer, , is about GL-5.7 to GL-6.9 m below the surface, with a rate of decline of . (iii) The third layer is divided into two sub-layers: (EOW1) is about GL-6.9 to GL-7.5 m below the surface, with a rate of decline of , and (EOW1) is about GL-7.5 to GL-11.5 m below the surface, with a rate of decline of . The stratification of groundwater level decline on the WS-071 slope is shown in Table 4 and Figure 11.
Table 4: WS-071-EOW1 Groundwater level decline rate stratification
| Level | Sub-level | Depth range (m) | Decline rate (m/sec) |
|---|---|---|---|
| Layer 1 | EOW1 | GL-0.0 m – GL-5.7 m | |
| Layer 2 | EOW1 | GL-5.7 m – GL-6.9 m | |
| Layer 3 | EOW1 | GL-6.9 m – GL-7.5 m | |
| EOW1 | GL-7.5 m – GL-11.5 m |
Discussion of Stratified Results
The RQD is approximately 0 within GL-9 m below the surface of the WS-071 dipping slope, and the highest groundwater level is approximately GL-5.7 m. It is speculated that the fine-grained material within GL-0.0 to GL-5.7 m may have been lost due to leaching, resulting in rapid groundwater infiltration and outflow, indicating a high rate of descent. It is proposed to increase the recording interval to once every 10 minutes and then analyze the descent rate of the first layer. The descent rate of GL-6.9 to GL-7.5 m below the surface gradually decreases compared to the second layer, thus dividing it into the third layer. The concept for drawing the boundary of the layered profile of this slope is slightly different from that of WS-094-EOW1. In WS-094-EOW1, the slope surface and bedding planes are roughly parallel, and the layer thickness converges to 0 at the steep upper slope. In WS-071-EOW1, the layer range is drawn with rock debris properties, and the thickness of the parallel slope surface is roughly unchanged. The descent rate of the second and third layers is low, and the rock RQD gradually increases to . The boundary between the first and second layers may be the geological potential interface. It is speculated that the geological potential of this slope profile is not along the dip slope but mainly rock debris or rock block sliding.
Backfill Soil Layer/Bedding Rock Strata Slope D (WS-066)
Preliminary Analysis of Environmental Geological Potential (WS-071)
The WS-071-EOW1 borehole has a low RQD, and the slope may have the potential for rockfall or debris flow due to unstable joints and weak rock parallel to the slope. Joint surfaces were weakened by previous heavy rainfall events. The only event was block-like rock debris from the WS-071-EOW1 borehole. Therefore, there are differences in lithology in the transverse direction. The rock block securing may have been affected by heavy rainfall. Although there was previously heavy rainfall, the subsequent impact may be related to geological weakness and differences in lithology.
One side of the expansion joint of the retaining wall at the toe of WS-071-EOW1 has a noticeable bulge. The retaining wall has developed approximately 8 longitudinal cracks (crack width ). The tilt sensors T02 and T03 are within the range of approximately . The first layer of the velocity stratification consists of well-permeable rock debris. The highest groundwater level observed to date is approximately GL-5.7 m. The groundwater level drops rapidly, so previous heavy rainfall on this slope likely had an impact. In contrast, the occurrence of incidents on this slope is more related to the external force of earthquakes with an intensity of 4 or higher.
Stratification of Groundwater Level Decline Rate
This slope belongs to the geological Taliao formation and has three water level observation wells. The terrain from high to low is as follows: WS-066-EOW2, with a depth of , mainly composed of soil and sandstone and shale; WS-066-EOW4, with a depth of about , mainly composed of soil; and WS-066-EOW3, with a depth of about , mainly composed of sandstone. According to the rate of groundwater level drop, the results are divided into three layers. The differences in thickness and drop rate of the same layer are compared. The time-series changes of groundwater level in the three wells are summarized in Tables 5 to 7 and Figure 12.
Table 5: WS-066-EOW2 Groundwater level decline rate stratification
| Level | Sub-level | Depth range (m) | Decline rate (m/sec) |
|---|---|---|---|
| Layer 1 | EOW2 | GL-0.0 m – GL-1.3 m | EOW2 EOW2 |
| EOW2 | GL-1.3 m – GL-2.6 m | ||
| Layer 2 | EOW2 | GL-2.6 m – GL-4.7 m | |
| EOW2 | GL-4.7 m – GL-5.8 m | ||
| Layer 3 | EOW2 | — |
Table 6: WS-066-EOW4 Groundwater level decline rate stratification
| Level | Sub-level | Depth range (m) | Decline rate (m/sec) |
|---|---|---|---|
| Layer 1 | EOW4 | GL-0.0 m – GL-2.1 m | EOW4 |
| Layer 2 | EOW4 | GL-2.1 m – GL-4.6 m | |
| Layer 3 | EOW4 | — |
Table 7: WS-066-EOW3 Groundwater level decline rate stratification
| Level | Sub-level | Depth range (m) | Decline rate (m/sec) |
|---|---|---|---|
| Layer 1 | EOW3 | GL-0.0 m – GL-2.2 m | EOW3 |
| EOW3 | GL-2.2 m – GL-4.8 m | ||
| Layer 2 | EOW3 | GL-4.8 m – GL-5.1 m | |
| EOW3 | GL-5.1 m – GL-7.0 m |
Causes of Stratified Rate Differences Among Wells and Their Correlation with Inclinometer Observations
-
The first and second stratification rates of EOW2 are faster than those of EOW4. This may be because EOW2 is close to the location of the pressurized pipeline. Both maintenance and pipeline replacement require excavation and restoration. The backfill for restoration (visually about thick) is presumably not completely compacted, resulting in a slightly higher stratification rate. Along the A direction (downhill direction) of the inclined pipe WS-002-S05 next to EOW2, there is a displacement tendency at a depth of about GL-6 m below the ground surface. The displacement increases by about 1 cm towards the ground surface. The inclined pipe was started around December 2016. Although the displacement change is not large, it is related to the stratification range of the descent rate.
-
EOW4 has only two layers at depths of GL-0 m to GL-4.6 m, unlike EOW2 and EOW3 which are more variable and can be further subdivided. At depths of GL-0 m to GL-2.1 m below the surface, the first layer has a relatively fast infiltration rate. When the groundwater level reaches GL-2.1 m, it requires a significant influx of rainwater to replenish it, and the infiltration rate must exceed the seepage flow rate for the level to rise further. Once the rainfall subsides and the infiltration rate falls below the seepage flow rate, the groundwater level begins to decline. Therefore, the observation frequency will be increased to re-estimate the rate of decline in the first layer. At depths of GL-2.1 to GL-4.6 m below the surface, the rate of decline decreases by approximately . Since the development of this electronic water level observation well, there have been no further human-induced changes to the surrounding topography. It should be representative of the stratification of groundwater level decline rate in the backfill area of this case. Observations at the inclined pipe WS-066-S04 next to EOW4 have been carried out since 2021. The displacement tendency in direction A (downhill direction) is accumulated from about below the surface to the surface. The second layer of the rate stratification first accumulates displacement slightly, and the accumulation amplitude increases to about by the first layer. Although the total displacement change is not large, it should be related to the range of the decline rate stratification.
-
EOW3 is an existing groundwater level observation well with a depth of . It was installed before 2010 but has no well logging information. However, based on nearby drilling data and profiles, it is estimated to be a very shallow layer of weathered soil and sandstone. Since August 2012, it has been recorded hourly with an electronic water level gauge. The rise and fall of groundwater level shows a consistent trend with rainfall. No sudden rise in groundwater level was found with earthquakes (e.g., the Hualien earthquake at 07:58 on April 3, 2024). It can be regarded as a groundwater level observation well of the free aquifer. Before the construction of the drainage well, even with a small amount of rainfall, the groundwater level could rise suddenly to GL-1.0 m below the surface and drop very slowly. After the completion of the drainage well, the groundwater level lowering function has begun to take effect. The first layer of EOW3 dropped at a faster rate and its thickness increased relatively, which is significantly affected by the drainage well. The dewatering effect of the transverse drainage holes after the construction of the drainage well (Figure 13) and the stratification of the groundwater level drop rate in this hole can also be used as an assessment of the subsequent dewatering function of the drainage well. At present, the drop rate value at depth GL-5.1 to GL-7.0 m is not much different from that of the second layer. More rate values will be compared to further assess the extension of the second layer (Table 7, Figure 12). The inclined pipe WS-066-S05 next to EOW3 has been observed since January 2021. The displacement tendency in direction A (downhill direction) is within below the ground surface, and the cumulative displacement on the ground surface is about . The displacement change shows that it is only within the soil layer and should be affected by the duration of high groundwater levels during typhoons and heavy rains.
Preliminary Analysis of Environmental Geological Potential
The slope analysis profile consists of backfill/soil layers and a thin overburden/sandstone layer (WS-066-EOW3). The dip slope shows no visible (daylight) rock layers, indicating a low probability of slippage. Figure 3 shows the displacement changes of the inclined pipe, suggesting that the scouring potential is primarily in the shallow soil layer (approximately thick). The area near WS-066-EOW3 has undergone remediation, slope anchor reinforcement, and the construction of dewatering catch sump. Heavy rainfall or typhoon-induced downpours have exceeded pre-remediation rainfall levels. The maximum cumulative displacement at the top of the inclined pipe is approximately . Currently, no new shallow slippage or recurrence of old slippage has occurred. The inclinometer observations, which have been conducted monthly since 2021 in these pre-existing boreholes, show no significant displacement changes under normal conditions. However, after typhoons and heavy rains, displacements of several millimeters are observed, all restricted within the shallow depth range. These movements are supported by measurement data. When these displacement profiles are overlaid onto the rate-stratified profiles, they show a positive correlation, confirming that these shallow movements are coupled to the deep seepage layers identified in this study. Furthermore, no abnormal displacement was observed during the earthquake of intensity 4 on April 3, 2024.
The water supply pipeline of the pressurized water tower on this slope had previously leaked and ruptured, causing abnormal groundwater levels. The management unit replaced the pipeline at the end of 2019 and has been maintaining it ever since. The slope safety and ground anchor reinforcement and the installation of two dewater catch sumps were completed around February 2015. Currently, no instability has been found during inspections and observations. The electronic water level observation well remains one of the important monitoring items for this slope.
Conclusion
- The permeability coefficients obtained from laboratory or field tests are all obtained under saturated conditions. Although the groundwater level decline rate in this study cannot directly verify whether saturation has been reached, when the rainfall duration is long enough and the accumulated rainfall intensity is sufficient, the selected range of decline rates should be closer to the saturated condition. The slope values within the stratification boundaries in Figure 6 can be narrowed to a similar range. In addition, referring to the permeability coefficients from the in-situ hydraulic tests by Xu, S. M. et al. (2009) and the results from the Geological Survey and Mining Management Agency, the groundwater level decline rates at the four slopes in this study all fall within that range. Although the groundwater level decline rate is not the permeability coefficient, its rate of change is positively correlated with permeability.
- The well logging results of WS-032 and the stratification results of groundwater level drop rate seem to be related to the characteristics of the oblique slope. The first layer of WS-094 stratification is related to the potential for rockfall, and although the interface of the second and third layers seems to be an impermeable layer, it is not a sandstone with a low potential for planar sliding on the slope, which is different from the sandstone-shale interface on the dip slope. The WS-071 stratification is related to RQD and fractures. The first layer is speculated to have the potential for rock debris collapse. Affected by the external force of a large earthquake, the current displacement of the WS-066 soil layer slope is only 1.0 to near the ground surface, which shows that the slope displacement is related to the rate stratification (permeability or seepage). The cumulative displacement first increases slightly from the low drop rate layer to the ground surface, and then increases to the maximum near the ground surface at a slightly higher drop rate layer. If the dip slope sandstone/shale layer also has a gradual stratification phenomenon, then the rate stratification should be an important reference for safety assessment analysis.
- While presenting site-specific case studies is essential due to Taiwan's complex geological structure, frequent typhoons, and climatic variability, several cross-site universalities emerge from this stratification approach. Specifically, the rate of groundwater level decline in free water-bearing layers (such as sandstone and soil), when not disrupted by major geological structures like faults, consistently exhibits vertical stratification. The boundaries of this rate stratification are universally shaped by the compounding effects of weathering, climatic factors (rainfall patterns), biological activity, and human development. Consequently, the main purpose of stratifying the rate of groundwater drop is to identify weak surfaces or potential geological hazards on slopes after rainwater infiltrates the slope. It is hoped that this method can be generalized and applied to safety assessments of dip slopes or areas with potential for landslides in the future. If the stratification results can identify potential planar sliding weak surfaces, it will provide helpful slope safety feedback. It is recommended that this method be included in the discussion of stratifying the rate of groundwater drop.
- Case Study WS-066: The rate of groundwater level decline on the slope reveals important information about the slope. The electronic water level observation well WS-066-EOW3 near the drainage well can observe the dewatering function index of the horizontal drains. Rate stratification can also examine changes in soil layers disturbed by construction, such as WS-066-EOW2. Meanwhile, the electronic water level observation well WS-066-EOW4 located near the pressurization pipeline can observe changes in the groundwater level of the backfill/soil layer, serving as an indicator for slope safety management research or leakage assessment of water pipelines.
- If the water level observation well is not in a free aquifer but in a mixed aquifer (such as a confined aquifer with interbedded sandstone and shale), it will affect the stratification results. Therefore, it is recommended that the depth of the water level observation well be determined by the core sample after the inclined pipe drilling is completed, and then drilled at intervals of about 1 to 2 meters. The drilling depth range of the water level observation well must be within a permeable free aquifer. Interbedded sandstone and shale often have confined layers that will affect the depth of the groundwater level in the free aquifer. The drilling range of the water level observation well should not include interbedded sandstone and shale. If the inclined pipe is used as a water level observation well to reduce drilling costs, if the core sample of the borehole already contains confined sandstone and shale, it is recommended that the water level observation well be cancelled and a separate borehole be drilled instead.
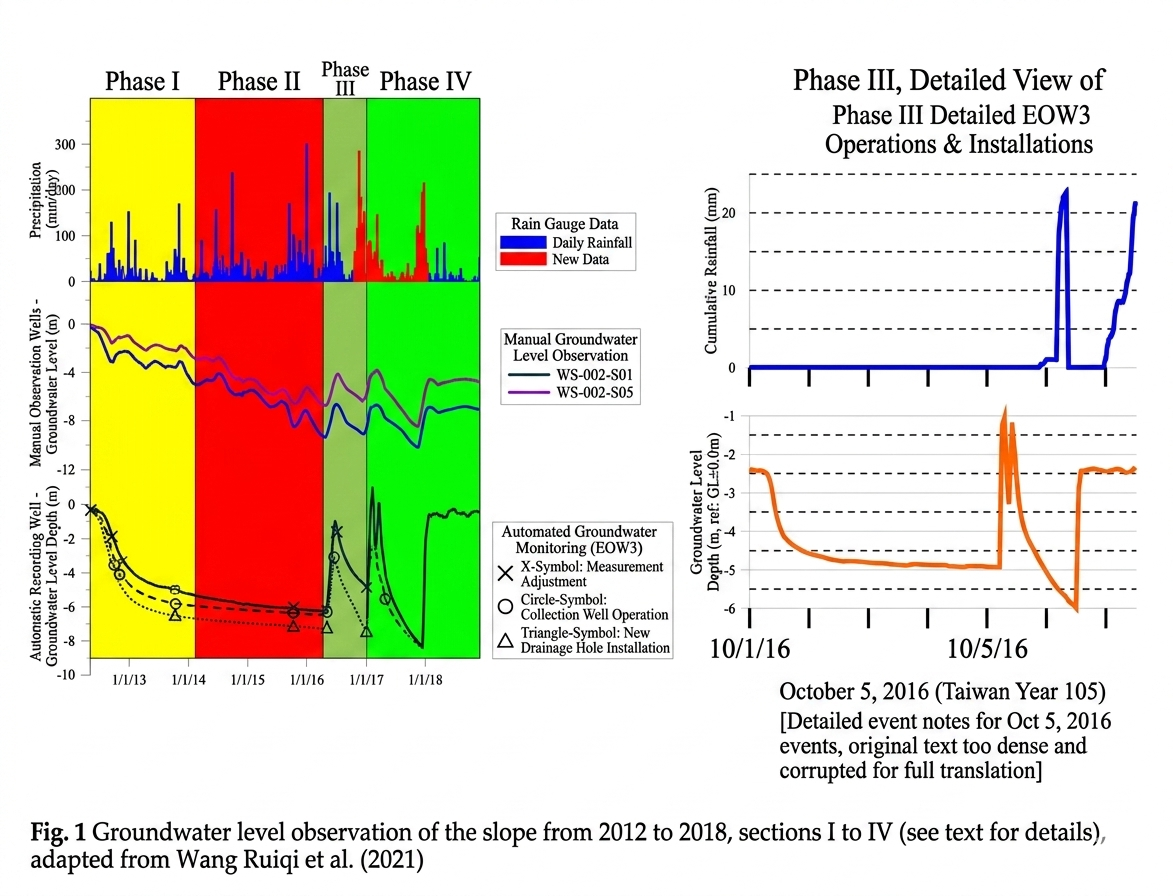
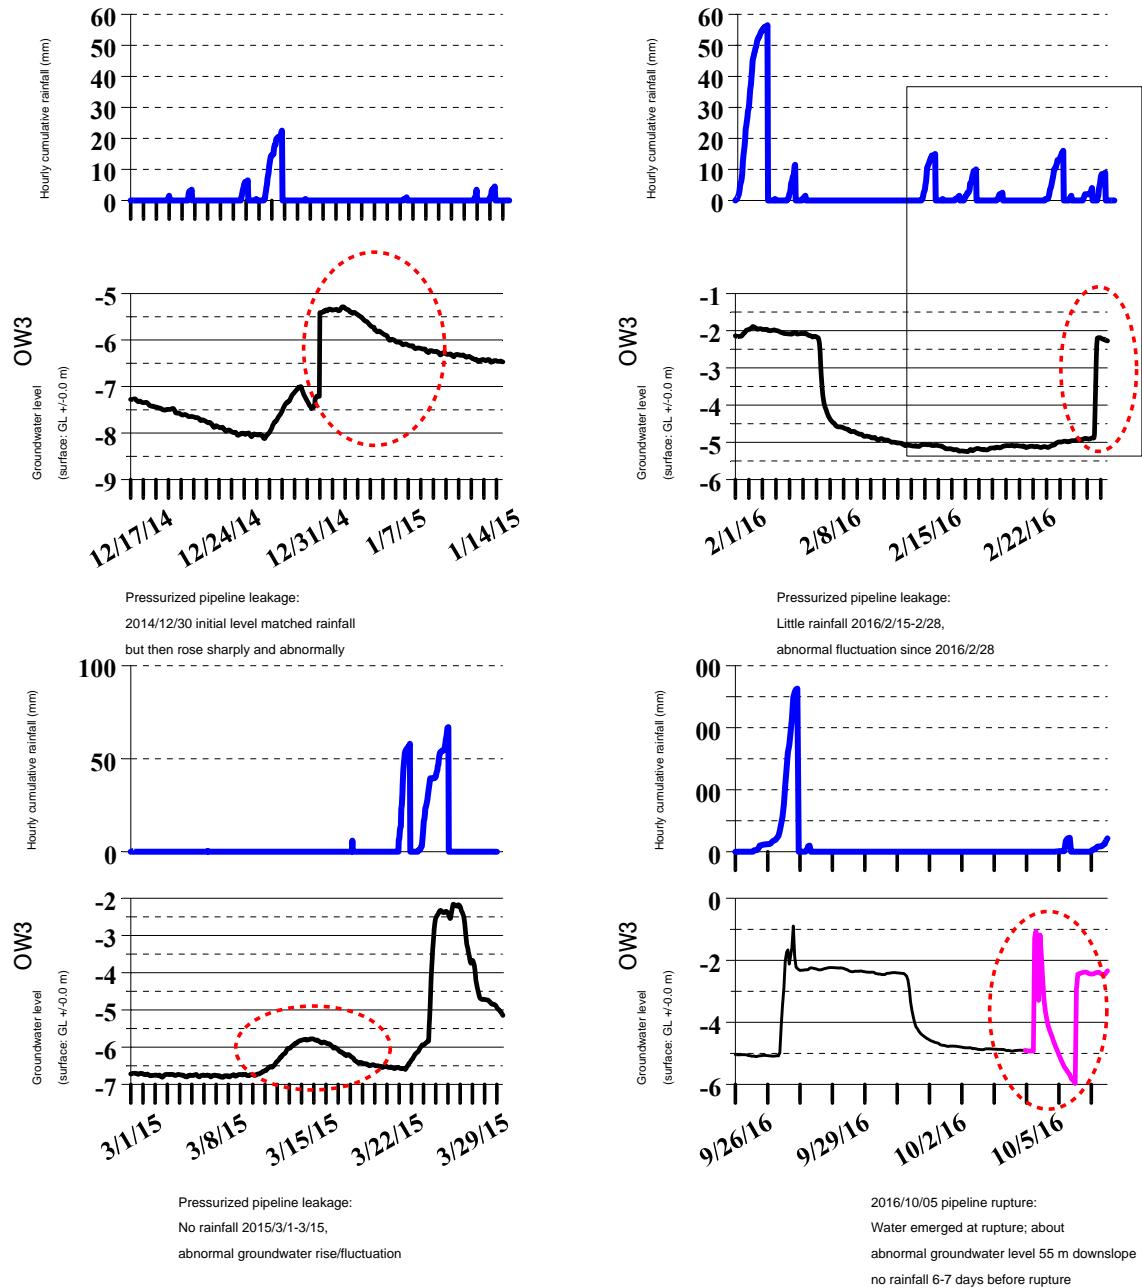
Fig.2 The electronic water level observation well has experienced abnormal changes due to leakage and rupture of the pressurized pipeline.
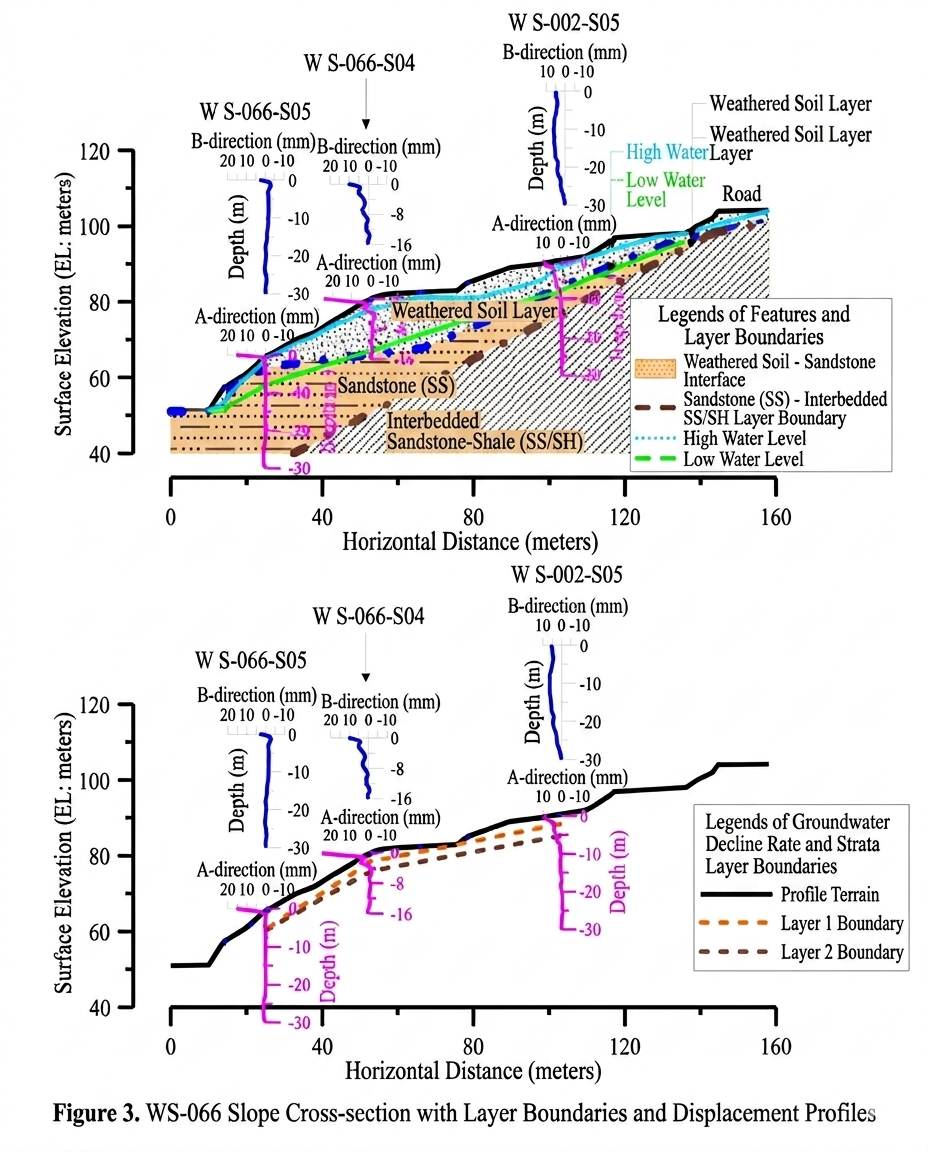
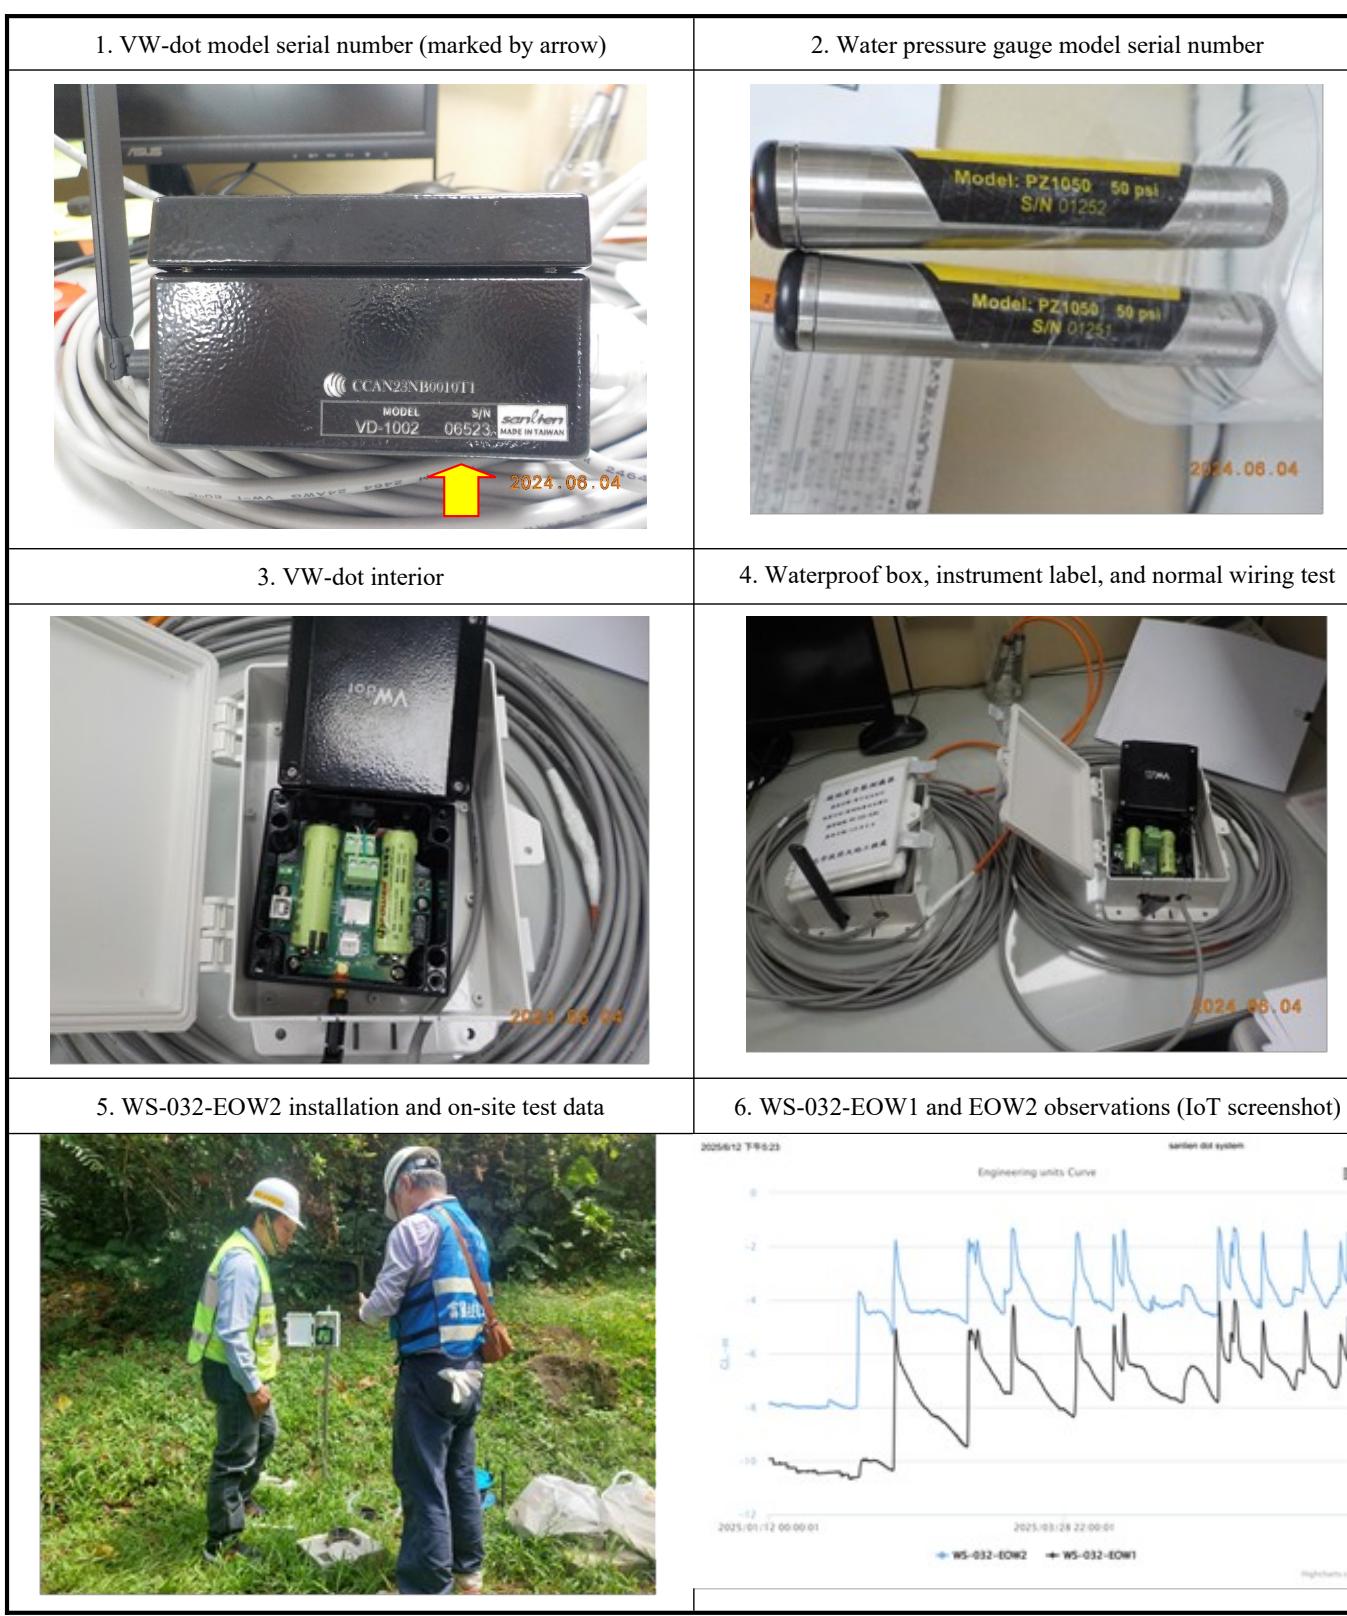
Fig.4 VW-dot and electronic water level observation well automatic recording installation (WS-032 slope).
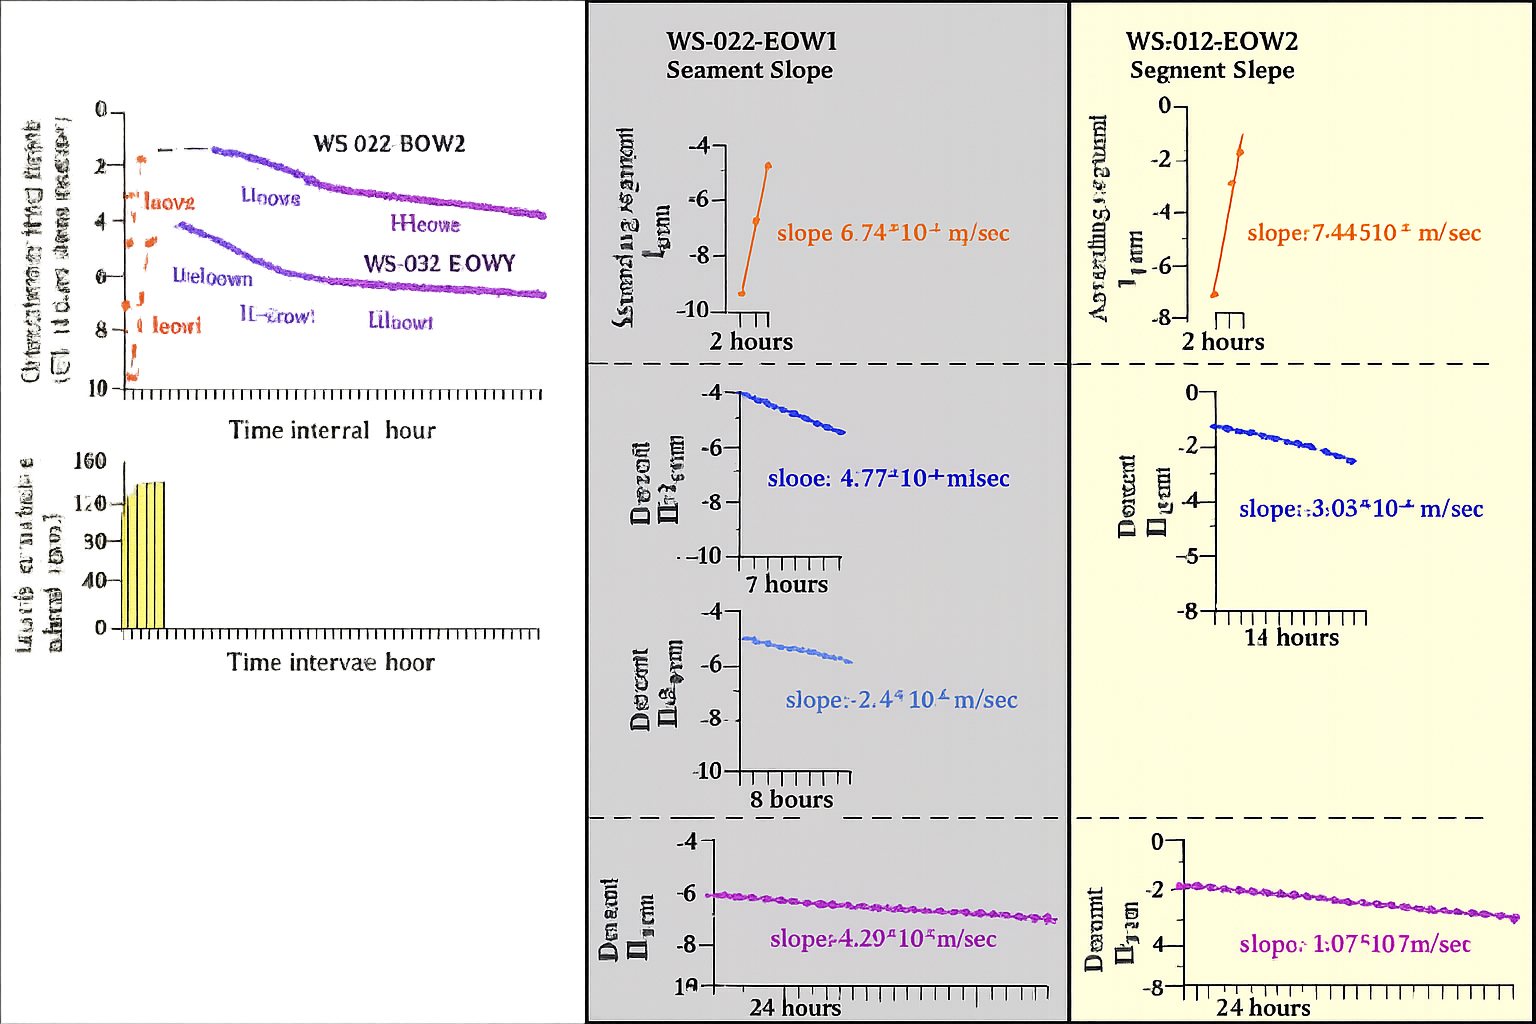
Fig.5 Schematic illustration of groundwater level decline rate for WS-032-EOW1 and WS-032-EOW2 (middle and right of the figure: I, II, III slope values m/sec)
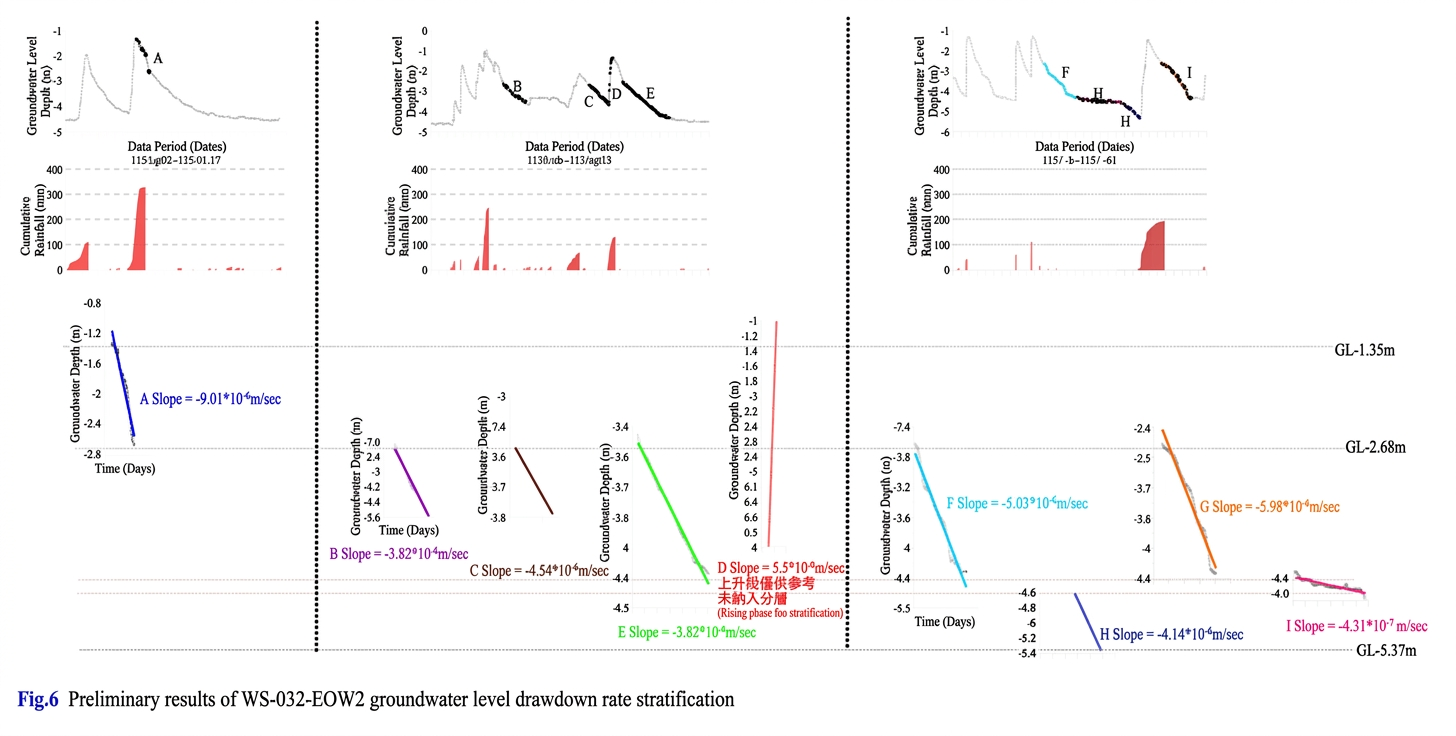
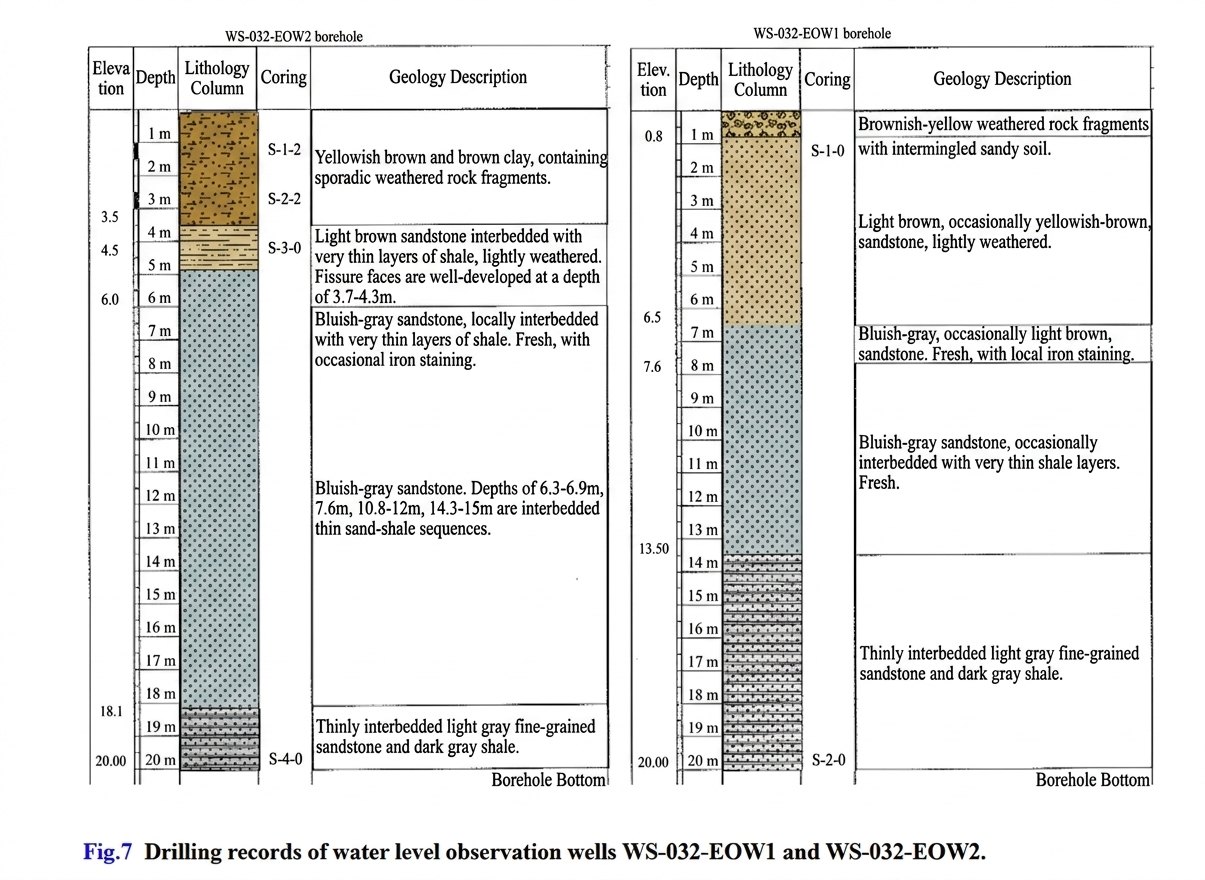
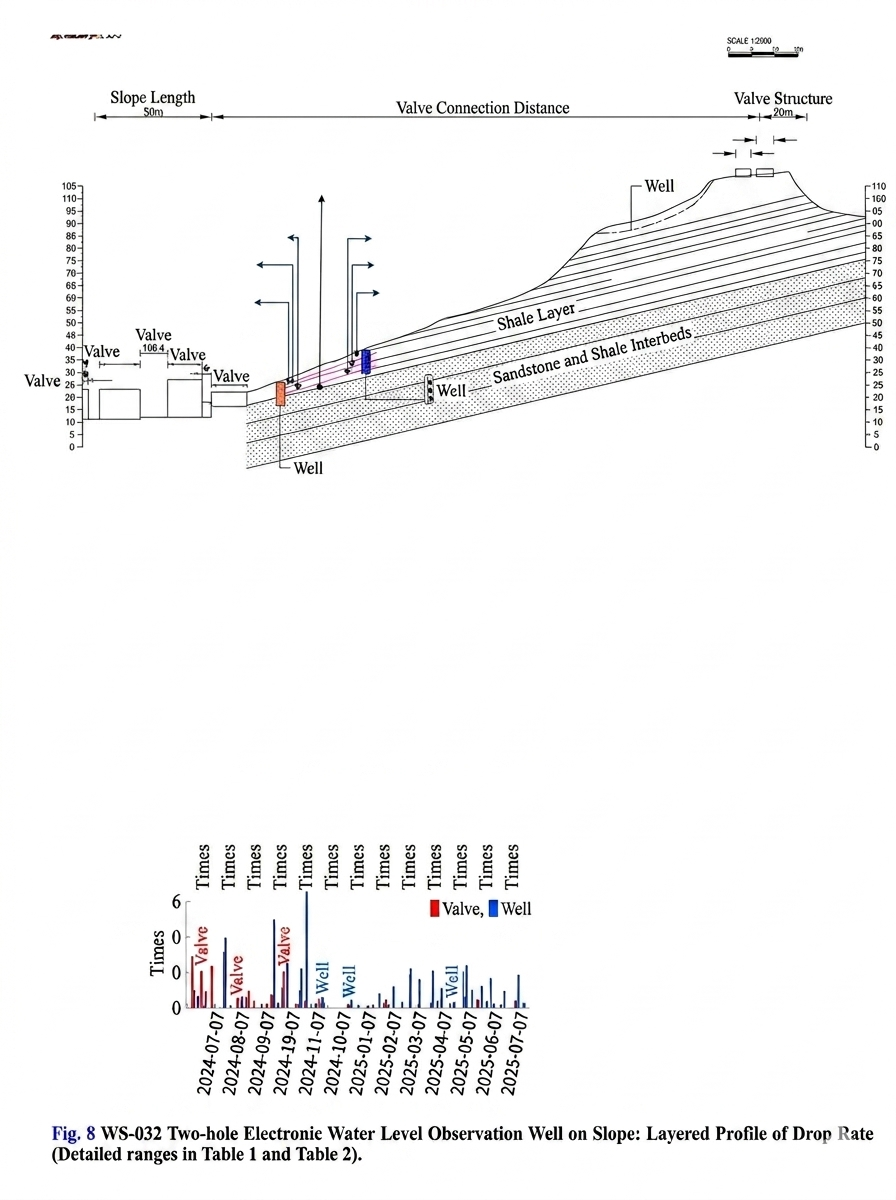
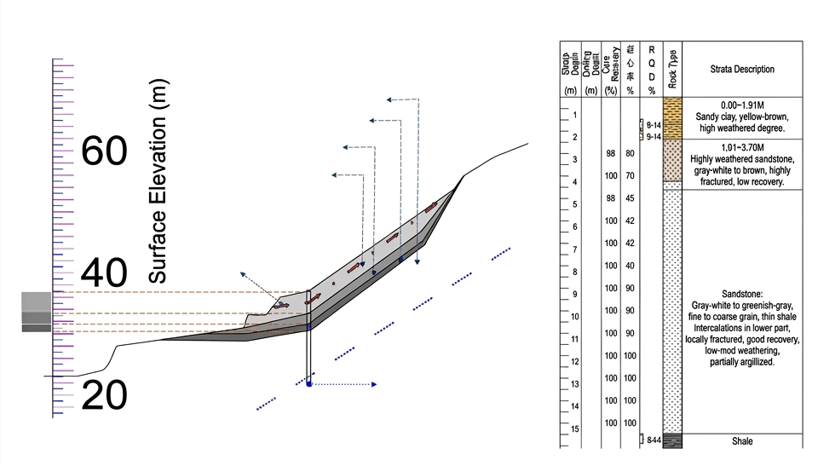
Fig.9 Electronic water level observation well WS-094-EOW1 located on the slope of WS-094, drop rate layered profile and drilling records.
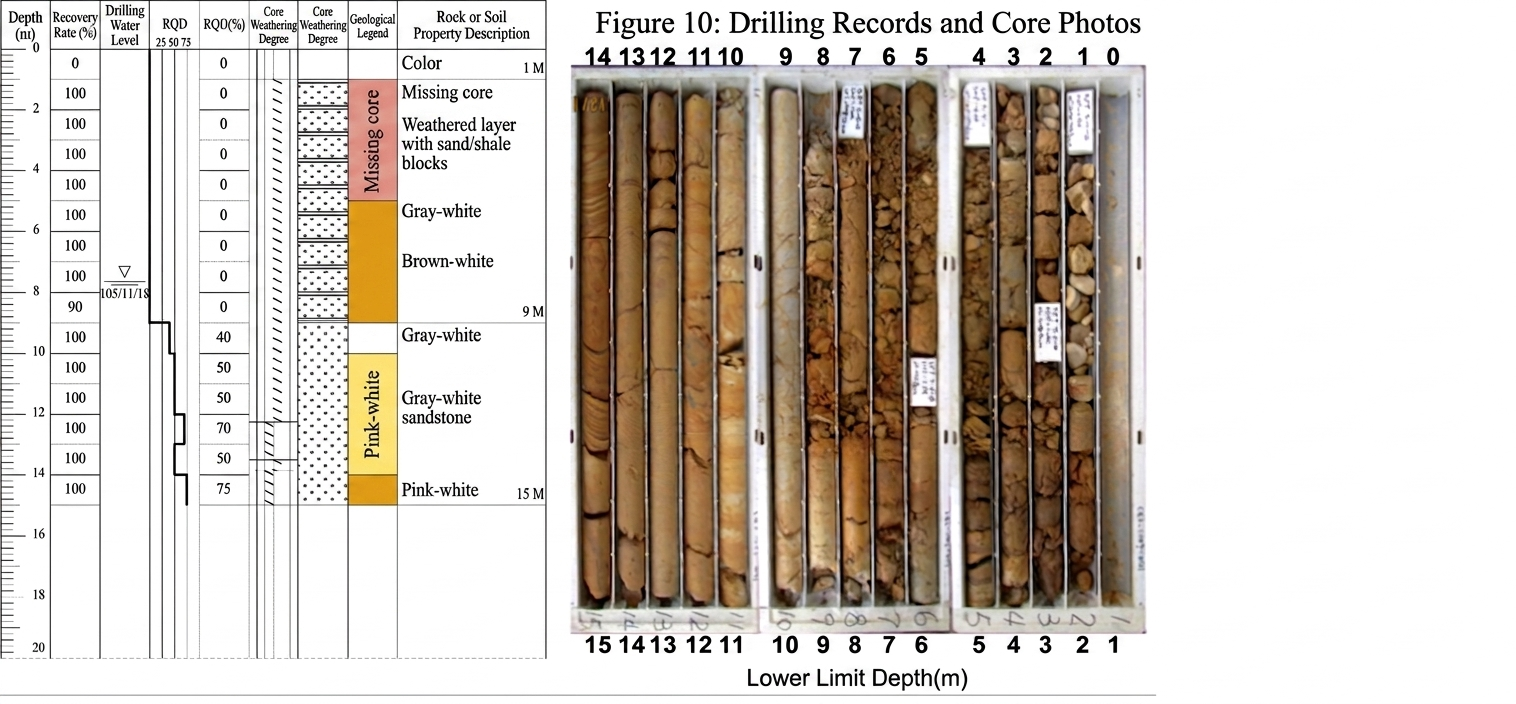
Fig.10 Electronic water level observation well WS-071-EOW1 located on the slope of WS-071, drilling records and core photos
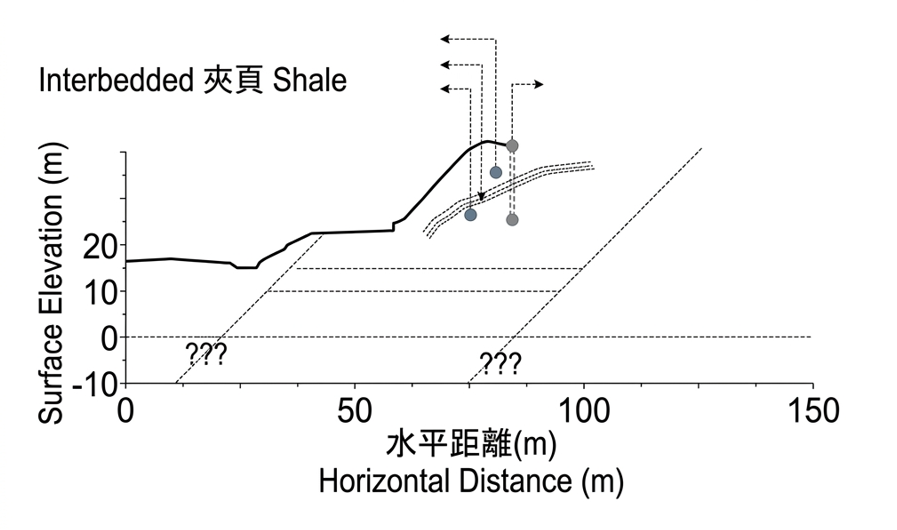
Fig.11 Electronic water level observation well WS-071-EOW1 located on the slope of WS-071, layered profile of groundwater level decline rate
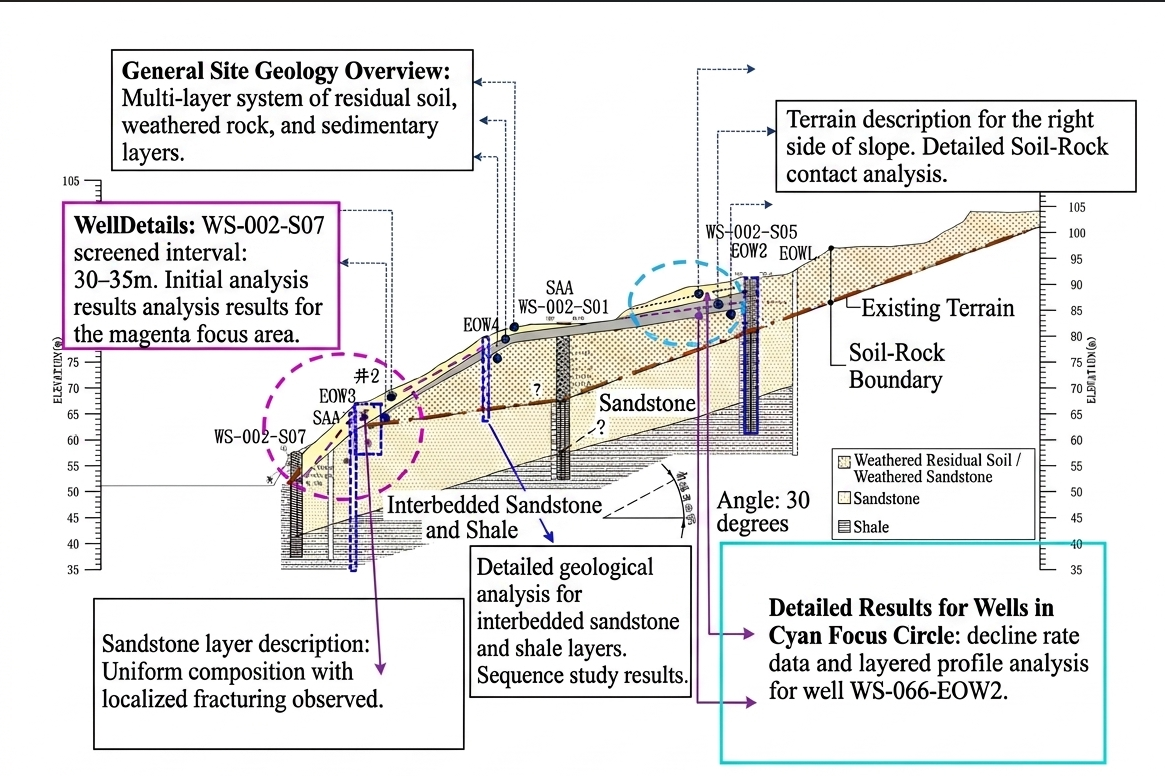
Fig.12 The three electronic water level observation wells WS-066-EOW3, WS-066-EOW4, and WS-066-EOW2 located on the slope of WS-066 show the layered profile of the groundwater level decline rate.
Acknowledgments
Many thanks to the officials at all levels of the Geotechnical Engineering Office and the relevant personnel of the Slope Adjustment Section for their assistance in collecting and studying data from the electronic water level gauges, which enabled the analysis of groundwater level changes and their permeability.
Conflict of Interest
The authors declare no conflict of interest.
Ethical Approval
Not applicable
Data Availability
The datasets used in this study are openly available at [repository link] and the source code is available on GitHub at [GitHub link].
Funding
This work did not receive any external funding.
References
Cite this article
Related Research

Special Issue
Launch a focused special issue to highlight research, emerging trends, and expert insights in your academic field.
