




IntelliPaper
Abstract
Housing is one of the basic needs of life and remains top priority of any person society and economy Housing is one of the basic need of human beings assumes many side significance in terms of degree of economic well being and human development as well as socio-cultural progression and political stability. Indian government implemented several schemes for the mission - “Affordable Housing for All” Increase in population growth coupled with rapidly increasing urbanization and widespread poverty have created a serious shelter problem in India. In the metropolitan cities slums are increased; it leads to the high demand for urban infrastructure and services. As per the technical study conducted by MHUPA (Ministry of Housing and Urban Poverty Alleviation), the urban housing shortage in India is currently estimated at ~19 mn. This gap is expected to further widen to an estimated 38 million homes by 2030 largely due to the rising population and increased urbanization. In terms of investment requirements to meet housing shortage, the 33 million units target of the Ninth Five-Year Plan was estimated to require over Rs 1,50,000.00 crores. To partially achieve this fund needed from formal sources such as banks, financial institutions, government-directed insurance companies, and central, state, and local governments. According to the Indian National Sample Survey’s (NSS- 44th round survey) , more than 80 % of housing finance comes from private savings, non-formal sources of credit and sale of assets. Therefore, increasing funding through both the formal sector and informal sector is an essential and integral means to meet the housing needs of low-income households in India. There are certain psychological factors like sense of security ,sense of belonging ,identity,status ,colour and height that affect housing satisfaction among residents .This study attempts to establish the relationship between these variables.
Explore Digital Article Text
I. INTRODUCTION
The effect of an individuals environment on user satisfaction has been studied by Mario Amerigo et al. The results of this study Mastura Jafar et al revealed that project type price of house and length of residency has a significant influence on housing satisfaction. Residential satisfaction can be divided into satisfaction with one's dwelling (housing satisfaction), satisfaction with one's neighbourhood (neighbourhood satisfaction), and general satisfaction with the area (community satisfaction; Pinquart &Burmedi, 2003), which are usually considered separate components of residential satisfaction (Dekker et al., 2011) and are therefore mostly assessed and analysed separately (Aig-There are certain factors that affect housing satisfaction.questionnaires for assessing residential satisfaction, particularly on psychometric evaluation of the questionnaires that assess satisfaction with a collection of aspects of the residential en-vironment.deprived areas of cities, contributed to the dissatisfaction felt by a significant minority towards their housing. This study focusses on sense of security and sense of belonging as two of the factors that affect user satisfaction among residents in the Doab belt.
1.1 Flatted Developments
In this kind of housing ie group housing the apartments may be single family dwellings in low rise medium or high rise buildings.Tall buildings have a negative impact on the residents satisfaction as there is no sense of connect with the ground and one is not as close to nature as one may be in a plotted development.All the houses look similar and have no identity.
1.2 Plotted Developments
Plotted developments or community gated societies have a great impact on the environment. There is a great connect with nature and the ground. The housing has a gated community housing with interaction spaces. The houses have a terrace and balcony which gives a great connect with nature. There are interaction spaces and community gathering spaces. Each house has a personal identity as the houses are different from each other.
II. MATERIAL AND METHOD
2.1 Case study
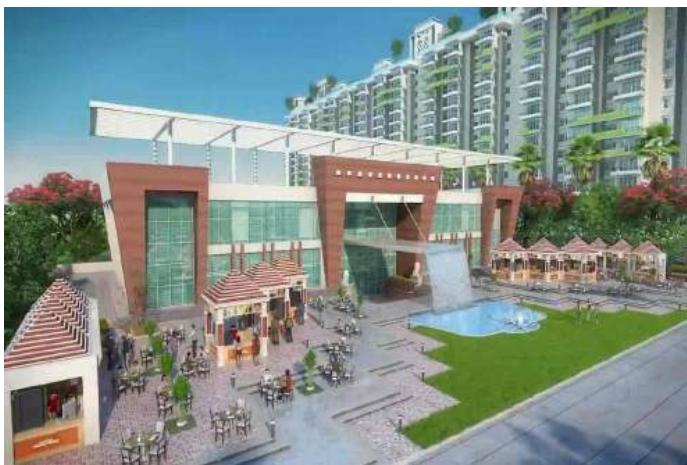
The study investigated case studies of flatted developments like Agi Grand Agi sky garden in Punjab. Also the settlements of New Satnampura and Aranya and Laurie bakers houses. The tall buildings were ten floors high and the plotted developments were a floor or two.
2.2 Photography and Stimulation Conditions
The photographs of the Agi Sky garden and Agi Grand were taken in the early morning by a Nikon camera. The authors showed the photographs to the residents of the area both people with vehicles and pedestrians. The authors manipulated the height of the buildings. The photographs of New Satnampura were also taken and shown to the residents. A questionnaire. or survey was also done on a liekart scale. This suggested that User satisfaction is more among residents of plotted developments than high rise or flatted developments. The presence of cameras in case of plotted developments was shown to the residents also photographs of people gathering in case of plotted developments was shown to the residents. The photographs also stimulated to show effects of cost on house showing perceptions of high cost or low cost. It was felt that plotted developments showed a higher cost than flatted developments so the users were more satisfied with the staus and cost of plotted development houses.
2.3 Measurement of the Psychological Variables of User Satisfaction
This study, which builds on previous research on user satisfaction uses five psychological constructs like sense of security sense of belonging sense of alienation length of tenure and price of house. Participants used an 11 point scale for the ratings on user satisfaction.
In previous studies, along with how they affect individuals' preferences through perceived complexity. Variations in the two variables were created by digitally manipulating photographs. Variations in the two variables were created by digitally manipulating photographs; Samavatek batan, et al. (2016) indicated the acceptability of this technique with regard to the physical features of tall buildings flatted development versus plotted development.
2.4 Participants
The study participants were residents of New Satnampura and Adarshnagar who expressed an interest in participating in research related to architecture and urban planning. During approximately three months of data collection (July 22-October 12, 2020), the authors sent the questionnaire to approximately 400 people via whatsup and email.
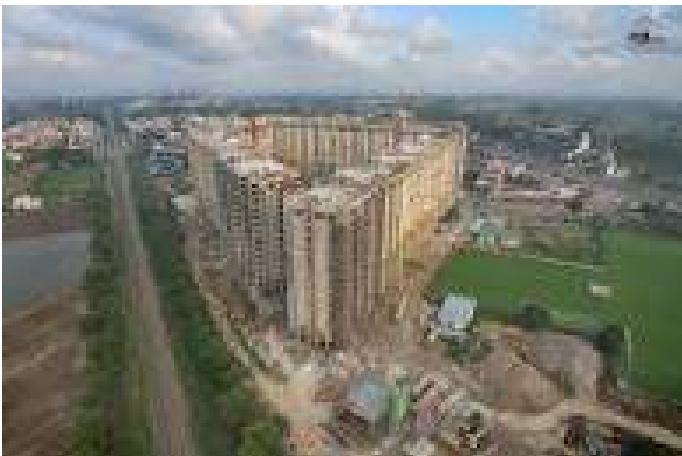
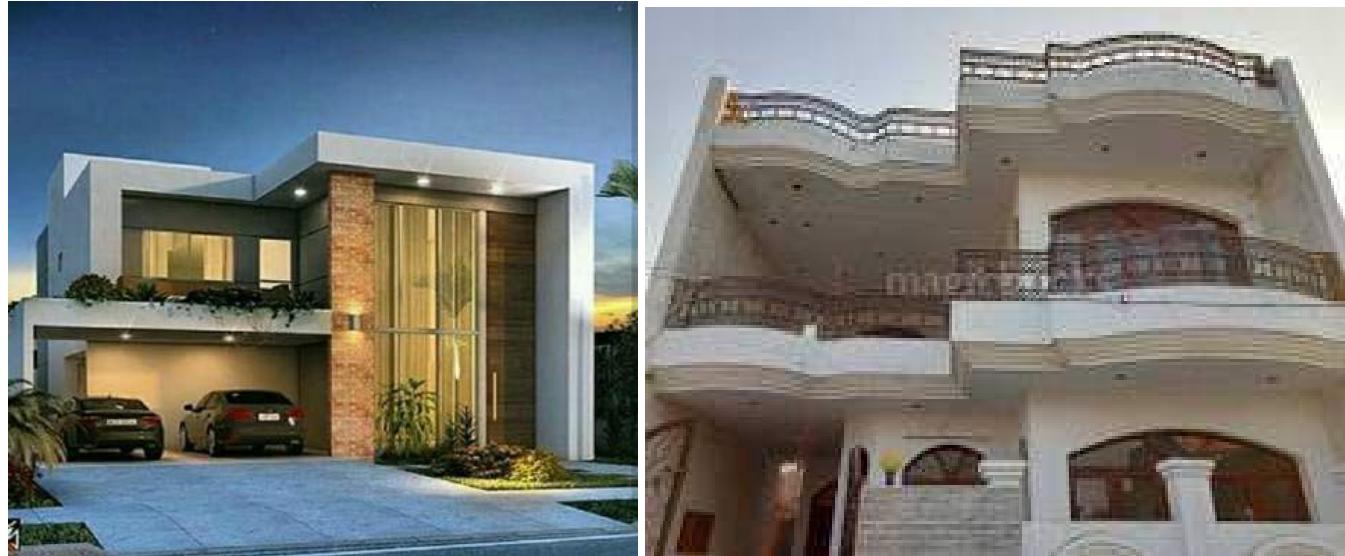 Figure 1: Views of the Agi grand and Agi sky buildings
2.5 Procedure
Participants were mentally prepared before assessing the images based on the questions related to the sense of satisfaction with respect to sense of belonging sense of alienation status and cost and length of tenure. Participants received a scenario and evaluated the images based on the questions related to cost status sense of security sense of belonging and length of tenure, size of house. After looking at the image they responded to ten questions related to that image. They were provided with three images of flatted developments and three of plotted development.. The survey was expected to take participants approximately twelve months some participants took five minutes while others took as long as half an hour.
2.6 Statistical Analysis
The statistical analysis consists of descriptive and inferential results. The descriptive analysis in-cludes the means and standard deviations of the main variables. The authors examined the normality of the variables using skewness, kurtosis, and the Kolmogorov-Smirnov test. They used Pearson correlation, multiple regression, and analysis of variance (ANOVA) in the inferential analysis to address the research questions. The maximum alpha error level for the tests was determined to be.05 (p \<.05). The entire process of data analysis was performed using IBM SPSS Statistics for Windows, Version 25.0 software www.ibm.com/products/spss-statistics). Before statistical analysis, the authors assessed the data in terms of outliers and items to which participants did not respond. Outliers were examined by means of box plots; in a number of cases, after ensuring correct data input, the outlier values were changed to minimum or maximum scores, and the scores were then replaced by the highest or lowest existing mean scores. Outliers and itemsto which participants did not respond accounted for less than 5% of the data. Moreover, deficient items were completely random and did not follow a regular pattern. In a small number of cases, the items to which participants did not respond were replaced through an expectation-maximization EM algorithm.
Table 1: Description of the main variables (mean and standard deviation) and their normality.
Sense of belonging 4.52 2.75.095.125 -.775
Security 5.06 2.90.116 -.094 -.914
Status 4.83 2.82.076.123 -.890
Sense of alienation 4.66 2.78.081.116 -.904
Cost 4.49 2.80.074.156 -.846
Notes. Each data point is based on 720 items answered by participants. Each of the 80 participants rated nine images based on each psychological variable, which resulted in a total of 720 responses for analysis for each variable. KS = Kolmogorov-Smirnov statistic value. Responses to the variables were based on 11-point scales (complexity: o = simple, 10 = complex; enclosure: o = open, 10 = enclosed; fascination, being away, and restoration likelihood: o = not at all, 10 = completely).
Due to the lack of research on the effect of physical characteristics of the environment on restoration, the relationship between physical characteristics and preference, and the relationship between preference and restoration, the authors of this study were assisted by research literature related to physical characteristics affecting preference in selecting variables and the initial feasibility (refer to Lindal and Hartig, 2013, 2015; Masoudinejad and Hartig, 2018). However, due to space and scope limitations, the analysis and conclusions presented in this paper focus on the results of the effects of these variables on user satisfaction.
Due to the lack of research on the effect of physical characteristics of the environment on user satisfaction the relationship between physical characteristics and preference the relationship between user satisfaction and sense of belonging and cost and status the authors of this study were assisted by research literature related to psychological characteristics affecting preference in selecting variables and initial feasibility the relationship between physical characteristics and preference, and the initial feasibility refer to Lindal and Hartig, 2013, 2015; Masoudinejad and Hartig, 2018). However due to space and scope limitations the analysis and conclusions presented in this paper focus on the results of the effects of these variables on user satisfaction.
III. RELIABILITY AND VALIDITY
As this study sought to manipulate the height and status and measure their effect on individuals' psychological satisfaction, the authors used digitally manipulated photographs to portray the different variable combinations using a real-world building. Previous studies have confirmed the reliability and validity of the results of this technique compared with on-site observations (Bishopand Miller, 2007; Coeterier, 1983; Daniel and Boster, 1976; Feimer, et al., 1981; Samavatekbatan, et al., 2016; Stamps, 1990, 2000, 2010; Stewart, et al., 1984; Zube, et al., 1974).
According to Lindal and Hartig (2013), two-dimensional color images help to reduce variation in experiencing "extent" (as defined by ART) and can be used in place of the real environment for assessing restoration. The authors used the Cronbach's alpha coefficient to assess the reliability of the questionnaire. The coefficient should optimally be greater than. 70 (de Vellis, 2003); the value obtained in this study was.81, confirming the internal consistency of the questions and the reliability of the instrument.
IV. RESULTS
4.1 Description and Normality of the Main Variables
Table 1 describes the main variables. The mean values ranged from 4.49 for user satisfaction likelihood to 5.06 for enclosure. Because participants' scores ranged from zero to 10, the obtained means are around the midpoint of the scale. The difference between the highest and lowest means was.57, which indicates there was no significant difference among the variables. The results of the Kolmogorov.
Smirnov test showed that all of the variables had a normal distribution. The significance level of the Kolmogorov-Smirnov test for all of the variables was greater than.05 (p >.05), which is indicative of the normality of the variables. The normal, or close-to-normal, distribution of the variables was further confirmed by the fact that both the skewness and the kurtosis of all variables was in the.
Table 2: Description of the main variables (mean and standard deviation) and their normal
Sense of belonging 4.52 2.75.095.125 -.775
Security 5.06 2.90.116 -.094 -.914
Status 4.83 2.82.076.123 -.890
Sense of alienation 4.66 2.78.081.116 -.904
Cost 4.49 2.80.074.156 -.846
Notes. Each data point is based on 720 items answered by participants. Each of the 80 participants rated nine images based on each psychological variable, which resulted in a total of 720 responses for analysis for each variable. KS = Kolmogorov-Smirnov statistic value. Responses to the variables were based on 11-point scales (complexity: o = simple, 10 = complex; enclosure: o = open, 10 = enclosed; fascination, being away, and restoration likelihood: o = not at all, 10 = completely).
Effect of the Status and Height of Tall Buildings on user satisfaction Like-lihood Ratings Table 2 summarizes the results of the Pearson correlation test conducted on the variables. Cor-relation test results showed that restoration likelihood had a significant relationship (p \<.05) with all the variables except color; it had a negative relationship with height and a positive relationship with the other variables. The strongest relationship with user satisfaction belonged to sense of belonging followed by sense of security Color did not correlate with any of the variables (p >.05), while height had a significant correlation.
The results showed there was a significant relationship between sense of security, sense of belonging, staus and cost. The authors investigated the relationships among the variables using multiple regression analysis, The results of which are shown in Table 3. The authors used the Enter method of regression analysis. The coefficient of determination (R2) indicates the variance of the dependent variable, which is explained by independent variables. The highest coefficient of determination,.65, belonged to restoration likelihood. The color, height, fascination, and being away variables can explain
65% of the variation in restoration likelihood. The authors used the Durbin-Watson test The independence of the residuals (the lack of serial correlations between residuals or errors). The value of this test in all regression models lies within the accepted range (1.5 to 2.5) (Table 3), which means that the residuals have relative independence and there is no serial correlation among them.
The authors examined collinearity among the independent variables using the variance inflation factor (VIF). The results showed that the maximum VIF value was 2.10 (Table 3), which can be safely ignored in regression analysis. In general, the results indicated there was no collinearity among the independent variables. The results of the regression analysis indicated that height, fascination, and being away have an effect on restoration likelihood (p \<.05), while color does not (p >.05). The effect of fascination and being away on restoration likelihood was positive, whereas the effect of height was negative. The greatest impact on restoration likelihood belonged to being away, which had a coefficient of.
According to the results, neither color nor height significantly affected user satisfaction (p >.05).
Figure 4 shows the research model based on the standardized coefficients and their significance. Since the results of the regression model suggest that color and height did not affect the mediator variables of fascination and being away (p >.05), the mediating effect of these variables on the relationship between color, height, and user satisfaction could not be confirmed.
Comparison of the Means of Psychological Variables Based on Observed Images Simultaneous role of color and height on psychological restoration The authors used a one-way ANOVA to examine the differences among the means of the psychological variables based on the observed images. They examined the homogeneity of variances among the groups using Levene's test; if the level of significance is greater than.05, the variances are identical or homogeneous. In the case of homogeneity of variances among the groups for a variable, the authors used the Tukey test; otherwise, they used the Games-Howell post-hoc test.
Table 3: Reports the results of the ANOVA test for the nine images
.569 (.032).007 (.076) -.048*(.076).289** (.032)
Height
Sense of belonging
Sense of security
Status
Identity
FIGURE 4. The mediation research model based on the mediating role of sense of security and sense of belonging relationship between physical features of tall buildings and user satisfaction. R2 = coefficient of determination; N = 720; p ≤.05, *\ p ≤.01.
Simultaneous role of color and height on psychological restoration
The authors used a one-way ANOVA to examine the differences among the means of the psycho-logical variables based on the observed images. They examined the homogeneity of variances among the groups using Levene's test; if the level of significance is greater than.05, the variances are identical or homogeneous. In the case of homogeneity of variances among the groups for a variable, the authors used the Tukey test; otherwise, the used the Games-Howell post-hoc test.
Table 4: Reports the results of the ANOVA test for the nine images.
FIGURE 4. The mediation research model based on the mediating role of Sense of belonging and sense of security in the relationship between physical features of tall buildings and restoration likelihood. R2 = coefficient of determination; N = 720; p ≤.05, *\ p ≤.01.
4.2 Role of the Status
The authors used a one-way ANOVA to examine the differences among the means of the variables based on the look of the house to examine cost and psychological perception in plotted development. Due to homogeneity of variances, the authors used the Tukey's post-hoc test. Table 5 reports the results of this analysis. The results showed that the means of all five variables were very similar in the studied groups. Statistically, there was no significant difference among the means of the variables in the groups (p>.05). It can be inferred that the amounts of complexity, enclosure, fascination, being away, and restoration likelihood based on the colours were not significantly different (p >.05). Figure 6 shows the linear graph of the means of the variables based on the building colour.
 TABLE 4. Comparison of the means of the psychological variables based on the observed images (image numbers refer to Figure 3). Variable Image no. F-value Effect p-1 2 3 4 5 6 7 8 9 size value.
 Sense of security 4.66 4.58 4.40 4.75 4.65 4.41 4.29 4.54 4.42.239.003.983 Sense of belonging 5.28 5.61 5.08 5.01 5.11 5.01 4.83 5.06 4.54.815.009.590 Staus 4.88 4.61 4.89 4.61 4.69 4.81 4.99 5.11 4.89.284.003.971 Cost 4.16 4.37 4.54 4.80 4.71 4.65 4.80 5.00 4.88.704.008.688 User satisfaction 3.85 3.96 4.48 4.63 4.61 4.56 4.69 4.84 4.84 1.290.014.246
 Note. Each data point is based on 720 items answered by participants. Each of the 80 participants rated nine images based on each psychological variable, which resulted in a total of 720 responses for analysis for each variable. Figure 5: Linear graph of the means of the five psychological variables based on the observed images.
 Role of the sense of belonging Again, the authors used a one-way ANOVA to examine the differences among the means of the variables based on three heights (low, medium, and tall). Due to homogeneity of variances, the authors used the Tukey's post-hoc test. Table 6 reports the results of this analysis. The results showed there was a significant difference among the groups (low, medium, and tall) with regard to restoration likelihood (p \<.05). Comparison of the means showed that restoration likelihood for the low height was 4.79, which is significantly higher than the corresponding value for the tall buildings (4.10). The results of the ANOVA showed that the means of sense of security, sense of belonging, status were not significantly different among the three heights (p >.05). Figure 7 shows the linear graph of the means of the variables based on the building heights.
V. DISCUSSION
It was found that sense of security as a variable in user satisfaction was more in case of plotted development as it was within a gated community there was presence of security guard and personl cctv cameras as well eyes on the street. The gates closed at night and opened in the morning giving a great sense of security to the residents. Sense of security was low among flattened developments because although there was a security guard vendors were allowed into the building at odd hours. There was however a security guard at the entrance who made entries for all visitors.Pictures shown to the respondents showed that there was a greater sense of security perception among the residents of plotted developments because they could hire a security guard.
Sense of belonging feeling was also more among the residents of plotted developments because the residents often bought the property in proximity to ones friends or relatives. The neighbours were known to the residents and day to day interaction occurred so there was no sense of alienation. In case of flattened developments a sense of alienation was felt among the residents because the neighbours shut the doors and locked themselves in and there was no or little interaction.
Pictures shown to study the effect of status also revealed that the respondents felt that a bungalow offered a greater feeling of achievement in terms of status in society than a flat.
VI. CONCLUSION
It was found that the study indicated that sense of security was more among residents of plotted developments rather than plotted developments. Also a sense of belonging was more among the users of plotted developments rather than flatted developments. Perception of status was also more among the residents of plotted developments. A feeling of alienation and oppression was felt among the residents of flatted developments with no sense of connect with either the ground or neighbours.
ACKNOWLEDGEMENT
The author wishes to thank Dr Sooraja Ganga my guide for his invaluable advice.
Conflict of Interest
The authors declare no conflict of interest.
Ethical Approval
Not applicable
Data Availability
The datasets used in this study are openly available at [repository link] and the source code is available on GitHub at [GitHub link].
Funding
This work did not receive any external funding.
References
Cite this article
Related Research



Special Issue
Launch a focused special issue to highlight research, emerging trends, and expert insights in your academic field.
