


IntelliPaper
Abstract
Conventional pair trading methods, which rely on statistical and linear assumptions, are challenged by the high volatility and dynamic nature of cryptocurrency markets. This study explores how pair trading strategies might be improved by using machine learning clustering algorithms to uncover latent links between cryptocurrencies. Specifically, it employs unsupervised clustering techniquesk-means, hierarchical clustering, and affinity propagationon daily closing prices of the top 50 cryptocurrencies from January 2021 to November 2024. The methodology includes data preprocessing, exploratory data analysis, clustering, and cointegration tests for pair selection.The main findings show that clustering algorithms can efficiently group cryptocurrencies based on similar behavioural price patterns, with affinity propagation outperforming other models in cluster definition. The study reveals 21 pairs with strong cointegrationstrategies among the chosen cryptocurrencies, indicating their appropriateness for trading. The study highlights the effectiveness of clustering algorithms in tackling cryptocurrency market volatility, optimizing pair selection, and adapting to dynamic conditions. It emphasizes the transformative potential of machine learning in enhancing trading techniques and efficiencyin cryptocurrencies market.The practical implications include advancing trading strategies for cryptocurrencies investors by incorporating machine learning techniques to enhance market efficiency and profitability.
Explore Digital Article Text
I. INTRODUCTION
The rise of cryptocurrencies has dramatically transformed financial markets, presenting both opportunities and challenges for traders and researchers. These currencies, characterized by high volatility, a decentralized nature, a lack of traditional regulatory frameworks, rapid shifts in market sentiment, and varying levels of liquidity (Gurdgiev et al., 2019; Johnson, 2020; and Lee & L'heureux, 2020). They deviate significantly from the stable and regulated environments of traditional asset classes (Trabelsi, 2018; Kurka, 2019). Such dynamics often violate the core assumptions of stationarity and normal distribution that underpin traditional statistical methods in pairs trading (Luo et al., 2019; Tatsumura et al., 2023). Traditional statistical techniques to pair trading such as cointegration and mean-reversion methods, rely on linear assumptions and static connections between asset pairings (Avellaneda and Lee, 2010). Historically, these traditional techniques relied on the premise of market efficiency and stable relationships between asset prices (Shin et al., 2023; Jeon & Kim, 2022; Lv et al., 2023; Coskun et al., 2023; Gupta et al., 2018). While they are effective for conventional assets like equities and commodities, these approaches falter in cryptocurrency markets due to their inherently dynamic and nonlinear nature. For instance, the high-frequency trading landscape of cryptocurrencies amplifies price movements, making it challenging for static models to adapt to sudden and drastic changes in asset correlations. This often results in missed opportunities or increased risks, particularly during periods of market dislocation. Cryptocurrency markets thus have emerged as a fertile ground for algorithmic trading strategies, including pairs trading, which aims to exploit mispricing between asset pairs in a market-neutral manner (Fang et al., 2022 and Gatev et al., 2006). Specifically, Machine learning has emerged as a transformational approach for identifying complicated patterns and making dynamic modifications to trading strategies (Pandya, 2024).
Clustering algorithms, a type of unsupervised machine learning techniques, have shown to be very useful for pair trading strategies (Sarmento & Horta, 2020). By clustering cryptocurrencies based on similar traits, these algorithms can find hidden links that standard measures like correlation or cointegration may not reveal (Lorenzo & Arroyo, 2022). In particular, techniques such as k-means, hierarchical clustering, and density-based spatial clustering of applications with noise (DBSCAN) provide distinct benefits for detecting groups of assets with similar behavioural patterns (Jain, 2010). For example, k-means clustering is commonly utilized due to its simplicity and scalability, allowing traders to categorize cryptocurrencies based on price movements, trading volumes, or blockchain-specific indicators (Schmidt, 2024). Hierarchical clustering, on the other hand, generates a dendrogram representation of layered linkages between assets, which is useful for finding multi-level dependencies inside clusters (Murtagh & Contreras, 2012). DBSCAN is especially successful in dealing with the noisy, high-dimensional data seen in cryptocurrency exchanges since it separates outliers and discovers clusters of various forms (Ester et al., 1996).
Clustering-driven pair trading algorithms frequently use cryptocurrency-specific information such as blockchain transaction data, network activity, and developer activity indicators to increase clustering accuracy and forecast performance (Panigrahi et al., 2022). Clustering based on blockchain transaction data, for example, might indicate currencies that are widely traded together, suggesting underlying user behaviour or market dynamics (Lorenzo & Arroyo, 2022). Further, using sentiment analysis from social media platforms such as Twitter or Reddit improves clustering models by incorporating market sentiment into trading choices (Bollen et al., 2011). Advances in deep clustering algorithms, which combine clustering and deep learning techniques, hold significant potential for cryptocurrencies by allowing feature extraction and grouping to occur concurrently, boosting the resilience of trading strategies.
Furthermore, clustering algorithms are critical in tackling major issues in pairs trading, such as selecting ideal trading pairs and dynamically adapting strategies to market fluctuations (Aldridge, 2013). Adaptive clustering approaches, which enable real-time re-clustering of assets in response to changing market conditions, guarantee that trading pairs stay relevant in turbulent situations (Shivaraman, 2023). By constantly updating clusters, traders can catch ephemeral correlations and profit from short-term mispricing (Visagie, 2017). Reinforcement learning frameworks using clustering as a pre-processing step have shown enhanced performance in pairs trading because they allow the model to learn from past data while reacting to changing market conditions (Zong, 2021).
Clustering algorithms play a vital role in cryptocurrencies data analysis, as they provide insights into market dynamics, determine risky assets, and improve decision-making. They simplify data complexity, discover transactional trends for profiling, and enable real-time analysis via dimensionality reduction. Furthermore, clustering aids strategic planning by combining cryptocurrencies with similar on-chain properties, exposing market trends (Zekiye et al., 2023; Shin et al., 2019; Guo et al., 2019). Despite its benefits, clustering algorithms encounter issues such as susceptibility to noisy and missing data, which are common in cryptocurrencies transactions, resulting in inefficient clustering (Shah et al., 2021). They are computationally demanding, particularly when working with huge blockchain datasets, needing scalable frameworks (Shah et al., 2021). Furthermore, understanding clustering results in high-dimensional datasets may be difficult, and the success of clustering is heavily dependent on the method and its parameters, such as the predetermined number of clusters in K-means (Guo et al., 2019; Shin et al., 2019). In addition, regulatory uncertainty and the danger of market manipulation add to the complexity, emphasizing the importance of comprehensive risk management frameworks when implementing clustering-based methods (Makarov & Schoar, 2020).
In summary, clustering algorithms are an effective tool for improving pairs trading techniques in the cryptocurrency market, allowing you to uncover and exploit intricate correlations between assets in a dynamic, high-volatility environment. These solutions have considerable potential for academic research and practical implementation because they capitalize on the unique characteristics of cryptocurrencies and use modern machine learning techniques. This study therefore aims to leverage the capabilities of clustering algorithms to conduct a comprehensive analysis of the daily prices of top 50 cryptocurrencies in the market. Especially, this study aims to find viable pairs for a pairs trading strategy by identifying clusters of cryptocurrencies with similar properties. The findings are likely to help design more robust and flexible trading platforms, as well as further the incorporation of machine learning into the fast-developing cryptocurrency market.
II. LITERATURE REVIEW
According to contemporary financial literature, pairs trading has become a prominent market-neutral approach that is gaining appeal in the cryptocurrency sphere due to the asset class's volatility and inefficiency. Recent research has offered insights into a variety of statistical methodologies for improving pairs trading tactics in cryptocurrency markets. These strategies pick ideal trading pairings using statistical qualities including cointegration, correlation, and mean reversion. For example, Ko et al. (2023) investigated six statistical techniques for pair trading in cryptocurrency marketplaces, including cointegration, correlation, and clustering. The study found that clustering-based methods outperformed traditional strategies in finding optimal trading pairs, resulting in solid profits even during periods of high volatility. In addition, Leung and Nguyen (2018) developed a strategy for creating cointegrated cryptocurrency portfolios using the Johansen and Engle-Granger tests. Their research focused on assets like Bitcoin, Ethereum, and Litecoin, demonstrating the profitability of cointegration-based strategies even in tumultuous markets. They tested several configurations and discovered that strategies with stop-loss limitations produced superior risk-adjusted returns. Furthermore, Ntsaluba (2019) used evolutionary algorithms and artificial neural networks to predict directional changes in Bitcoin, Ethereum, and Ripple. The hybrid strategy was compared to statistical methods such as moving averages, displaying higher prediction accuracy and profitability.
More so, Long-short strategies, designed to exploit mispricing in financial markets, are increasingly applied in cryptocurrency trading. These strategies involve taking long positions on undervalued assets and short positions on overvalued ones, with the goal of achieving market-neutral returns. There are several recent research that highlights the theoretical and practical applications of long-short strategies in cryptocurrency markets. For instance, Nair (2021) examines long-short pairs trading in cryptocurrencies, employing methods such as correlation analysis, distance approaches, stochastic return differentials, and cointegration. This study shows that long-short portfolios consistently outperform long-only strategies, offering cumulative returns that question the efficiency of cryptocurrency markets. The research emphasizes the inverse relationship between correlation coefficients and trading pair distances, providing a foundation for constructing market-neutral portfolios. Ahroum and Achchab (2019) investigate long-short strategies in Islamic finance markets, including cryptocurrencies. Using wavelet theory for time-scale decomposition, the study identifies significant risk premiums that can be captured through long-short portfolios, presenting a novel application for alternative asset classes. Further, Kim and Lee (2019) analyse the effect of shorting costs on long-short arbitrage strategies. Their findings reveal that these costs can reduce gross returns by up to 40%, significantly impacting profitability. This study highlights the importance of incorporating transaction costs and shorting constraints when designing long-short strategies in volatile markets like cryptocurrencies. Kessler and Gladchenko (2018) investigate the integration of multiple investment signals for constructing long-short portfolios. The study compares methodologies that combine weights from individual signals versus an integrated approach to signal combination. While primarily applied to traditional assets, the findings offer insights into optimizing strategies in cryptocurrency markets.
Furthermore, Machine learning (ML) is revolutionizing pair selection strategies in cryptocurrency trading by enhancing predictive accuracy and improving portfolio optimization. There are many studies highlighting ML applications and innovations in this domain. For example, Chen et al. (2022) proposed a machine learning-assisted method for selecting trading pairs across stocks and cryptocurrencies. By applying clustering algorithms, the model effectively combined asset classes to enhance diversification and reduce trading. Guijarro-Ordonez et al. (2021) propose a deep learning framework for statistical arbitrage that employs convolutional transformers to identify temporal price patterns and optimize trading portfolios. Although primarily tested on equities, the methodology offers insights into machine learning-driven pair selection for cryptocurrencies. Additionally, Zhang et al. (2022) apply ML techniques to momentum-based statistical arbitrage. The study demonstrates that ML models outperform traditional momentum strategies in identifying profitable asset pairs, providing a robust framework for cryptocurrency applications. Leung and Tam (2021) use elastic-net regression to construct replicated portfolios of peer assets, optimizing factor hedging and statistical arbitrage risk premiums. Their approach is adaptable to cryptocurrencies, where peer asset selection is critical. Beyond that, Huck (2019) investigates ML applications to large data sets for statistical arbitrage. The study highlights clustering algorithms for dynamic pair selection, with potential applications in high-frequency cryptocurrency trading. Also, Zhan et al. (2021) explore arbitrage opportunities using ML models for pair selection. The findings suggest that ML enhances the identification of temporary inefficiencies in cryptocurrency pairs, improving trading outcomes.
The application of clustering techniques in cryptocurrency market dynamics has gained momentum as traders and researchers seek to understand patterns, segment markets, and improve predictive models. The current literature indicates that by incorporating machine learning clustering algorithms, traders aim to refine pair selection and optimize trading strategies. For example, Cen et al. (2022) introduced a temporal clustering method for financial time series, enabling better feature extraction from market data. Although applied to traditional assets, this approach has implications for improving pair selection in cryptocurrency trading. Aspembitova et al. (2021) use k-means clustering and Support Vector Machines (SVM) to identify user behaviours in Bitcoin and Ethereum markets. They uncover four distinct behavioural types: optimists, pessimists, positive traders, and negative traders. This segmentation reveals differences in market views and strategies between Bitcoin and Ethereum users during local price fluctuations and systemic events. Likewise, Lorenzo and Arroyo (2022) apply prototype-based clustering techniques to analyse the cryptocurrency market. Their methods, including k-means and other clustering algorithms, provide insights into market segmentation and trading patterns. Further, Hachicha et al. (2023) investigate herding behaviour and its impact on price clustering within cryptocurrency markets. Their findings suggest that behavioural tendencies influence price patterns, presenting opportunities for predictive modelling. Besides, Guo et al. (2019) develop a dynamic network model to assess market segmentation and clustering in cryptocurrency trading. By identifying latent communities, the study demonstrates how return predictability and crypto-specific features like hashing algorithms influence market behaviour. Recently, Soltani et al. (2023) employed time-frequency clustering to study the connectedness between investor sentiment, cryptocurrency markets, and external factors like the COVID-19 pandemic. Their results reveal behavioural contagion and volatility clustering during crisis periods.
III. GAP OF THE STUDY
Based on the reviewed studies, the following gaps emerge that need addressing to fulfill the stated objective. Firstly, most studies focus on a limited subset of cryptocurrencies, such as Bitcoin, Ethereum, or Litecoin. While these assets are widely studied, the broader market comprising the top 50 cryptocurrencies remains underexplored, especially in terms of pair selection for trading strategies. The current study in hand focus on the top 50 cryptocurrencies can provide a broader and more representative understanding of clustering patterns and trading opportunities across the cryptocurrency market. Secondly, as we know cryptocurrency markets are highly volatile and rapidly evolving, yet there is limited research on adaptive models that dynamically update pair selection strategies in response to market shifts. Thus, by leveraging adaptive clustering methods, the current study can propose frameworks that adjust to evolving market conditions, offering real-time utility for traders in the cryptocurrencies industry. Thirdly, the reviewed studies often use shorter timeframes or limited datasets, which may not fully capture long-term patterns and structural shifts in the cryptocurrency market. By analysing daily prices of the top 50 cryptocurrencies over an extended period, the current study in hand can provide a more comprehensive dataset for clustering and trading strategy development. Therefore, by addressing these gaps, the study will significantly advance the understanding and application of clustering algorithms in cryptocurrency trading, contributing both theoretical and practical insights to the field.
IV. METHODOLOGY
4.1 Data and Data sources
This study aims to conduct a clustering analysis on the top 50 cryptocurrencies in the crypto market to identify potential pairs for a pairs trading strategy. The dataset, sourced from Yahoo Finance using pandas_datareader, comprises daily closing price data in USD spanning from January 1, 2021, to November 11, 2024. This study emphasizes price pattern behavior as the key predictor of future cryptocurrency market trends, volatility, and returns, based on the premise that, according to the Efficient Market Hypothesis (EMH), asset prices already reflect all relevant information. Therefore, historical price movements alone are sufficient for analyzing and identifying clusters in market trends and investor behavior, without the need for external factors such as trading volume or sentiment. Furthermore, the period 2021–2024 was chosen as the cryptocurrency industry experienced significant volatility, market booms and crashes, alongside increasing institutional adoption, regulatory crackdowns, technological milestones, and emerging innovations, setting the stage for a more mature and resilient market. In addition, the top 50 cryptocurrencies were selected based on their market capitalization and their daily trading volume. This metric was chosen because it reflects the relative size, and prominence of each cryptocurrency in the market, ensuring the inclusion of actively traded assets and providing a comprehensive representation of the industry's leading assets. Six cryptocurrencies were excluded from the analysis due to incomplete data for the entire study period. These excluded currencies are SHIB, UNI1 ICP, COMP, GRT, and LUNA1. The remaining 43 cryptocurrencies, including BTC, ETH, BNB, XRP, ADA, DOGE, SOL, DOT, MATIC, LTC, AVAX, TRX, ATOM, XMR, LINK, XLM, BCH, ALGO, VET, FIL, EGLD, MANA, SAND, THETA, XTZ, AAVE, AXS, FTM, KSM, RUNE, ZEC, MKR, CAKE, ONE, BAT, BTT, ZIL, NEO, WAVES, DASH, ENJ, QTUM, and OMG, were included for further analysis.
4.2 Method of Analysis
To achieve its objective, this study employed unsupervised clustering techniques within machine learning. The analysis involved several steps. First, the process began with loading the dataset and essential Python packages (Appendix I), including libraries for data loading, analysis, preparation, and model evaluation. These packages were utilized throughout various stages of model development.
Second, an exploratory data analysis (EDA) was conducted, incorporating descriptive statistics to examine data structure and visualization techniques to assess post-clustering patterns. Third, data preparation for modeling was undertaken, starting with data cleaning to address missing values (either removing rows with NAs or imputing them with column means). This step ensured a reliable and clean dataset for clustering. Data transformation followed, focusing on daily returns and variance as variables, as they are key indicators of cryptocurrency performance and volatility. The StandardScaler from sklearn was applied to standardize features to a unit scale (mean = 0, variance = 1), ensuring all variables were on the same scale to avoid bias in clustering outcomes.
Fourth, after data preparation, clustering algorithms were explored and visualized. The study evaluated models such as k-means, hierarchical clustering (agglomerative clustering), and affinity propagation, applied to group the remaining 43 top cryptocurrencies in the market. These models were selected for their ability to identify distinct cryptocurrency clusters with different volatility patterns and trading behaviours. Finally, pair selection was performed, where the study scanned cryptocurrencies within each cluster and tested for cointegration between pairs. Once pairs were identified, the results were visualized, enabling their use in a pairs trading strategy.
V. ANALYSIS AND FINDINGS
Descriptive Statistics: In the descriptive statistics, the study looks into the shape of the data where the output result indicates that (1411 raw, 43 column), and the mean, Standard deviation, Min, 25%, 50%, 75% and Max (Appendix I). Then correlation between the variables in the study was conducting
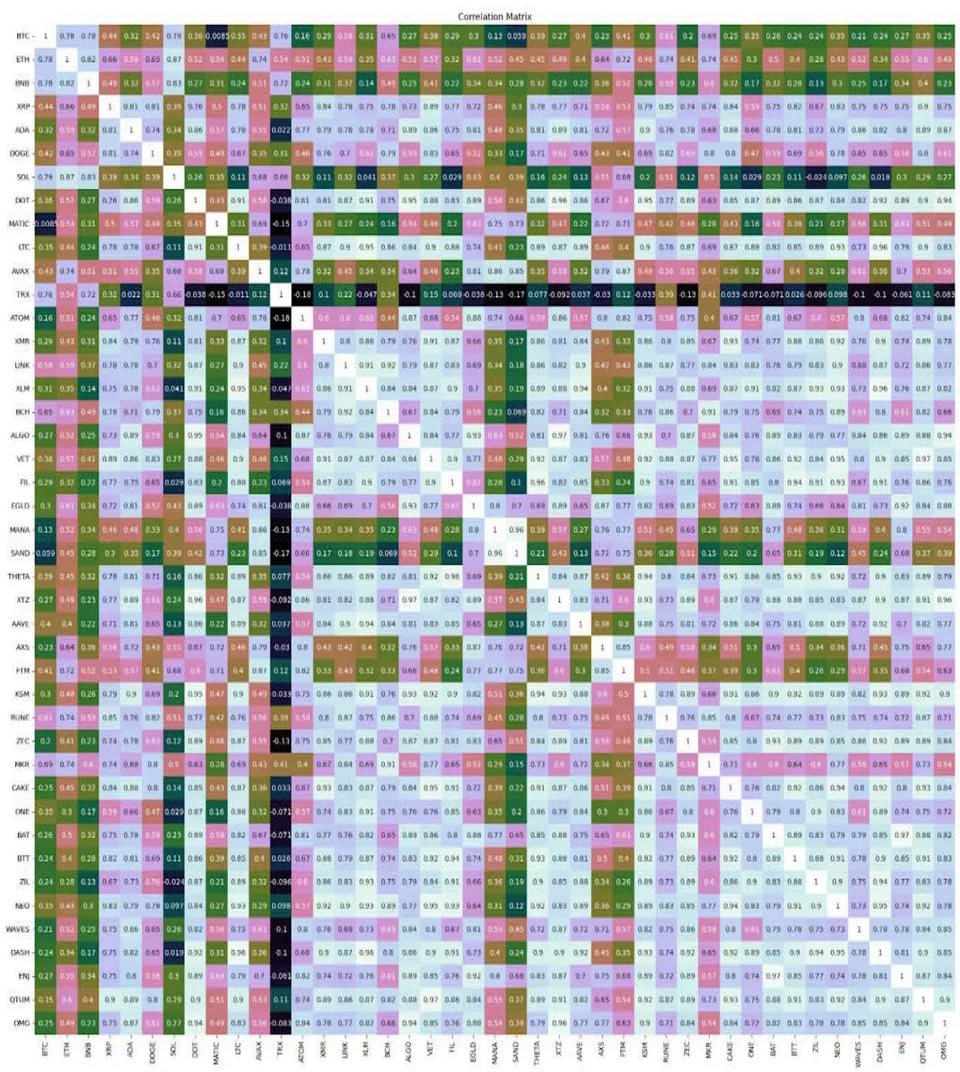
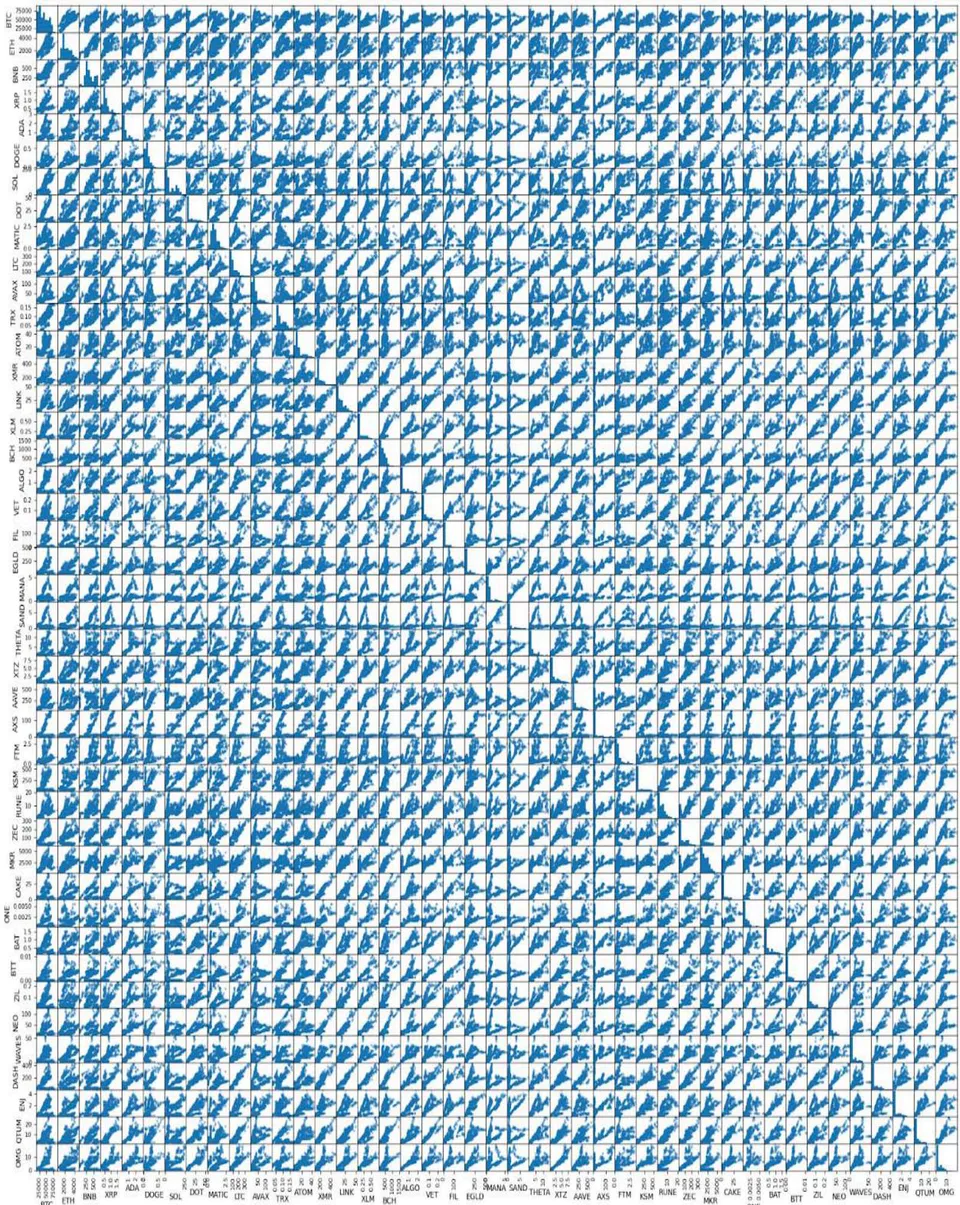
Data Visualization: Visualizing data is one of the quickest ways to gain insights into it. This process involves examining each attribute in the dataset individually to better understand its characteristics. Key tools for this include the correlation matrix and scatter plot, which help reveal relationships within the data. The correlation matrix calculates and displays the correlation between every pair of variables. This not only highlights the relationship between independent and dependent variables but also reveals correlations among the independent variables. Understanding these relationships is essential, as highly correlated input variables can negatively impact the performance of certain machine learning algorithms, such as linear and logistic regression. However, a pairs trade strategy relies on the historical correlation between two assets, requiring a strong positive correlation between them. This correlation serves as the key factor driving the strategy's profitability. The correlation matrix results, presented in Appendix (II), indicate a strong correlation between the daily returns of cryptocurrencies, along with a significant negative correlation among the returns of various cryptocurrencies in the market. Additionally, the study uses a scatterplot matrix to visualize relationships between all regression variables. By examining the scatterplot (Appendix III), some linear relationships with the predicted variable are observed, providing further insights into the data.
4.1 Algorithms and Models and their Evaluation
Following Tatsat et al (2020), this study employed clustering algorithms to identify pairs of cryptocurrencies suitable for a pairs trading strategy. Three clustering techniques were utilized: k-means Clustering, Hierarchical Clustering, and Affinity Propagation Clustering. The outcomes of these techniques are visualized and analysed in this section.
4.2 k-means Clustering
k-means is one of the most widely recognized clustering techniques. Its primary objective is to identify and group data points into clusters with high internal similarity. The algorithm works by defining k clusters and minimizing the total variation (or error) within these clusters (Tatsat et al., 2020). To determine the optimal number of clusters, two methods were applied: the Elbow method, which relies on the sum of squared errors (SSE) within clusters, and the Silhouette method, which evaluates cluster quality using the silhouette score (Shi et al., 2021; and Hamka, &
Ramdhoni, 2022). Their outputs are presented in Chart (1) and (2). Examining the previous charts, the optimal number of clusters appears to be around five. As the number of clusters increases beyond five, the within-cluster SSE (Sum of Squared Errors) begins to level off. In other words, the "elbow" in the SSE chart is noticeable at approximately five clusters. While other points in the graph may show slight kinks, the SSE difference becomes minimal after five clusters, making it reasonable to proceed with this number for the k-means model.
{"image_source":{"path":"images/34811c4c9c021cd22afbf947c40e497d67de7992c90f641911c939560457fd3a.jpg"},"content":"","chart_caption":[],"chart_footnote":[]} {"image_source":{"path":"images/60c63474be3c429ff04cd3ddf26dd80e56e0ee07eab11c7446b32e6fe63370ff.jpg"},"content":"","chart_caption":[{"type":"text","content":"Chart (1): squared errors (SSE) within clusters"},{"type":"text","content":"Chart (2): Silhouette score"}],"chart_footnote":[]}
Furthermore, the study explores how clusters form within a dataset containing a large number of variables. One way to visualize clusters in a two-dimensional space is through a simple scatterplot. The Chart (3) below displays the number of clusters and their distinct separation. In the plot, we can observe distinct clusters differentiated by colours, with the data points grouped fairly well. The centroids of these clusters, represented by square markers, also show clear separation, indicating a good clustering outcome.
{"image_source":{"path":"images/5939d0bcb82e446bd8cd6d0057439897aedf154a87fc9366a128bbbf5d36b4b4.jpg"},"content":"","chart_caption":[{"type":"text","content":"The Chart (3): Displays the number of clusters and their distinct separation for k-means Clustering model"}],"chart_footnote":[]}
The diagram (1) illustrates the number of cryptocurrencies within each cluster, ranging from approximately 2 to 16. While the distribution is uneven, each cluster contains a substantial number of cryptocurrencies.
{"image_source":{"path":"images/b174f696249ff34f654f0b9f8fc10f430e3192c4cc23df590707fc9d2ca411c3.jpg"},"content":"","chart_caption":[{"type":"text","content":"Diagram (1): Illustrates the number of cryptocurrencies in each cluster"}],"chart_footnote":[]}
4.3 Hierarchical Clustering
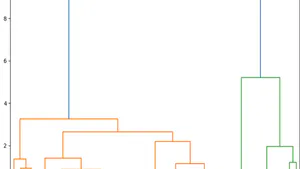
Hierarchical clustering organizes data into clusters with a clear top-to-bottom structure (Tatsat et al., 2020). Its advantages include ease of implementation, no need to predefine the number of clusters, and the ability to generate dendrograms that provide valuable insights into the data (Tatsat et al., 2020). However, interpreting dendrograms to determine the optimal number of clusters can be challenging for large datasets (Tatsat et al., 2020). In this study, we employed the agglomerative clustering algorithm, utilizing a dendrogram to analyse the data. The dendrogram displays a cluster tree, where the leaves represent individual cryptocurrencies, and the root represents the final, unified cluster. Setting a threshold cut at.8 resulted in 14 distinct clusters which are [array ([2, 1, 3, 5, 14, 12, 9, 11, 8, 6, 7, 10, 13, 4], dtype=int32)]. Chart (4) illustrates the dendrogram output from hierarchical clustering, where the distances between data points indicate dissimilarities, and the block heights reflect the distances between clusters.
{"image_source":{"path":"images/9c739bf30a7eb7fc7ec439a163b446ae3ad03e2e3751e82f9e4c2cfb3481521c.jpg"},"content":"","chart_caption":[{"type":"text","content":"Chart (1): Illustrates the dendrogram output of cryptocurrencies"}],"chart_footnote":[]}
The study develops a hierarchical clustering model with 14 clusters and presents the results visually. As shown in Chart (5), the visualization reveals distinct clusters, similar to the k-means clustering plot, with each cluster distinguished by different colours.
{"image_source":{"path":"images/092728e584437f6cdb63d37e4eb6cae5d120a98c9c9e0fe3dcd1092e8fcdb150.jpg"},"content":"","chart_caption":[{"type":"text","content":"Chart (5): Illustrates the number of clusters for Hierarchical Clustering algorithm"}],"chart_footnote":[]}
4.4 Affinity Propagation Clustering
Affinity propagation creates clusters by exchanging messages between data points until a stable configuration is achieved (Tatsat et al., 2020). Unlike methods such as k-means, it does not require specifying or estimating the number of clusters beforehand (Tatsat et al., 2020). The results of the affinity propagation clustering, illustrated in Chart (6), reveal several distinct clusters represented by different colours. Additionally, Chart (7) provides further visualization, showing that the cryptocurrencies under study are divided into seven clusters. Using the configured hyperparameters, the affinity propagation model produced significantly more clusters compared to k-means and hierarchical clustering. While the results highlight clear groupings, the higher number of clusters has also led to increased overlap.
{"image_source":{"path":"images/1a7f3f6a58e958c2b302a6ef3e9d15b163e44a481b4483c3abf41abab1f74b76.jpg"},"content":"","chart_caption":[{"type":"text","content":"Chart (6): Affinity Propagation Clustering output"}],"chart_footnote":[]} {"image_source":{"path":"images/abadf51eaece85b4bc4bae8269f61dd67669c8e82270952f4025ca1ea69b893a.jpg"},"content":"","chart_caption":[{"type":"text","content":"Chart (7): Shows the number of clusters under Affinity Propagation Algorithm"}],"chart_footnote":[]}
{"image_source":{"path":"images/f037dbfc0e029b3804af6a85642acab1ad649267e64da5bac5858acb868ae576.jpg"},"content":"","chart_caption":[{"type":"text","content":"Diagram (2): Illustrates the number of cryptocurrencies in each cluster"}],"chart_footnote":[]}
The diagram shows the number of cryptocurrencies in each cluster, varying from around 2 to 16. Although the distribution is not uniform, every cluster holds a significant number of cryptocurrencies.
In the next stage, we will assess the performance of these clustering techniques. The silhouette coefficient serves as a tool for evaluating performance, with higher scores indicating more well-defined clusters (Tatsat et al., 2020). This metric is calculated for each of the clustering methods mentioned earlier, and the evaluation results are presented below.
produces meaningful results. To evaluate this, the study visualizes the historical behaviour of cryptocurrency returns within these clusters, as illustrated in the following Charts (8). These charts reveal consistent movements and patterns in the returns of cryptocurrencies across all clusters, regardless of the number of cryptocurrencies involved. This consistency confirms the effectiveness of the clustering approach and may indicate cointegration among such cryptocurrencies in the market.
km 0.3107887958879484
hc 0.3569912941484719 ap 0.3758087559209252
Since affinity propagation delivers the best performance, we will proceed with this method and utilize 7 clusters as determined by its clustering approach.
VI. VISUALIZING THE RETURN WITHIN A CLUSTER
The analysis employs a clustering technique and determines the final number of clusters. However, it is crucial to assess whether the clustering {"image_source":{"path":"images/ac00817efec8992e54cdf9b369ca2930aecc3b1885ed84d039f52fe92b18dffe.jpg"},"content":"","chart_caption":[{"type":"text","content":"Cryptocurrencies Time Series for Cluster 6"}],"chart_footnote":[]}
{"image_source":{"path":"images/e46058e3e1ff02de1ec2400e91bc5e7dec7750454737b5d35953ae8aed8663fb.jpg"},"content":"","chart_caption":[{"type":"text","content":"Cryptocurrencies Time Series for Cluster 0"}],"chart_footnote":[]} {"image_source":{"path":"images/e78afaacc74ba7d09e4a7bc3320dd69eea45d9079980ec365260a4337345c6f7.jpg"},"content":"","chart_caption":[{"type":"text","content":"Cryptocurrencies Time Series for Cluster 4"}],"chart_footnote":[]}
{"image_source":{"path":"images/d1bc9bd55d03a8867ceb66d1646a7f1fb92296117ced546c227773ca8cad4ccd.jpg"},"content":"","chart_caption":[{"type":"text","content":"Cryptocurrencies Time Series for Cluster 3"}],"chart_footnote":[]} {"image_source":{"path":"images/acff3e2e4a4c9e8fba5bc8b4e67e008fdd0e0ef2667e74711bb69fe8f0ce697a.jpg"},"content":"","chart_caption":[{"type":"text","content":"Cryptocurrencies Time Series for Cluster 2"}],"chart_footnote":[]}
Chart (8): Visualizes the historical behaviour of cryptocurrency returns within these clusters
6.1 Pairs selection
After forming the clusters, various cointegration-based statistical methods can be utilized to identify cryptocurrency pairs within each cluster. Cointegration occurs when two or more non-stationary time series move together over time. The presence of cointegration can be confirmed using statistical techniques such as the Augmented Dickey-Fuller test and the Johansen test. In this stage, we analyse the cryptocurrencies within a cluster by testing for cointegration between potential pairs. To do this, we create a function (as detailed in the Appendix I) that generates a cointegration test score matrix, a p-value matrix, and identifies pairs with a p-value below 0.05.
Output:
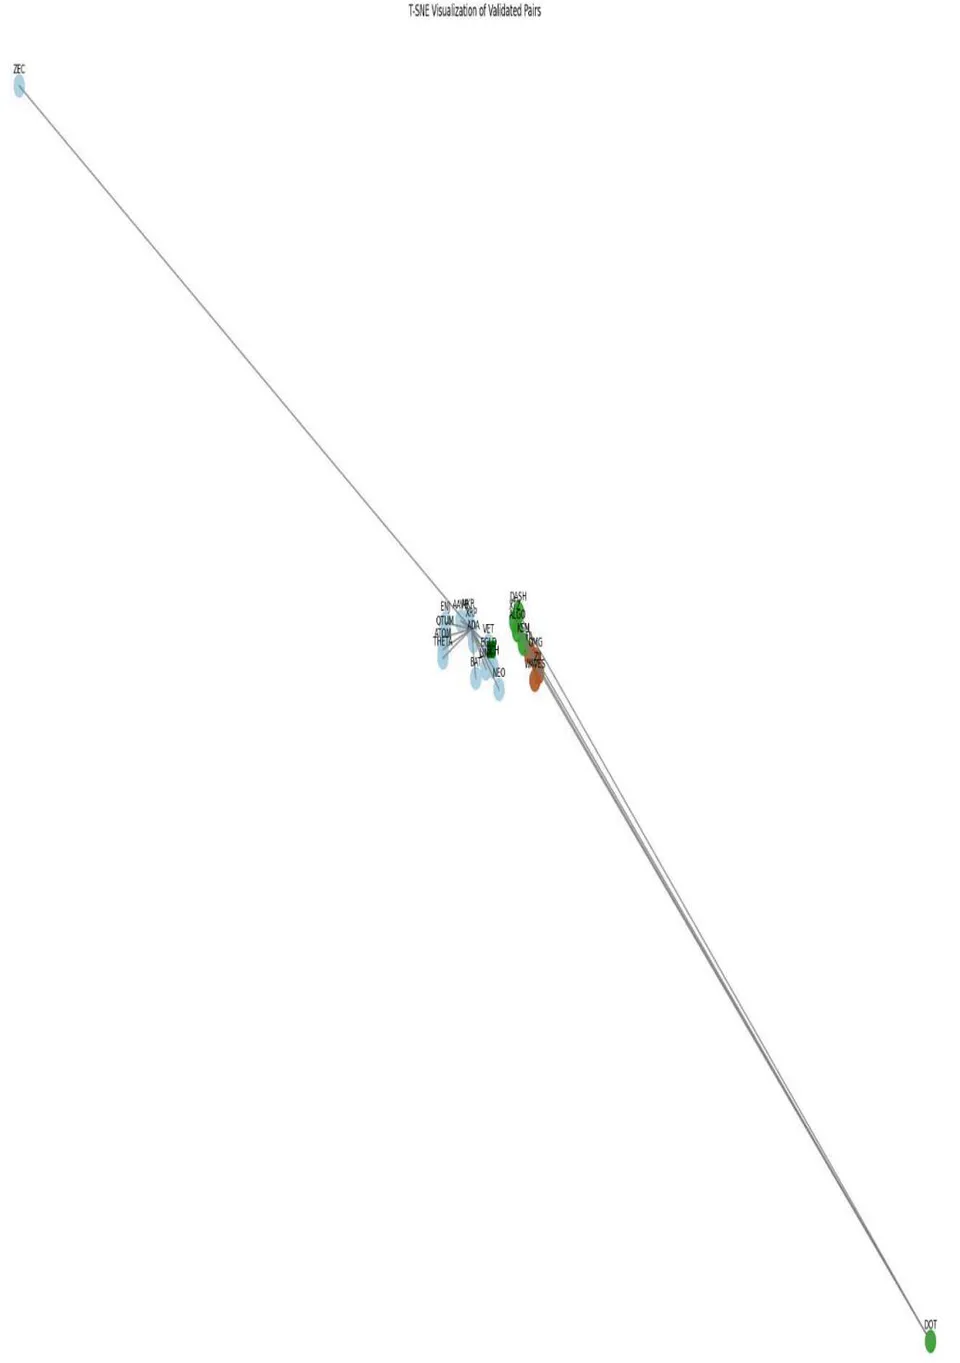
The results of the pair selection analysis revealed 21 pairs, encompassing 24 unique tickers. A detailed list of these pairs is provided below.
[(XRP, ADA), (XRP, ATOM), (XRP, LINK), (XRP, BCH), (XRP, VET), (XRP, EGLD), (XRP, THETA), (XRP, AAVE), (XRP, ZEC), (XRP, MKR), (XRP, BAT), (XRP, NEO), (XRP, ENJ), (XRP, QTUM), (DOT, ALGO), (DOT, XTZ), (DOT, KSM), (DOT, DASH), (FIL, ZIL), (FIL, WAVES), and (FIL, OMG)].
6.2 Pair Visualization
This section presents the outcomes of the pair selection process. For detailed steps regarding pair visualization using the t-SNE technique, refer to the Jupyter notebook in Appendix (I). The chart (9) highlights the effectiveness of k-means in identifying unconventional pairs (marked with arrows in the visualization), indicating the presence of a long-term stable relationship between cryptocurrency price movements. These identified pairs can be utilized in a pairs trading strategy. When the prices of a cryptocurrency pair deviate from their established long-term relationship, an investor could take a long position in the underperforming cryptocurrency while shorting the outperforming one. Profits are realized when the prices revert to their historical relationship. In other words, a profit is made from the convergence of the prices.
VII. CONCLUSION AND RECOMMENDATIONS
This study addresses the challenges posed by the high volatility and dynamic nature of cryptocurrency markets to traditional pairs trading strategies, which rely on static and linear assumptions. By employing machine learning clustering algorithms—specifically k-means, hierarchical clustering, and affinity propagation—the study enhances pair selection in pairs trading by uncovering latent relationships among cryptocurrencies. The primary objectives were to leverage clustering algorithms to group cryptocurrencies based on similar behavioural price patterns, identify cointegrated pairs for trading, and evaluate the performance of these models in addressing market volatility and enhancing trading robustness. The methodology involved comprehensive steps, including data preprocessing, exploratory data analysis, clustering using unsupervised machine learning techniques, and cointegration testing to finalize trading pairs.
The main findings reveal that clustering algorithms are effective in grouping cryptocurrencies based on shared characteristics of price patterns and volatility, with affinity propagation outperforming other methods in cluster definition and robustness. This is because affinity propagation is more effective than k-means and hierarchical clustering in certain scenarios due to its ability to automatically determine the number of clusters by selecting representative data points (exemplars) based on a similarity matrix, without requiring prior assumptions. Unlike k-means, it can handle clusters of arbitrary shape, is not sensitive to initialization, and is more robust to outliers. Compared to hierarchical clustering, affinity propagation avoids chaining effects and arbitrary cut-off decisions. It also allows flexible similarity measures and performs well with high-dimensional data. In addition, the findings indicate that twenty-one cointegrated pairs were identified, highlighting significant trading opportunities. These findings underscore the potential of clustering algorithms to improve trading strategies, address market volatility, and adapt to dynamic market conditions.
The practical implications include advancing trading strategies for cryptocurrencies investors by incorporating machine learning clustering algorithms to enhance market efficiency and profitability. In which, a clustering-based pairs trading strategy can enhance cryptocurrency trading by dynamically identifying pairs with strong relationships, such as XRP and ADA, based on historical price movements and market similarities. Unlike traditional methods that rely on fixed correlations, clustering enables traders to capitalize on temporary price divergences more effectively. For example, when XRP's price drops relative to ADA, the trader can buy XRP and short ADA, expecting convergence. This approach improves pair selection, enhances profitability, and reduces risk by capturing nuanced market dynamics, providing a data-driven edge over traditional strategies. In addition, policymakers are encouraged to develop regulatory frameworks that support the integration of advanced technologies in financial markets. For example, regulatory frameworks can support clustering techniques in algorithmic trading by addressing challenges like market manipulation and ensuring ethical use of machine learning. These frameworks could include real-time monitoring systems to detect suspicious patterns, mandates for algorithm transparency and explainability, data governance guidelines to prevent bias, pre-deployment testing to certify model compliance, and collaboration on standardizing clustering methodologies. Such measures would enhance market integrity, transparency, and stability while mitigating risks associated with algorithmic trading. The theoretical contributions involve bridging gaps in the literature by extending the application of clustering algorithms to a broader dataset of cryptocurrencies over an extended period, highlighting adaptive and multidimensional clustering models for trading strategy development.
7.1 Recommendations for future researcher
Future research could expand upon existing clustering studies, which predominantly focus on limited attributes such as historical prices or volatility. There is a significant gap in approaches that incorporate a broader range of data, including network activity (e.g., transaction volumes and fees), technological features (e.g., consensus mechanisms), and social sentiment metrics. Integrating clustering algorithms to classify cryptocurrencies based on multidimensional attributes—such as price, volatility, liquidity, user sentiment, trading patterns, transaction volume, fees, and blockchain characteristics—could yield valuable insights for pairs trading. Utilizing a multivariate clustering framework that combines on-chain data, off-chain sentiment, and financial indicators may lead to more robust clusters, enhancing the ability to identify optimal trading pairs. In addition, the current study predominantly employs basic clustering algorithms such as k-mean, hierarchical clustering and affinity propagation clustering. While these are effective for general segmentation, they may not adequately capture complex and non-linear relationships in cryptocurrency data. For future research we recommend to incorporating advanced clustering techniques like spectral clustering, density-based clustering (DBSCAN), or deep learning-based clustering methods (e.g., autoencoders or contrastive graph clustering) and these clustering models could better reveal nuanced relationships between cryptocurrencies.
APPENDICES
Conflict of Interest
The authors declare no conflict of interest.
Ethical Approval
Not applicable
Data Availability
The datasets used in this study are openly available at [repository link] and the source code is available on GitHub at [GitHub link].
Funding
This work did not receive any external funding.
References
Cite this article
Related Research


Special Issue
Launch a focused special issue to highlight research, emerging trends, and expert insights in your academic field.