


IntelliPaper
Abstract
Mango (Mangifera indica) is one of the most popular tropical terrestrial fruit bearing plants. Different phytochemicals especially, polyphenols (specifically flavonoids), terpenoids, xanthones are present in sufficient amount in different parts of mango, so that mangos are considered as nutraceuticals in treatmentof different diseases. Among thousand varieties of mango, eight varieties are selected for our study from our college garden. Bioactive components from these unripe mangos have been extracted. The estimation of total phenolic content with these extracts shows that ‘himsagar’ variety of mango contains highest concentration of polyphenols in different pH and incubation time at 37°C. UV-spectrometric screening for flavonoids present in unripe mango pulp of ‘himsagar’, reveals that this specific variety of mango contains kaempferol-3-glucuronide. The presence of this phytochemical has been confirmed by the application of UV shift reagents such as NaOH, NaOAc, NaOH+ NaOAc and NaOAc +H3BO3 reagents. In-silico study with the compound kaempferol-3-glucuronide, identifies the aldehyde reductase (AKR1B1) as target protein for drug design for different diseases. This gene is expressed in increased amount in head and neck cancer cells compared to normal cells. From a pan-cancer point of view, this specific gene is also differentially expressed in twelve types of cancer cells. By using gene network analysis and molecular docking studies with target gene AKR1B1 and phytochemical kaempferol-3- glucuronide, present in unripe mango pulp, the efficacy of this flavonoid has been discussed elaborately for the treatment of various types of cancers.
Explore Digital Article Text
I. INTRODUCTION
Mango is probably the most popular tropical terrestrial fruit bearing plant. Various parts of this tree have been used as an important herb in Ayurveda, since time immemorial. Mango comes from the Malayalam word- Maanga. The earliest evidence of the mango in India comes from sixty million years old fossils found in Damalgiri in Meghalaya. Thus it can be rightfully concluded that the lush fruit is India's gift to the world. Various parts of a mango fruit are known to be enriched with various nutraceutical compounds such as Mangiferin, kaempferol, protocatechuic acid and beta carotene. Studies show that these compounds have anti-diabetic and anti-carcinogenic effects [1]. Thus, study of phytochemicals present in mango is essential to identify, extract and ultimately utilize the nutraceuticals. Different phytochemicals present in mango plants are phenolic acids, xanthones and polyphenols (mainly flavonoids) [2]. Two types of phenolic acids are found in mango plant; they are: 1) Hydroxybenzoic acid derivatives 2) Hydroxycinnamic acid derivatives. Three types of polyphenols are present in mangoes [3] such as flavonoids (in high concentration), stilbenes and lignans. Flavonoids namely catechins, quercetin (mainly flavanols-glycosides of quercetin like glucose, galactose, rhamnose, xylose, arabinose), kaempferol, rhamnetin and anthocyanins and tannic acids, are obtained from mangoes. Furthermore, several other chemical compounds such as xanthones, mangiferin, dimethyl mangiferin, homomangiferin, mangiferin gallate, isomangiferin and isomangiferrin gallate are also available in mangoes .
Cancer is the second leading cause of death globally, accounting for an estimated 9.6 million deaths per year. The problem with cancer medication is that it also kills healthy cells in the patient's body. But certain phytochemicals show tremendous promise to act as nutraceuticals in treating detrimental diseases like cancer [5] and diabetes [6]. Mango is a traditional household fruit which is used to quench one's thirst of enjoying this lush fruit on a hot summer afternoon. Though mango has been used in ayurveda since time immemorial but its application in today's medicinal world is almost nil, may be due to lack of research in this area.
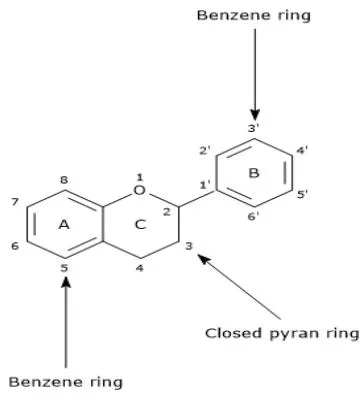
It was found that various phytochemicals like flavonoids, xanthones, polyphenols are present in considerable quantities in the edible part of mangoes. These phytochemicals are proven to interfere in biological action of our cells which gives beneficial outcomes for the individual. Certain phytochemicals like flavonoids, mangiferin, polyphenols show anticarcinogenic , antidiabetic properties and even act as antioxidants reducing the oxidative stress of the cells. Flavonoids are the most promising group of plant secondary metabolites which have proven to decrease the rate of tumorigenesis in various types of cancer. Chemically flavonoids are often hydroxylated in positions 3,5,7,2,3",4' and 5' in the basic flavonoid skeleton structure as shown in Figure 1.
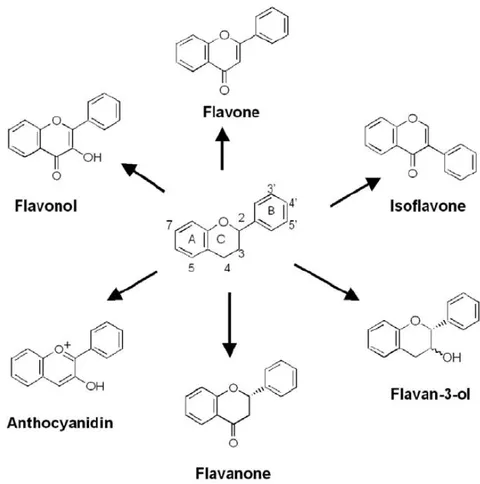
Flavonoids are classified as flavone, isoflavone, flavon-3-ol, flavanone, anthocyanidin and flavonol according to their chemical structures (Figure 2).
Most flavones and flavonols exhibit two major absorption bands in UV region. Band I (320-385 mm) represents the B ring absorption and Band II (250-285mm) represents the A ring absorption (A and B rings are shown in Figure 1). Functional groups attached to the flavonoid skeleton may cause a shift in adsorption bands are observed in UV spectrophotometric studies with flavonoids [8], such as at 367nm for kaempferol (3, 5, 7, 4' hydroxyl groups), 371 nm for quercetin (3, 5, 7, 3',4' hydroxyl groups), 374nm for myricetin (3, 5, 7, 3', 4', 5' hydroxyl groups). Flavonoids can be identified by comparing the observed absorption maxima with that of the already reported by other research groups.
The absence of 3- hydroxyl groups (3-OH) in flavones distinguishes them from flavonols. Flavanones have a saturated heterocyclic ring. So, the C ring with no conjugation, present in between the two A and B ring. Flavanones exhibit a strong Band II absorption maxima between 270 nm and 295 nm and only a shoulder for Band I at 326 and 327 nm. Band II with one peak at 270 nm for monosubstituted B ring but as two peaks or one peak at 258 nm with a shoulder (272 nm) one shoulder when di, tri, or O-substituted B ring is present. Natural flavonoids exist in plants in O- glycosides or c-glycosides [9]. O-glycosides are formed by attaching sugar in the hydroxyl oxygen. C- glycosides are sugar moieties combined directly to the flavonoid backbone. O-glycosides can hydrolyze into corresponding aglycones that show similar biological properties as aglycones. When glycosides are formed, the glycosidic linkage is normally located in positions 3 or 7 and the carbohydrates are 1- rhamnose, D-glucose, glucose rhamnose, galactose or arabinose.
With the help of various freely accessible databases, the target enzymes of the flavonoids were determined and then the types of cancer in which the enzyme showed an enhanced activity was determined as a part of the in silico study.
The main objective of this work was to identify the phytochemicals present in the pulp of several unripe mango cultivars and to study their effects on various enzymes involved in tumorigenesis as a part of in silico study.
Thousands of varieties of Mango cultivars are present in India- the ones used in our study are - a) chousa, b) rani pasand, c) saranga, d) kishen bhog, e) himsagar, f) begum-phuli, g) bel-kusum and h) langra. In this project the mesocarp (pulp) of the unripe mango fruit is used. The objective of the experiment is to identify anticarcinogenic phytochemicals present in the edible part of the mango fruit. Thus mesocarp (the edible part) of the fruit was used.
2.1 Sample collection
On 6.4.22, 8 varieties of unripe mango (Mangifera indica) were collected from the campus of Gurudas College library building. The varieties of the sample collected (and identified by Prof. Gautam Pahari, Dept. of Botany, Gurudas College) are as follows: -
| Sample no. | Name of the variety of mango |
| Sample 1 | Chousa |
| Sample 2 | Rani Pasand |
| Sample 3 | Saranga |
| Sample 4 | Kisan Bhog |
| Sample 5 | Himsagar |
| Sample 6 | Begum-phuli |
| Sample 7 | Bel-kusum |
| Sample 8 | Langra |
2.2 Sample preparation
On 7.4.22 all the 8 varieties of sample were washed and then their flesh was peeled off and the pulp was cut into smaller sections and grinded using mortar pestle and stored in eppendorfs.
2.3 Extraction of Bioactive components
On 13.4.22, 8 test tubes were labeled and 2 ml of ethanol was added in each of them. 300mg of each sample was added to the respectively labeled test tubes and were mixed well and allowed to stand undisturbed for a few hours.
2.4 Phytochemical Screening of extract
a. Test for Carbohydrates
Molisch test was performed for all the 8 samples. 2-3 drops of Molisch reagent was added to a small amount of the analyte in a test tube and mixed well. Next a few drops of conc. sulphuric acid was added dropwise along the walls of the test tube to facilitate the formation of a layer. The development of a purple ring at the layer formed by the conc. acid was found in all the 8 test tubes. Thus it was concluded that carbohydrate was present in all the 8 samples.
b. Test for phenols
Ferric chloride test for phenol:
5% concentrated ferric chloride solution was poured drop wise in 1 mL of diluted extract solution. The appearance of a greenish blue color confirms phenol is present.
c. Test for flavonoids
The aqueous filtrate from each plant extract was combined with 3 mL of dilute ammonia. The solution was then treated with 1 mL of concentrated sulphuric acid ( ). Flavonoids were detected in each extract by the presence of yellow color.
2.5 Phytochemical analysis
Variation of Concentration of Polyphenolic Compounds for different varieties of mango with varying pH and time at C was observed. 4 test tubes for each sample were taken. 2 of them were labeled for pH 4 and the remaining were labeled for pH 7. The two different pH were chosen to mimic the pH of our body during digestion. pH 4 represents the pH of gastric juice while pH 7 represents the pH of the rest of the gastro-intestinal tract (GIT). One of the test tubes of pH 4 was kept for 30 minutes at C water bath and the other test tube was kept at 120 minutes at C water bath for each of the samples. Same process was repeated for pH 7 labeled test tubes for each of the samples. pH capsules were used for making the pH 4 and pH 7 solutions and it was ensured that the pH of the solutions were correct with the help of pH meter. Concentration of the solutions were measured using a colorimeter via Folin-Ciocalteu test.
2.6 UV-Spectrophotometric screening for determination of Flavonoids present
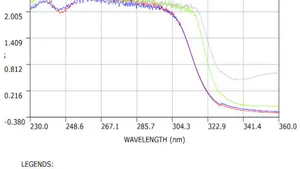
9g for each of the eight ethanolic samples UV-spectrophotometric screening was done within the range of 200-450 nm. The peaks and absorbance were noted for determination of the flavonoids that may be present in our samples. To further narrow down our search to determine the flavonoids present in mango pulp extracts, various UV shift reagents such as, NaOH, NaOAc were added into the ethanolic extract and the absorption spectra were analyzed. Different absorption maxima (peaks and shoulders) were observed during UV spectrometric analysis. Due to the presence of UV shift reagents, bathochromic and hypsochromic shifts were noted in different samples and subsequent conclusions were drawn.
2.7 In-silico study for pharmacological activity of flavonoids present in mango extract
In- silico Study for pharmacological activity of flavonoids present in mango extract, was executed by webtools such as Therapeutic Target Database (TTD). The target gene for identified phytochemical is selected from Therapeutic Target Database (TTD) (https://idrblab.net/ttd/) [10]. Biological activity has been determined for the target gene from KEGG (https://www.genome.jp/kegg/pathway.html) [11] database.
III. RESULTS
3.1 Phytochemical Screening of Mango pulp extract
Phytochemical screening confirmed the presence of phytochemicals like phenols, alkaloids, flavonoids, alkaloids and tannins in the ethanolic extract of mangoes as shown in Table 2.
| Sl. No. | Tests | Mango pulp ethanolic extract |
| 1. | Phenols | + |
| 2. | Flavonoids | + |
| 3. | Alkaloids | + |
| 4. | Tannins | + |
| 5. | Carbohydrates | + |
3.2 Variation of Concentration of polyphenols from different varieties with varying pH and time at C
The phenolic content of the test varieties of Mango was measured by using the Folin–Ciocalteu reagent (FCR) which is sensitive to polyphenols. The reagent gives as a blue color complex on reaction with the polyphenols. The F-C assay principle is based on the transfer of electrons. In alkaline medium, these act as reducing equivalents from phenols to phosphomolybdic/ phosphotungstic acid complexes that gives the blue colouration. The concentration of polyphenols in different varieties of mango are present in tabular form and graphical form in Table 3 and Figure 3.
| Sl.No. | Sample | Time (minutes) | Concentration at pH 4 (mg/ml) | Concentration at pH 7 (mg/ml) |
| 1. | Chousa | 30 | 1.8 | 1.28 |
| 120 | 1.88 | 1.75 | ||
| 2. | Rani Pasand | 30 | 1.88 | 1.49 |
| 120 | 1.88 | 2.15 | ||
| 3. | Saranga | 30 | 1.11 | 1 |
| 120 | 0.73 | 1.05 | ||
| 4. | Kishen Bhog | 30 | 0.73 | 1.23 |
| 120 | 0.78 | 1.18 | ||
| 5. | Himsagar | 30 | 8.3 | 4.4 |
| 120 | 4.4 | 4.4 | ||
| 6. | Begum-Fuli | 30 | 1.29 | 0.42 |
| 120 | 0.83 | 0.92 | ||
| 7. | Bel-kusum | 30 | 4.4 | 4.4 |
| 120 | 4.4 | 4.4 | ||
| 8. | Langra | 30 | 1.63 | 1.23 |
| 120 | 0.83 | 0.83 |
{"image_source":{"path":"images/9065bd1e619ba913ab896eb0b15b0bcb0ea0db5fee3e4befae7ccc355aaa12e7.jpg"},"content":"","chart_caption":[{"type":"text","content":"Figure 3: Graphical representation of Variation of Concentration of polyphenols for different varieties with varying pH and time at "},{"type":"equation_inline","content":"37^{\circ}"},{"type":"text","content":" C"}],"chart_footnote":[]} {"image_source":{"path":"images/14a07ba908a94c1b42b0589f09a679e38a8aacdaa95c16cc8ab8588377448eb2.jpg"},"content":"","chart_caption":[{"type":"text","content":"3.3 UV-Spectrophotometric screening for determination of Flavonoids present"},{"type":"text","content":"Figure 4: Graphical representation of the UV absorption peaks obtained during collection of UV spectrophotometric data for sample numbers 1,2,3,4,5"}],"chart_footnote":[]}
{"image_source":{"path":"images/d7e6af730dbae58cc1de458fdd8d2c83a17334fc2a82b79ea647210d9a1998e2.jpg"},"content":"","chart_caption":[{"type":"text","content":"Figure 5: Graphical representation of the UV absorption peaks obtained during collection of UV spectrophotometric data for sample numbers 6,7,8,5"}],"chart_footnote":[]}
| Sample Number | Bands Obtained with Reagent: Ethanol | Inference |
| 1 | 265 (BAND II) | Might be due to the presence of 5-Hydroxyflavone, 7-Hydroxyflavone or 5,7-Dihydroxyflavone. |
| 299 (BAND I)330 (SHOULDER) | Might be due to the presence of (2S,3S)-Dihydrokaempferol-3-O-β-D-glucoside or (2R,3R)-Dihydrokaempferol-3-O-β-D-glucoside. | |
| 2 | 267 (BAND II) | Might be due to the presence of 5-Hydroxyflavone, 7-Hydroxyflavone or 5,7-Dihydroxyflavone. |
| 289 (BAND I)330 (SHOULDER) | Might be due to the presence of (25,35)-Dihydrokaempferol-3-O-β-D-glucoside or (2R,3R)-Dihydrokaempferol-3-O-β-D-glucoside. | |
| 3 | 268 (BAND II) | Might be due to the presence of 5-Hydroxyflavone, 7-Hydroxyflavone or 5,7-Dihydroxyflavone. |
| 295 (BAND I) | No related inference | |
| 4 | 268 (BAND II) | Might be due to the presence of 5-Hydroxyflavone, 7-Hydroxyflavone or 5,7-Dihydroxyflavone. |
| 296 (BAND I)330 (SHOULDER) | Might be due to the presence of (25,35)-Dihydrokaempferol-3-O-β-D-glucoside or (2R,3R)-Dihydrokaempferol-3-O-β-D-glucoside. | |
| 5 | 263 (BAND II) | Might be due to the presence of 5-Hydroxyflavone, 7-Hydroxyflavone or 5,7-Dihydroxyflavone. |
| 302 (BAND I)354 (SHOULDER) | No related inference | |
| 6 | 267 (BAND II) | Might be due to the presence of 5-Hydroxyflavone, 7-Hydroxyflavone or 5,7-Dihydroxyflavone. |
| 291 (BAND I) | No related inference | |
| 7 | 267 (BAND II) | Might be due to the presence of 5-Hydroxyflavone, 7-Hydroxyflavone or 5,7-Dihydroxyflavone. |
| 295 (BAND I) | No related inference | |
| 8 | 267 (BAND II) | Might be due to the presence of 5-Hydroxyflavone, 7-Hydroxyflavone or 5,7-Dihydroxyflavone. |
| 295 (BAND I) | No related inference | |
| Sample Number | Bands Obtained With Reagent: Sodium Hydroxide | Inference |
| 1 | 360 (BAND I) | This shift from 299 nm to360 nm may confirm the presence of Dihydrokaempferol-3-O-β-D-glucoside |
| 2 | 351 (BAND I) | This shift from 289nm to351 nm may confirm the presence of Dihydrokaempferol-3-O-β-D-glucoside |
| 4 | 386 (BAND I) | This shift from 296 nm to386 nm may confirm the presence of Dihydrokaempferol-3-O-β-D-glucoside |
Table 5: Absorption maxima observed after addition of the UV shift reagent sodium hydroxide and the appropriate inference for presence or absence of Dihydrokaempferol-3-O-β-D-glucoside
| Sample Number | Band Obtained With Reagent: Sodium Acetate | Inference |
| 2 | 303 (BAND II) | This shift from 267 nm to 303 nm may confirm the presence of 5-Hydroxyflavone, 7-Hydroxyflavone or 5,7-Dihydroxyflavone |
| 3 | 340 (BAND II) | This shift from 268nm to 340 nm may confirm the presence of 5-Hydroxyflavone, 7-Hydroxyflavone or 5,7-Dihydroxyflavone |
| 4 | 245 (BAND II) | No related inference |
| 5 | 295 (BAND II) | This shift from 263 nm to 295 nm may confirm the presence of 5-Hydroxyflavone, 7-Hydroxyflavone or 5,7-Dihydroxyflavone |
| 6 | 296 (BAND II) | This shift from 267 nm to 296 nm may confirm the presence of 5-Hydroxyflavone, 7-Hydroxyflavone or 5,7-Dihydroxyflavone |
| 7 | 295 (BAND II) | This shift from 267 nm to 295 nm may confirm the presence of 5-Hydroxyflavone, 7-Hydroxyflavone or 5,7-Dihydroxyflavone |
| 8 | 295 (BAND II) | This shift from 267 nm to 295 nm may confirm the presence of 5-Hydroxyflavone, 7-Hydroxyflavone or 5,7-Dihydroxyflavone |
| Reagents | Sample 1 | Sample 2 | Sample 3 | Sample 4 | Sample 5 | Sample 6 | Sample 7 | Sample 8 |
| Ethanol | 265(II)299 (I)330 (sh) | 267 (II)289 (I)330 (sh) | 268 (II)295 (I) | 268(II)296 (I)330 (sh) | 263 (II)302 (I)354 (sh) | 267 (II)291 (I) | 267 (II)295 (I) | 267 (II)295 (I) |
| Sodium hydroxide | 360 (I) | 351 (I) | 386 (I) | 386 (I) | 386 (I) | 311 (I) | 387 (I) | |
| Sodium Acetate | 303 (I) | 340 (I) | 245(II) | 295(II) | 296 (I) | 295 (I) | 295 (I) |
| Sample Number | Reagents | Bands Obtained | Inference |
| 5 | Ethanol | 263 (BAND II)354 (SHOULDER) | This indicates presence of a free 4'- OH which further might confirm the presence of Kaempferol-3-glucuronide. |
| 5 | Sodium hydroxide | 356 (BAND I) | This indicates presence of a free 4'- OH which further might confirm the presence of Kaempferol-3-glucuronide. |
| 5 | Sodium acetate | 295 (BAND II) | This indicates presence of a free OH in the 7th position which further confirm the presence of Kaempferol-3-glucuronide. |
So, it can be concluded from the Table 5 that samples 1, 2, 4 may contain Dihydrokaempferol-3-O-B-D-glucoside. From the Table 6 it can be concluded that samples 1, 2, 3, 5, 6, 7, 8, may contain 5-Hydroxyflavone, 7-Hydroxyflavone or 5,7-Dihydroxyflavone. From Table 8 it can be concluded that the sample 5 may contain Kaempferol-3-glucuronide.
3.4.1 In-silico study for pharmacological activity of flavonoids present in mango extract
In silico study was done for the determined compound Kaempferol-3-glucuronide.
3.4.1 Determination of target from Therapeutic Target Database (TTD)
From the TTD [10] database, it was determined that the enzyme that is affected by Kaempferol-3-glucuronide is an aldose reductase. The gene name of target enzyme was found out to be AKR1B1(aldo-keto reductase family 1 member B1).
3.4.2 Functional annotation of AKR1B1 from KEGG database:
It catalyzes the NADH-dependent reduction of a wide variety of carbonyl - containing compounds to their corresponding alcohols with a broad range of catalytic efficiencies. According to KEGG pathway database , this target is relevant in the following pathways such as Pentose and glucuronate interconversions, Fructose and mannose metabolism, Galactose metabolism, Glycerolipid metabolism.
3.4.3 Involvement of target gene in cancer
Pan cancer analysis was executed to identify the role of AKR1B1 gene in cancers. For the target gene AKR1B1, a differential gene expression was observed in tumor, normal and metastatic tissues, which was obtained from the TNM plot . It was seen that its expression is higher in metastatic and tumor cells than in normal cells (Figure 6).
{"image_source":{"path":"images/cebeacc90851e09cd6ecd472d17149ef660cad1e0114196263618755b4847118.jpg"},"content":"","chart_caption":[{"type":"text","content":"Figure 6: Comparison of AKR1B1 gene expression in normal, tumor and metastatic cells"}],"chart_footnote":[]} {"image_source":{"path":"images/3f3caaee5b01f6eabced096200cc7752f30996d7a7e8ddf10e840099f7b056c7.jpg"},"content":"","chart_caption":[{"type":"text","content":"Figure 6(a): AKR1B1 gene expression in head and neck cell cancer is much more compared to normal cells in head and neck"}],"chart_footnote":[]}
Comparing AKR1B1 gene's involvement in various cancers it was found out that AKR1B1 gene expression in head and neck cell cancer is much more compared to normal cells in head and neck.
{"image_source":{"path":"images/8f41539232be69cf0cf7c194926fe0da6266d961bce46246d7592c8296a91db3.jpg"},"content":"","chart_caption":[{"type":"text","content":"Figure 6(b): AKR1B1 gene expression in head and neck cell cancer is much more compared to normal cells in head and neck (TCGA cancers) [13]."}],"chart_footnote":[]}
Further analysis of expression of AKR1B1 gene, shows that (Figure 6(b)), in five other types of cancer cells its expression is higher in tumor cells compared to normal cells. They are Liver Hepatocellular Carcinoma (LIHC), Cervical Squamous cell Carcinoma (CESC), Sarcoma, Kidney Renal Papillary cell Carcinoma (KRPCC), and Skin Cutaneous Melanoma (SCM). In all the above mentioned cancer types, correlated genes with AKR1B1 were determined and then analyzed for at least five common genes to form a string correlation. Through rigorous screening, it was found out that AKR1B1, ATP6V1F, GLA, and G6PD were found to be common in HNSC and Sarcoma.
IV. DISCUSSION
Phytochemical screening of mango pulp extract confirmed the presence of phenols, flavonoids, alkaloids, tanins and carbohydrates in all eight samples. Moreover, that the concentration of polyphenol present in mango pulp extract is highest in sample no. 5 i.e. in himsagar variety of mango for both the pH4 and pH7 conditions. Between these two pHs, at pH 4 condition, that is in pH of stomach, the amount of polyphenol is present in higher amount (8.3 mg/ml) compared to that of pH 7 (4.4 mg/ml).
UV spectrophotometric screening of mango pulp extract shows drastic variation in absorption spectra among all samples. Sample no. 1 shows two bands at 299 nm (band I) and 265 nm (band II) with a shoulder at 330 nm. Similarly, sample number 2, 4 also show the three bands in almost same wavelength. Furthermore, for sample no. 5 in addition to two bands at 302nm (band I) and 263 nm (band II), a shoulder band is observed at 354 nm. For three samples with sample no. 6, 7, 8, two bands in UV spectra are observed in 295 nm (band I) and 267 nm (band II) respectively. So, it can be concluded that in addition to 5 hydroxyflavone, 7 hydroxyflavone and 5,7 dihydroxyflavone, a unique flavonoid, 2,3 dihydrokaempferol is also present in different samples such as sample no. 1,2, and 4. For these three samples the bathochromic shift of band I from 299 nm to 360 nm, indicates the presence of dihydrokaempferol-3-O-B-D-glucoside in those samples, in presence of NaOH solution. Moreover, due to presence of shift reagent sodium acetate, the band II, shifts from 276 nm to 295 nm, confirms the presence of 5 hydroxyflavone, 7 hydroxyflavone and 5,7 dihydroxyflavone in different samples.
From the in silico study it can be concluded that Kaempferol-3-glucuronide decreases the catalytic activity of the enzymes coded by the following genes AKR1B1, CLIP4, ATP6V1F, G6PD and GLA. Thus this phytochemical decreases the tumorigenesis in the cancer cell types (Liver Hepatocellular Carcinoma (LIHC), Cervical Squamous Cell Carcinoma (CESC), Sarcoma, Kidney Renal Papillary Cell Carcinoma (KRPCC), and Skin Cutaneous Melanoma (SCM)), where these genes are overexpressed.
Conflict of Interest
The authors declare no conflict of interest.
Ethical Approval
Not applicable
Data Availability
The datasets used in this study are openly available at [repository link] and the source code is available on GitHub at [GitHub link].
Funding
This work did not receive any external funding.
References
Cite this article
Related Research

Special Issue
Launch a focused special issue to highlight research, emerging trends, and expert insights in your academic field.